I wrote on 4th August that the best trade opportunities for the week were likely to be going long of the following currency crosses; here are the results:
- EUR/JPY – a win of 0.13%.
- EUR/CHF – a win of 0.93%.
- GBP/JPY – a loss of 0.30%.
- CAD/JPY – a win of 1.13%.
- CHF/JPY – a loss of 0.75%.
- AUD/JPY – a win of 1.02%.
- GBP/CHF – a win of 0.60%.
- NZD/JPY – a win of 0.77%.
- CAD/CHF – a win of 2.04%.
These trades gave a total win of 5.57%, averaging a win of 0.62% per asset.
Last week’s key takeaways were:
- Last week saw a wild ride in financial markets, but the excessive swings up and down did not seem to be driven by any fundamental data. It looked to be more of a case of trends unwinding and causing a large spike in volatility, as often happens at the end of a trend. One of the most dramatic shocks was seen in the Japanese stock market, with the Nikkei 225 Index falling by more than 10% one day and then rising by more than 10% the next! The Japanese Yen also saw a huge swing higher, followed by a swing back as the Yen began to be sold again. The market started in a kind of risk-off swing before swinging back into risk-on as the week advanced, ending on a risk-on note. However, it seems that the volatility shock is over by now, so we will likely not see wild swings over the coming week. However, any US CPI (inflation) data surprises could trigger substantial market movements.
- US ISM Services PMI came in more or less as expected, so there was no surprise regarding the US economy.
- Reserve Bank of Australia Cash Rate, Rate Statement, and Monetary Policy Rate. The RBA maintained its Cash Rate at 4.35%, as was widely expected. However, the Bank did state that rates would not be cut for at least six months and that a rate hike had been considered. This boosted the AUD over the remainder of the week after it had sold off massively.
- New Zealand Inflation Expectations were slightly lower than expected, suggesting declining inflationary pressures.
- The Canadian and New Zealand Unemployment Rates were slightly lower than expected, suggesting more buoyant economic conditions.
It will be a busier week ahead in terms of data, with the most important items this coming week expected to be:
- US CPI
- US PPI
- US Retail Sales
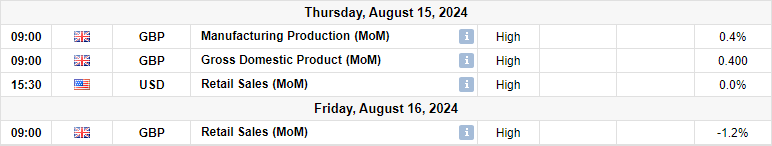
- UK CPI
- UK Retail Sales
- UK GDP
- Australian Wage Price Index
- NZD Official Cash Rate, Rate Statement, and Monetary Policy Statement
- US Unemployment Claims
- UK Claimant Count Change
- Australian Unemployment Rate
I forecast that the EUR/USD currency pair will rise in value for August. The performance of my forecast so far is as follows:
")
Last week, I forecasted that the following currency crosses would rise in value:
- EUR/JPY
- EUR/CHF
- GBP/JPY
- CAD/JPY
- CHF/JPY
- AUD/JPY
- GBP/CHF
- NZD/JPY
- CAD/CHF
This was a good, profitable forecast.
This week, I gave no weekly forecast, as only one major currency pair or cross fluctuated in value by more than 2%. The odds of profitable reversals are better when several crosses have abnormally large price movements.
Directional volatility in the Forex market fell dramatically last week following a very volatile period. Only 30% of the most important currency pairs and crosses fluctuated by more than 1%.
Last week, the Canadian Dollar was the strongest major currency, while the Swiss Franc was the weakest.
You can trade these forecasts in a real or demo Forex brokerage account.
The US Dollar Index printed a weakly bullish pin bar last week, rejecting both the lower ascending trend line of the consolidating triangle chart pattern, which has been holding the Dollar for almost two years, and the horizontal support level at 102.25. These are bullish signs, although the bounce was not particularly strong. On the other hand, the price is below its levels three months ago and six months ago, indicating a long-term bearish trend in the greenback.
The US Dollar was not the main factor in the markets last week, with several other assets seeing much more dramatic swings, such as the Japanese Yen and Australian Dollar. However, that could probably change this week, as we will get the release of US CPI, which can cause big moves if it is surprising.
This week, I am cautiously bearish on the US Dollar due to the bearish trend. However, it is likely much will depend upon the US CPI data release to determine where the greenback ends this coming week.
I expected the EUR/USD currency pair to have potential resistance at $1.0998.
The H1 price chart below shows how the price action rejected this resistance level with a large bearish inside bar, marked by the down arrow within the price chart below, rejecting this resistance level shortly after the start of last Monday’s London / New York session overlap, signalling the timing of this bearish rejection.
This trade could still be open, but it has been nicely profitable so far, with a maximum reward-to-risk ratio of slightly more than 2 to 1.
Despite this bearish play setting up, I am bullish on this currency pair. It has recently made a new long-term high without making an overly deep bearish retracement, suggesting a valid long-term trend exists. That is why I hold a long position open here right now. I cannot say I am very optimistic about this trade, though, so maybe a smaller position is suitable.
I expected the USD/CHF currency pair to have potential support at $0.8435.
The H1 price chart below shows how the price action rejected this support level with a large bullish engulfing candlestick, marked by the up arrow within the price chart below, rejecting this support level shortly after the start of last Monday’s London / New York session overlap, signalling the timing of this bearish rejection.
This trade could still be open, but it has been nicely profitable so far, giving a maximum reward-to-risk ratio of more than 3 to 1.
The Swiss Franc made a very strong advance over the previous week, and the price bounced back this week.
Gold fell slightly in US Dollar terms last week. It initially dropped during the large risk-off swing early in the week before making a strong recovery. The precious metal ended the week not far from a new record all-time high closing price, which would be a bullish entry signal for trend or breakout traders.
I do not think Gold is looking bullish enough to justify a new long trade entry, but it threatens to make a technically significant bullish breakout, so it is worth watching.
The US Dollar is in a long-term bearish trend, which may help the price of Gold advance.
Bulls will look for a daily close above $2,470 or, even better, the big quarter-number at $2,500 before entering a new long trade here.
However, price action is choppy, with many recent deep retracements within the long, slow, bullish movement we have seen in Gold over recent months.
The S&P 500 Index, like several other risky assets, fell sharply at the start of the week before rebounding strongly enough to close higher, printing quite a large bullish pin bar,
This was the first bullish weekly candlestick we have seen after three consecutive weeks of declines, suggesting that this may be a significant bullish reversal candlestick.
The long-term trend remains bullish, although the decline from the recent record high made only a few weeks ago was deep enough to know out most trend traders.
Over the past few weeks, the S&P 500 Index has begun to outperform the NASDAQ 100 index.
Anyone who sees this as an important supportive bounce in stock markets might prove their conviction with a long trade entry upon a break of last week’s high. I personally prefer to wait for a new all-time high, as we only recently had one a few weeks ago, before entering a new long trade here.
I see the best trading opportunities this week as:
- Long of the EUR/USD currency pair.
- Long of Gold in USD terms following a daily close at $2,471 or higher.
Ready to trade our Forex weekly forecast? We’ve made a list of the best Forex brokers worth reviewing.

")


")
")
")
")
")
")
")
")
")