The main tag of Forex News Today Articles.
You can use the search box below to find what you need.
[wd_asp id=1]
29
06, 2024
Pound Sterling fails to attract buyers ahead of UK election
- The Pound Sterling hit six-week lows near 1.2600 against the US Dollar.
- GBP/USD’s fate hinges on the UK election results and US Nonfarm Payrolls data.
- Any Pound Sterling recovery is set to be limited so long as the daily RSI stays below 50.
The Pound Sterling (GBP) continued to weaken against the US Dollar (USD) for the fourth week in a row, dragging the GBP/USD pair to a six-week low just above 1.2600. All eyes turn to the much-awaited UK general elections on July 4 and the US Nonfarm Payrolls data on July 5 for a fresh directional impetus to GBP/USD.
Pound Sterling extended its losing streak
The US Dollar extended its previous week’s strength and exacerbated GBP/USD’s pain. Greenback buyers flexed their muscles on fresh pushback by US Federal Reserve (Fed) policymakers against interest rate cuts this year, especially after the S&P Global preliminary US business activity jumped to a 26-month high on Friday. Data indicated fresh signs of US economic resilience, suggesting that the Fed could hold rates higher for longer.
Moreover, Fed Governor Michele Bowman’s hawkish commentary on Tuesday backed the US Dollar upside. Bowman said, “we are still not yet at the point where it is appropriate to lower the policy rate.” Governor Lisa Cook argued that the timing of the rate cut is unclear even though “Inflation has slowed, and the labor market tightness has eased.”
Renewed hawkish Fed expectations boosted the US Treasury bond yields, fuelling a fresh US Dollar advance at the expense of the Pound Sterling. Markets’ pricing of a 25 basis points (bps) Fed rate cut in September stayed almost unchanged at 57% during the week, according to CME FedWatch Tool.
The US Dollar also found demand from the half-year-end flows, as traders adjusted their positions heading into a likely first interest rate cut by the Fed this year. Further, the continued decline in the Japanese Yen to a 38-year low, propelled USD/JPY beyond 161.00, providing extra legs to the buck’s upsurge to two-month highs against its major currency rivals. This mainly contributed to the ongoing downtrend in the GBP/USD pair, as it touched its lowest since May 15 at 1.2613.
Meanwhile, Thursday’s mixed US final Gross Domestic Product (GDP) estimate, Durable Goods Orders and Pending Home Sales data briefly caused a retreat in the US Dollar, in part due to profit-taking ahead of Friday’s US Personal Consumption Expenditures (PCE) inflation data. The first US presidential election debate between President Joe Biden and Republican Presidential Nominee Donald Trump failed to have any meaningful market impact.
The Pound Sterling’s recovery attempts got sold into the market’s anxiety ahead of next week’s UK general elections, in the face of limited market-moving events from the UK. Data showed on Friday, the UK economy grew 0.7% QoQ in the first quarter of 2024, revised upward from the preliminary reading of 0.6%.
On the last trading day of the second quarter, the data from the US showed that the PCE Price Index remained unchanged on a monthly basis in May. The core PCE Price Index, the Fed’s preferred gauge of inflation, rose 2.6% on a yearly basis. This reading followed the 2.8% increase recorded in April and came in line with the market expectation. As the USD struggled to gather strength after this data, GBP/USD held comfortably above 1.2600 heading into the weekend.
UK election and US Nonfarm Payrolls in the spotlight
GBP/USD traders witnessed a calm before the upcoming week’s storm, with a raft of high-impact events from both sides of the Atlantic lined up.
Monday kicks off with risk sentiment likely to be driven by Sunday’s French Parliamentary elections and China’s official Manufacturing and Services PMI data.
Later that day, the US docket will feature the ISM Manufacturing PMI report. On Tuesday, the US Job Openings survey will be published. However, the main focus will be on Fed Chair Jerome Powell’s words, as he participates in a policy panel at the annual European Central Bank’s (ECB) Forum on Central Banking in Sintra, Portugal.
GBP/USD’s reaction to Powell’s remarks could be temporary, as it is ahead of Wednesday’s Automatic Data Processing (ADP) Employment Change report, ISM Services PMI, and Minutes of the Fed’s June meeting.
The UK election will grab the eyeballs on Thursday, as Labour holds a 23-point lead over the Conservatives, according to the second and penultimate Ipsos voting intention poll of the election campaign. But, Rishi Sunak emerged as the most unpopular Prime Minister with Ipsos ever at this stage of the campaign. The outcome of the UK election is likely to have a significant impact on the Bank of England’s policy actions and the Pound Sterling’s medium-term outlook.
It’s a US market holiday on Thursday, and therefore, thin trading could exaggerate the UK election-led moves in the pair.
The US labor market report, including the Nonfarm Payrolls and Average Hourly Earnings, will be published on Friday alongside the weekly Jobless Claims data, drawing an end to an eventful week.
Traders will closely scrutinize speeches from the Fed policymakers for fresh insights on the rate-cut timing, affecting the value of the US Dollar and the performance of the major.
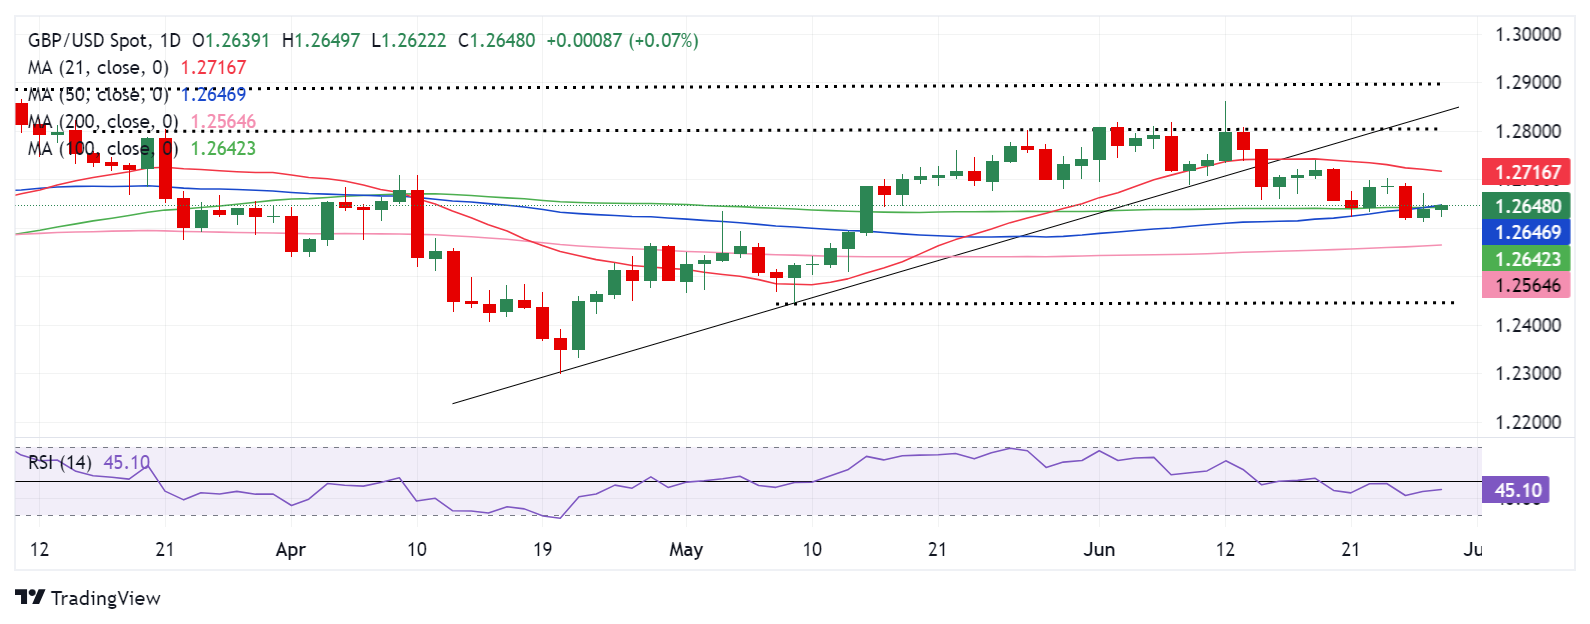
GBP/USD: Technical Outlook
Pound Sterling extended its bearish momentum, following a downside break of the rising trendline support two weeks ago.
The 14-day Relative Strength Index (RSI) points south below 50, currently near 42, adding credence to further downside moves.
Further, the pair has also breached the key support at 1.2645, the confluence of the 50-day Simple Moving Average (SMA) and the 100-day SMA, in another bearish signal.
However, a fresh bullish crossover, represented by the 50-day SMA crossing above the 100-day SMA on Thursday, warrants caution for sellers.
GBP/USD needs a decisive break below the May 15 low of 1.2584 for the downtrend to regain traction.
The 200-day SMA at 1.2564 will be the next line of defense for Pound Sterling buyers, below which a fresh decline toward the May 9 low of 1.2446 will be on the cards.
On the flip side, buyers must yield a weekly candlestick close above the aforesaid key confluence support-turned-resistance at 1.2645. The next upside target is aligned at the 21-day SMA at 1.2715.
Acceptance above the latter would open the door for a test of the 1.2800 static resistance, followed by the March 8 high of 1.2894.
Pound Sterling FAQs
The Pound Sterling (GBP) is the oldest currency in the world (886 AD) and the official currency of the United Kingdom. It is the fourth most traded unit for foreign exchange (FX) in the world, accounting for 12% of all transactions, averaging $630 billion a day, according to 2022 data. Its key trading pairs are GBP/USD, aka ‘Cable’, which accounts for 11% of FX, GBP/JPY, or the ‘Dragon’ as it is known by traders (3%), and EUR/GBP (2%). The Pound Sterling is issued by the Bank of England (BoE).
The single most important factor influencing the value of the Pound Sterling is monetary policy decided by the Bank of England. The BoE bases its decisions on whether it has achieved its primary goal of “price stability” – a steady inflation rate of around 2%. Its primary tool for achieving this is the adjustment of interest rates. When inflation is too high, the BoE will try to rein it in by raising interest rates, making it more expensive for people and businesses to access credit. This is generally positive for GBP, as higher interest rates make the UK a more attractive place for global investors to park their money. When inflation falls too low it is a sign economic growth is slowing. In this scenario, the BoE will consider lowering interest rates to cheapen credit so businesses will borrow more to invest in growth-generating projects.
Data releases gauge the health of the economy and can impact the value of the Pound Sterling. Indicators such as GDP, Manufacturing and Services PMIs, and employment can all influence the direction of the GBP. A strong economy is good for Sterling. Not only does it attract more foreign investment but it may encourage the BoE to put up interest rates, which will directly strengthen GBP. Otherwise, if economic data is weak, the Pound Sterling is likely to fall.
Another significant data release for the Pound Sterling is the Trade Balance. This indicator measures the difference between what a country earns from its exports and what it spends on imports over a given period. If a country produces highly sought-after exports, its currency will benefit purely from the extra demand created from foreign buyers seeking to purchase these goods. Therefore, a positive net Trade Balance strengthens a currency and vice versa for a negative balance.


")


