The main tag of Forex News Today Articles.
You can use the search box below to find what you need.
[wd_asp id=1]

15 03, 2024

Thetanuts To Launch LRT Strategy Vault With Pendle’s PT-eETH

By |2024-03-15T06:36:53+02:00March 15, 2024|Forex News|0 Comments


Thetanuts Finance, a prominent decentralized on-chain options protocol, announced a groundbreaking development, as it unveils integration with Pendle Finance’s $PT-eETH offering to create a Leveraged LRT Strategy Vault on the Ethereum Mainnet.

This development marks Thetanuts Finance’ initial foray into the burgeoning realm of restaking and Liquid Restaking Tokens (LRTs) within DeFi. LRTs have become a powerful force, amassing over $10 billion in Total Value Locked (TVL).

Unlocking Additional Yield from Staked ETH

Restaking allows DeFi users to leverage their staked ETH for securing other networks and earning extra yield beyond the Ethereum Mainnet. Pioneered by EigenLayer, it offers users the flexibility to restake directly through their native dApp or via a liquid restaking protocol like EtherFi. By using liquid restaking protocols, users can generate LRTs (Liquid Staking Tokens) that can be further leveraged to earn additional yield elsewhere.

Currently, EtherFi is the leading LRT with a TVL exceeding $2.5 billion. It allows users to deposit various ETH variants (ETH, stETH, bETH, cbETH) to mint their eETH LRT. Holding eETH grants users increased rewards through EigenLayer points and protocol points like EtherFi Loyalty Points. Additionally, innovative third-party LRTs like Pendle Finance offer further yield opportunities by splitting eETH into $PT-eETH and $YT-eETH.

$PT-eETH: Fixed Yield for Staked ETH

$PT-eETH offers a fixed ~20% APY in exchange for forgoing eETH yields and points. $PT-eETH holders can redeem them for eETH at a 1:1 ratio upon maturity.

$YT-eETH, on the other hand, provides leveraged exposure to eETH yields and points streamed perpetually until maturity, at which point the token becomes worthless. Currently, $YT-eETH holders can accrue significantly multiplied EtherFi and EigenLayer points.

While Pendle Finance offers the highest fixed yield for ETH through $PT-eETH with guaranteed returns, Thetanuts Finance’s Leveraged LRT Strategy Vault unlocks even higher potential yields. Thetanuts integrates $PT-eETH to launch a unique vault on the Ethereum Mainnet.

$PT-eETH: Fixed Yield for Staked ETH

$PT-eETH holders traditionally had to wait for their tokens to mature on a specific date (June 27th in this case) to realize any gains. Thetanuts’ vault offers an alternative by allowing $PT-eETH holders to earn additional yield through option premiums and rewards while they wait.

Thetanuts’ mechanism involves “Zapping” $PT-eETH tokens into their v3 Lending Market, borrowing ETH, and depositing that ETH into their ETH Call Basic Vault to generate additional option premiums. However, this strategy introduces short volatility risk.

Thetanuts Unlocks Staked ETH Potential

Thetanuts’ Leveraged LRT Vaults empower $PT-eETH holders to utilize a previously locked asset. They can now generate additional yield through five channels: EigenLayer Points, EtherFi Loyalty Points, Pendle’s $PT-eETH Fixed Yield, Thetanuts’ ETH-C Basic Vault Option Premiums, and future $NUTS rewards (Thetanuts’ governance token).

Industry-First Innovation with Potential Risks

Thetanuts Finance is proud to introduce this industry-first solution with its innovative Leveraged LRT Strategy Vaults. This launch marks the first time an options market has created a new yield-generating tool for LRT-related staking products. Due to this novelty, high demand is anticipated for this new product, especially considering the current circulation of 150,000 $PT-eETH (worth approximately $577 million).

Thetanuts plans to initially launch the vault on the Ethereum Mainnet with future expansion to integrate other LRT protocols, enabling a similar strategy with a broader range of LRT collateral assets. 

It’s important to remember that, like all DeFi investments, $PT-eETH short-call vaults involve inherent risks. Depositors take on short volatility risk, which could lead to their deposits becoming worthless in case of a significant eETH or $PT-eETH market collapse.

Also Read: Swell Taps Polygon’s AggLayer for Crypto Restaking Solution


Source link

15 03, 2024

ForexLive Asia-Pacific FX news wrap: Japan fin min Suzuki says “no longer in deflation”

By |2024-03-15T05:55:09+02:00March 15, 2024|Forex News|0 Comments


Japan’s
finance minister Suzuki said today
that the
country was “no longer in deflation.” This
is a sharp turnaround from comments from officials previously.
Indeed, it was only Tuesday when Suzuki was reported as saying we
cannot declare deflation as beaten. Suzuki’s comment today is clear
support for the Bank of Japan to tighten policy.

For
a tightening of policy the board at the Bank of Japan will need to
see wage results that support the prospect of sustainable and stable
inflation around its 2% target. The Japan Renko wage news conference
is coming up at 16:15 Tokyo time (0715 GMT and 0315 US Eastern time)
and that will give us some guidance. Do note, however, that while the
wage rise agreed by the large corporations to be reported on at that
news conference today sets the upper limit for corporate Japan as a
whole, UBS has noted that “the amount of pass-through to small and
medium-sized firms will only become evident in the second (22 March)
and third (4 April) rounds of negotiations. The second round in
particular is typically considered crucial, as it will cover over
half of the total number of firms in scope.”

The
BoJ meet on April 18 and 19, and expectations are high for a policy
pivot at this meeting, but given the wage data to come later this
month and also in early April, the April 26 BoJ meeting may be the more
logical option for the pivot. In central bank land, a 5 week gap is
nothing. Having
said this the persistent news flow (JiJi, NHK, Nikkei reports,
amongst others) is for a March rate hike.

From
China today the People’s Bank of China left its medium-term lending
facility (MLF) rate unchanged at 2.5% for a seventh consecutive
month. In addition, the Bank injected 387 billion yuan vs. the 500 bn
maturing. This is the first net cash withdrawal through the MLF
liquidity instrument since November 2022.

At
its daily USD/CNY reference rate setting the rate was 7.0975 vs the 7.2058 expected.
This huge discrepancy of over 10 big figures, nearly 11, is the
biggest in 11 months. The Bank continues to prop up the yuan.

Regional
stocks lost ground following the weakness on Wall Street triggered by
another hot inflation reading (PPI @ 1.6% y/y vs. 1.1% expected).

The USD added to its Thursday gains, USD/JPY got as high as above 148.60 before running out of steam:

Bitcoin, and the crypto complex more broadly, lost ground. BTC/USD is around $67,500 as I post.


Source link

15 03, 2024

Market Comment: US PPI and retail sales data enter the limelight

By |2024-03-15T05:09:19+02:00March 15, 2024|Forex News|0 Comments


Reviews (1113)

173

5

Louis

My experience trading with Adro has been pretty successful. What I mainly like is that there is no commission and the fact that their spreads are pretty decent.

Professional

5

Barry

Their customer service is very profesional and helpful. Good platform, it has all features and tools that are necessary for beginners and expirienced traders.

Good broker

5

Sam

Been using them for almost a year now and they are great. Their platform has so many nice features. They provide very good signals.


Source link

15 03, 2024

XRP News Today: Ongoing Ripple Lawsuit Puts SEC’s Regulatory Power to the Test

By |2024-03-15T04:23:36+02:00March 15, 2024|Forex News|0 Comments


  • Ripple could seek exemption from Section 5 of the 1933 Securities Act for XRP sales to accredited US investors.
  • There was no fraudulent activity.
  • The US lacked a regulatory framework for the US digital asset space.

Hints from the SEC Motion to Compel

The SEC opening brief will highlight whether Ripple continued to breach Section 5 after the complaint. Ripple could face a punitive disgorgement if XRP sales to US institutional investors continued after the complaint.

In February, the court granted an SEC Motion to Compel. Judge Sarah Netburn stated,

“The SEC credibly argues that the District Judge may consider post-complaint conduct when determining whether an injunction is necessary and just.”

Judge Netburn also articulated the court would consider the defendant’s wealth in determining the size of a penalty.

In January, the SEC filed a Motion to Compel, asking the court to order Ripple to provide,

  • Financial statements for 2022/2023.
  • Post-complaint contracts governing institutional sales.

While the focus remains on the final stages of the SEC vs. Ripple case, SEC plans to appeal against the Programmatic Sales of XRP ruling could extend the case into 2025.

Significantly, the SEC will unlikely consider XRP-spot ETF applications until after the appeals process.

Events Influencing SEC Plans to Appeal

Beyond the SEC v Ripple case, other events that could influence SEC plans to appeal are,

  • The SEC v Coinbase case (COIN): Court ruling on the Coinbase Motion to Dismiss (MTD).
  • An Office of Inspector General investigation into crypto conflicts of interest within the SEC.
  • US Presidential Election: Republican front-runner Trump has softened his stance on crypto. A Trump victory could end SEC Chair Gary Gensler’s reign over the US crypto market.

XRP Price Action


Source link

15 03, 2024

Veteran Trader Peter Brandt Reveals Rare Bitcoin Price Chart

By |2024-03-15T03:37:55+02:00March 15, 2024|Forex News|0 Comments


Cover image via youtu.be

Disclaimer: The opinions expressed by our writers are their own and do not represent the views of U.Today. The financial and market information provided on U.Today is intended for informational purposes only. U.Today is not liable for any financial losses incurred while trading cryptocurrencies. Conduct your own research by contacting financial experts before making any investment decisions. We believe that all content is accurate as of the date of publication, but certain offers mentioned may no longer be available.

In the fast-paced and often tumultuous realm of cryptocurrency trading, seasoned trader Peter Brandt has emerged with a unique approach that has caught the attention of the market. Brandt, boasting over four decades of trading experience, has unveiled his secret weapon: the weekly Renko graph.

Brandt’s endorsement of the Renko chart as his primary method for evaluating BTC trends has stirred significant interest among traders. Renko graphs, unlike traditional charts, consolidate small price movements into distinct blocks, offering a lucid portrayal of prevailing market trends.

Hidden gem?

The veteran trader’s confidence in the Renko chart is underpinned by its remarkable accuracy. Previously, he disclosed that over the last few years, the method has only generated five incorrect signals, attesting to its reliability. Notably, one of the latest signals indicated a buying opportunity around the $20,000 mark, a prediction that has since materialized with Bitcoin’s current trading price soaring to $73,000.

The methodology behind Renko charts is both straightforward and potent. By condensing price movements into predetermined blocks or bricks, traders can identify sustained uptrends or downtrends based on specific unit values.

As market participants continue to seek an edge in this dynamic arena, Brandt’s strategy offers a compelling avenue for analysis and decision-making. Meanwhile, Bitcoin continues its ascent, now trading at an impressive $73,250 with a market capitalization surpassing $1.4 trillion, and Brandt’s chart remains a focal point of interest. With the Renko graph yet to indicate a downward trend, optimism among traders appears to lean toward the bullish side. 


Source link

15 03, 2024

Japan Chief Cabinet Secretary Hayashi expects the BoJ to stably hit its inflation target

By |2024-03-15T02:51:42+02:00March 15, 2024|Forex News|0 Comments


Japan Chief Cabinet Secretary Hayashi

  • Monetary policy falls under jurisdiction of the BOJ
  • Expect boj to
    conduct appropriate monetary policy to sustainably, stably hit its
    price target, working closely with govt
  • Specific tools of
    monetary policy, interpretation on economic indicators up to the BOJ

This article was written by Eamonn Sheridan at www.forexlive.com.


Source link

15 03, 2024

AUD to USD Forecast: Balancing RBA Hike Prospects and Fed Rate Cut Signals

By |2024-03-15T02:05:19+02:00March 15, 2024|Forex News|0 Comments


Policy measures to bolster the Chinese economy could boost demand and improve trade terms with Australia. Significantly, measures to support the Chinese real estate sector could influence iron ore prices and buyer appetite for the Aussie dollar.

US Economic Calendar: Michigan Consumer Sentiment in Focus

On Friday, US consumer sentiment figures for March warrant investor attention. Economists forecast the Michigan Consumer Sentiment Index to remain steady at 76.9. An unexpected rise in the Consumer Sentiment Index could sink bets on an H1 2024 Fed rate cut.

A pickup in consumer sentiment could signal an upward trend in consumer spending, fueling demand-driven inflation. The Fed could delay the timing of an interest rate cut to reduce disposable income and curb consumer spending.

However, investors must also consider the sub-components. Consumer inflation expectations could also move dial.

Other stats include NY Empire State Manufacturing and US industrial production numbers. However, barring a slump in production, the consumer sentiment figures will likely have more influence.

Short-Term Forecast

Near-term AUD/USD trends will hinge on US consumer sentiment and stimulus measures from China. Better-than-expected numbers from the US could impact buyer demand for the AUD/USD. However, policy measures to bolster the Chinese economy could influence the RBA rate path. The RBA left a rate hike on the table in February while the Fed plans to cut interest rates.

AUD/USD Price Action

Daily Chart

The AUD/USD hovered below the 200-day EMA while remaining above the 50-day EMA. The EMAs sent bullish near-term but bearish longer-term price signals.

An Aussie dollar break above the 200-day EMA would support a move toward the $0.67003 resistance level.

Australian inflation expectations, stimulus measures from Beijing, and US consumer sentiment need consideration.

Conversely, an AUD/USD drop below the $0.65760 support level and the 50-day EMA would bring the $0.65500 handle into play. Buying pressure could intensify at the $0.65760 support level. The 50-day EMA is confluent with the support level.

Considering the RSI indicator, a 14-period Daily RSI reading of 52.30 indicates an AUD/USD move to the $0.67003 resistance level before entering overbought territory.


Source link

15 03, 2024

UBS see broadening of equity market rally on Fed cuts, robust growth, falling inflation

By |2024-03-15T01:17:33+02:00March 15, 2024|Forex News|0 Comments


Source link

15 03, 2024

Gold Price Forecast: Support Levels and Potential Upside Continuation

By |2024-03-15T00:31:23+02:00March 15, 2024|Forex News|0 Comments


Deeper Retracement Still Possible

If a deeper retracement begins in gold there are several price zones to keep an eye on for possible support. The first being the prior record high at 2,135, followed by the 38.2% Fibonacci retracement at 2,115 and the 50% retracement at 2,090. The lower price zone is enhanced by the 20-Day MA, currently at 2,088, and the swing high from late December around 2,088. Further down is the 61.8% Fibonacci retracement at 2,065, which is confirmed by the swing high from February 1.

Bullish Continuation Scenario

Alternatively, since gold has been holding relatively strong since last week’s new record high of 2,195, an upside continuation remains a possibility before a deeper correction. A decisive breakout above today’s high of 2,177 would provide a bullish signal, with further confirmation provided on a rally above yesterday’s high of 2,180. This doesn’t mean it will keep rising though. It should be watched carefully for further signs confirming the bullish posture.

Nevertheless, the next higher targets comprise two ranges from Fibonacci extensions of prior swings. The first zone is from 2,235 to 2,246 and the second is from 2,277 to 2,298. The top of the second price zone also completes the initial target for a large rising ABCD pattern. That is where there is symmetry in price between the CD leg and the AB leg of the pattern. Once symmetry occurs the chance for a reversal increases.

Multi-Year Breakout in Play

Since there is only one more trading day left to the week it is likely that gold will end with a high inside week. In other words, the full trading range for the week is near the highs of last week. This shows strong demand remaining for gold. Keep in mind that gold closed at a new record high last week as it rose out of a multi-year basing pattern. That likely sets the stage for a multi-month or multi-year advance.

For a look at all of today’s economic events, check out our economic calendar.


Source link

14 03, 2024

Solana (SOL) to Hit ATH, But There’s Major Problem

By |2024-03-14T23:44:45+02:00March 14, 2024|Forex News|0 Comments


Cover image via www.freepik.com

Disclaimer: The opinions expressed by our writers are their own and do not represent the views of U.Today. The financial and market information provided on U.Today is intended for informational purposes only. U.Today is not liable for any financial losses incurred while trading cryptocurrencies. Conduct your own research by contacting financial experts before making any investment decisions. We believe that all content is accurate as of the date of publication, but certain offers mentioned may no longer be available.

The Solana network is on the verge of reaching a significant milestone, its market capitalization all-time high (ATH) nearing the $80 billion mark. However, this achievement may be overshadowed by an underlying concern that is not garnering much attention: the supply of SOL tokens has inflated from approximately 300 million to 443 million since the last bull market. This increase in supply can have far-reaching implications for the token’s value and investor sentiment.

When a cryptocurrency’s supply increases significantly without a commensurate rise in demand, it can lead to the dilution of the token’s value. For long-term holders of SOL, this inflation of the circulating supply means that their share of the network’s market capitalization has diminished. It is akin to a company issuing more shares; the value of existing shares tends to drop unless the company’s market valuation increases proportionately.

https://www.tradingview.com/
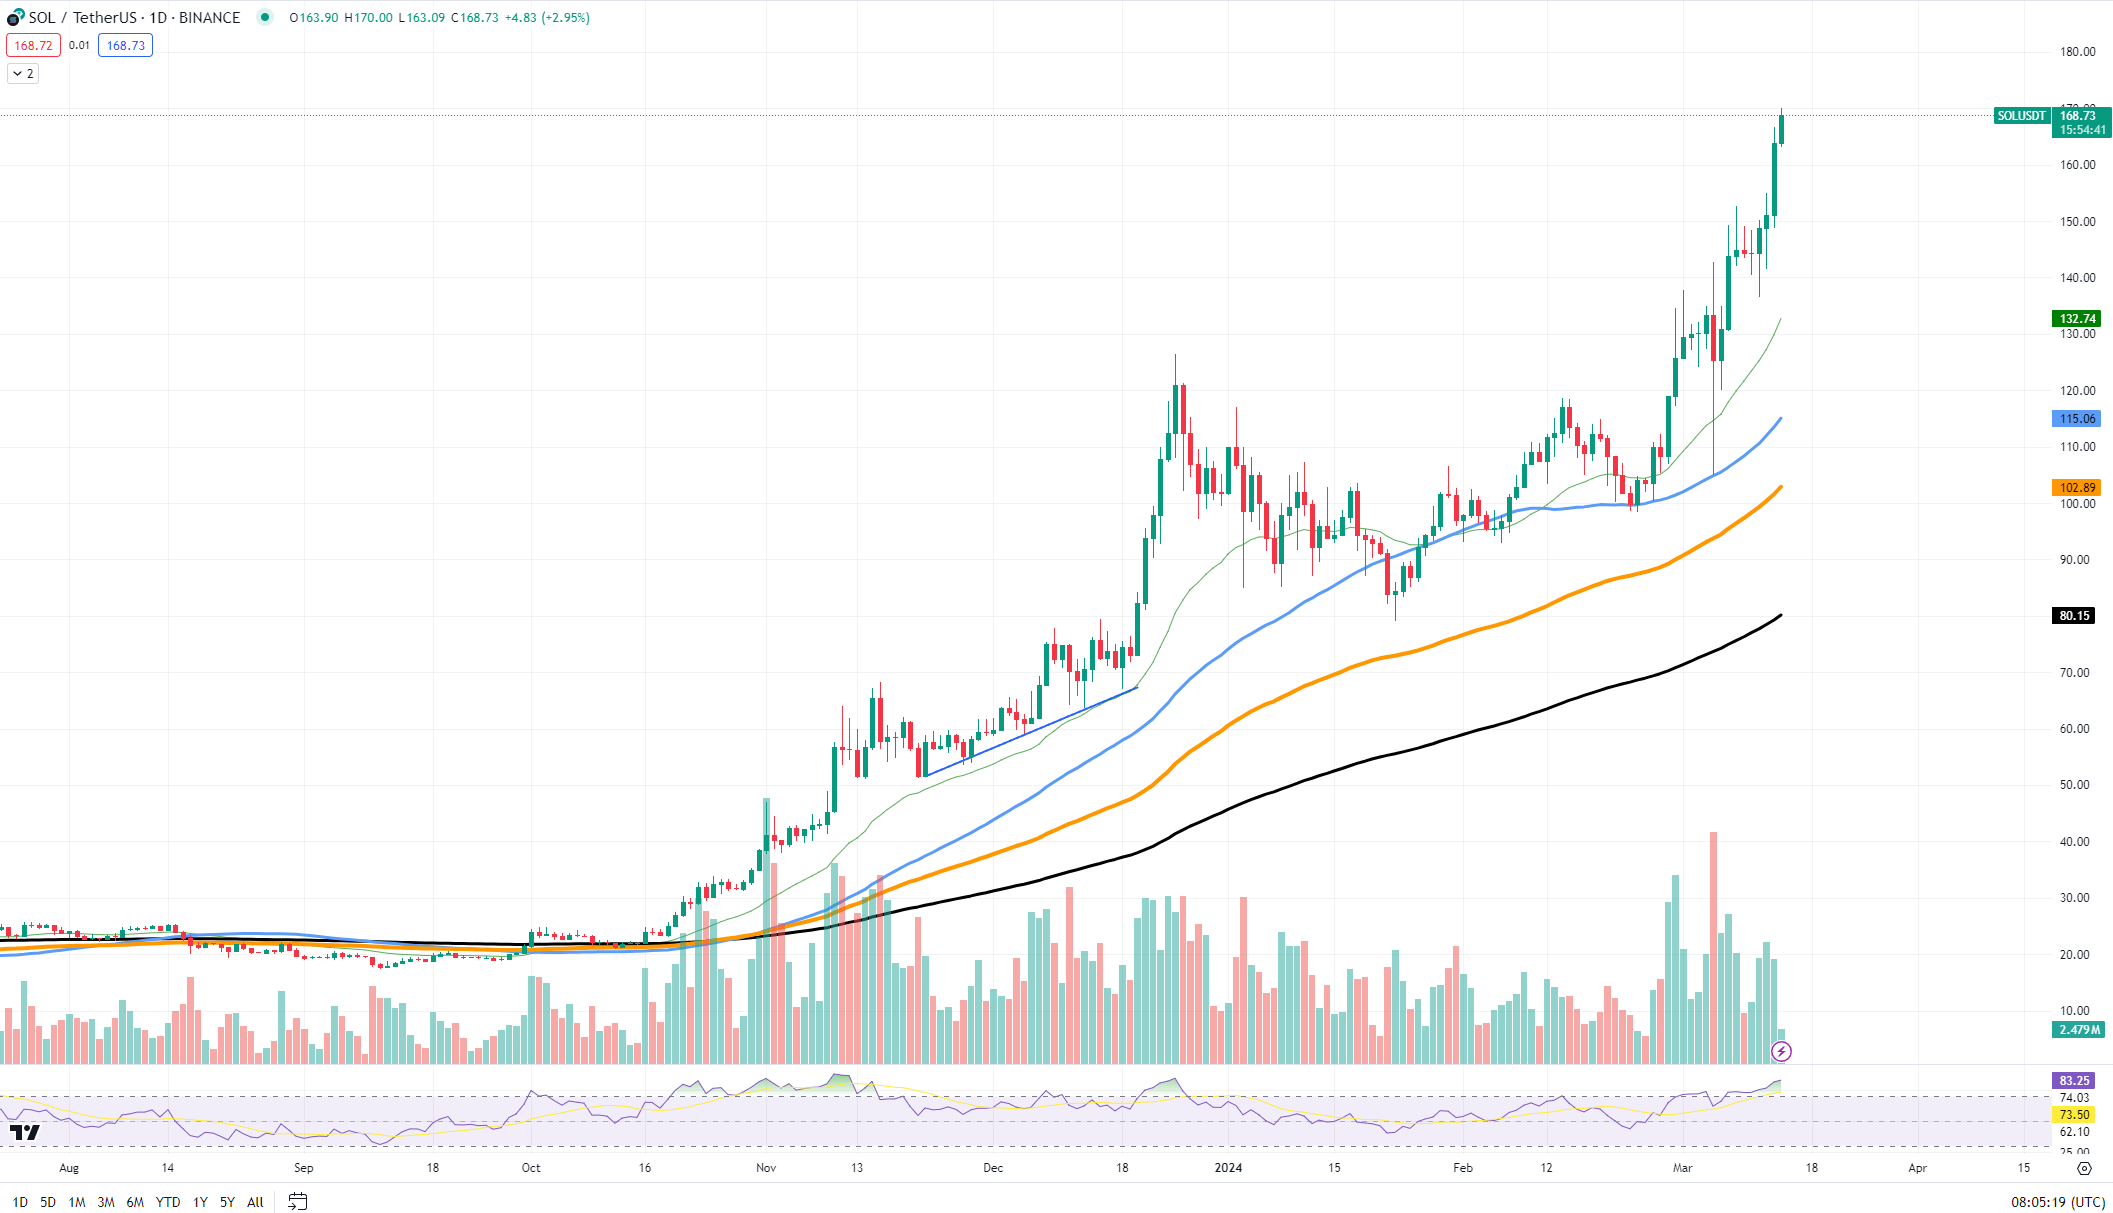
SOL/USDT Chart by TradingView

Turning to the Solana price chart, we observe a strong uptrend. The price of SOL has been on a steady climb, consistently finding support at its moving averages, which are well-aligned and sloping upwards, a bullish indicator. Particularly, the 50-day moving average has acted as a support for the price, aiding its upward trajectory.

The recent price candles show an accelerated pace in the appreciation of SOL’s value, hinting at bullish market sentiment. However, the increasing volume bars accompanying the price rise could be a double-edged sword: while it indicates strong buying interest, it also raises concerns about potential overbought conditions, especially as the Relative Strength Index (RSI) is trending toward overbought territory.

As of the latest candle on the chart, SOL is trading just below the $170 mark. While this points to strong short-term momentum, investors should be wary of potential pullbacks, given the RSI levels and the increased supply of tokens on the market. If the market begins to factor in the diluting effects of the inflated supply, the bullish momentum might wane, leading to price corrections.


Source link

Go to Top