The main tag of Forex News Today Articles.
You can use the search box below to find what you need.
[wd_asp id=1]

25 04, 2026

EUR/USD Forecast: Euro Holds 50-Day EMA (Video&Chart)

By |2026-04-25T15:40:08+03:00April 25, 2026|Forex News, News|0 Comments

EUR/USD Forecast: Euro Trying to Find Support at the 50 Day EMA

  • The euro has gone back and forth during the trading session on Thursday as we continue to see the 50-day EMA offering support.

  • The market is of course going to be watching the 50-day EMA as a floor and so far, it does look like it’s trying to hold up.

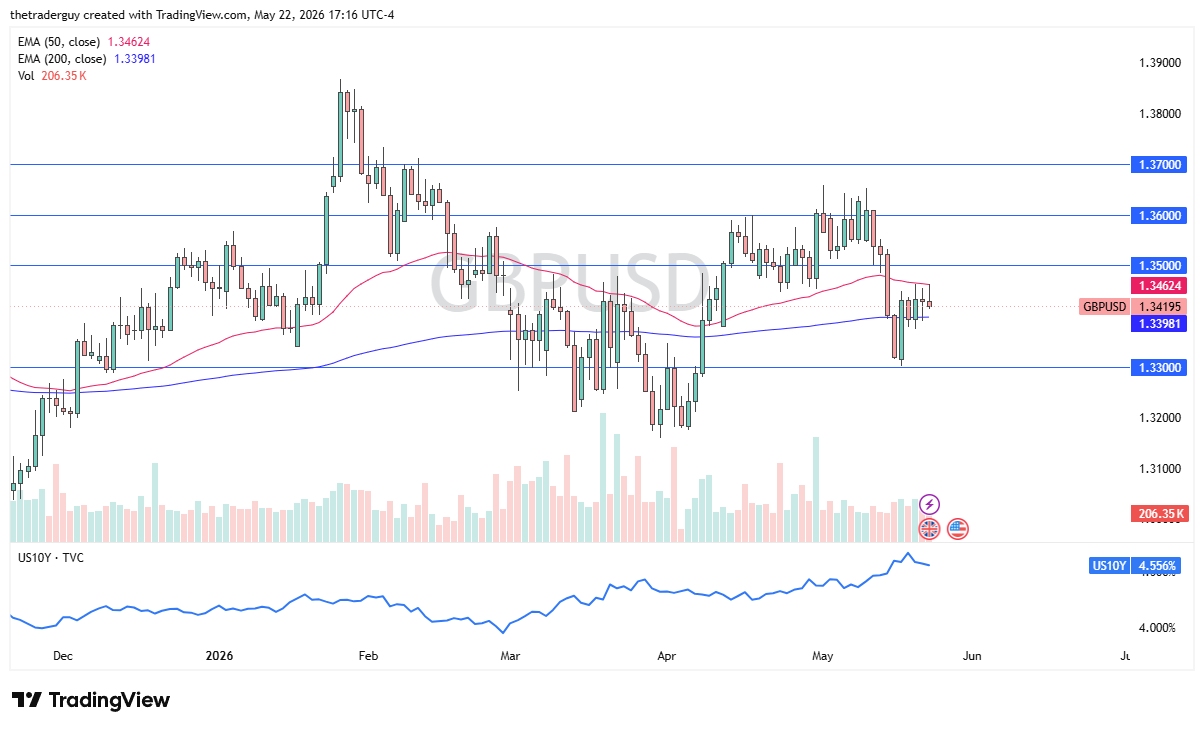
It is worth noting that the 10-year yield in the United States rose pretty significantly early during the session only to give that back up. Ultimately when I look at the EUR/USD chart, if we break down below the 50-day EMA then we could drop down to the 200-day EMA. To the upside of the 1.18 level is a barrier that I think is thick. It extends all the way to the 1.1850 level.

Interest Rate Differentials and Energy Prism

With this, I think you have a situation where traders are looking at this through the interest rate differential which favors the United States, but you should also keep in mind that traders are going to be looking at this through the prism of energy in the European Union as well.

After all, if there’s a major disruption in energy coming out of the Middle East to the European Union that’s going to have a massive influence on how their economies perform. So really at this point I think a little of a bounce makes a certain amount of sense, but there is a lot of resistance above and I think that will continue to be a bit of a struggle to get beyond there.

Really the only thing that I could see happening is if we see an end to the conflict in the Middle East. If we don’t, then you can look at this from a longer-term standpoint between the 1.14 and the 1.1850 level, but really, I think you’ve got a situation where you’re looking at this through the eyes of a range that’s getting close to the middle, so things might get choppy.

Ready to trade our EUR/USD analysis and predictions? Here are the best European brokers to choose from.

Christopher Lewis has been trading Forex and has over 20 years experience in financial markets. Chris has been a regular contributor to Daily Forex since the early days of the site. He writes about Forex for several online publications, including FX Empire, Investing.com, and his own site, aptly named The Trader Guy. Chris favours technical analysis methods to identify his trades and likes to trade equity indices and commodities as well as Forex. He favours a longer-term trading style, and his trades often last for days or weeks.

Source link

25 04, 2026

The GBPJPY fails in breaching the barrier– Forecast today – 24-4-2026

By |2026-04-25T11:38:53+03:00April 25, 2026|Forex News, News|0 Comments

Copper price remains affected by stochastic negativity, attempting to reach below $5.9700 to increase the chances of activating the temporary bearish corrective trend, to reach $5.8900 followed by $5.8200 level, which represents a new extra support against the current trading.


Forming a strong obstacle at $6.1200 level against the bullish attempts will increase the chances of forming negative attempts, to keep waiting to reach the previously suggested stations, to monitor its behavior to confirm the suggested trend in the upcoming trading.


The expected trading range for today is between $5.8200 and $6.0500


Trend forecast: Bearish


Source link

25 04, 2026

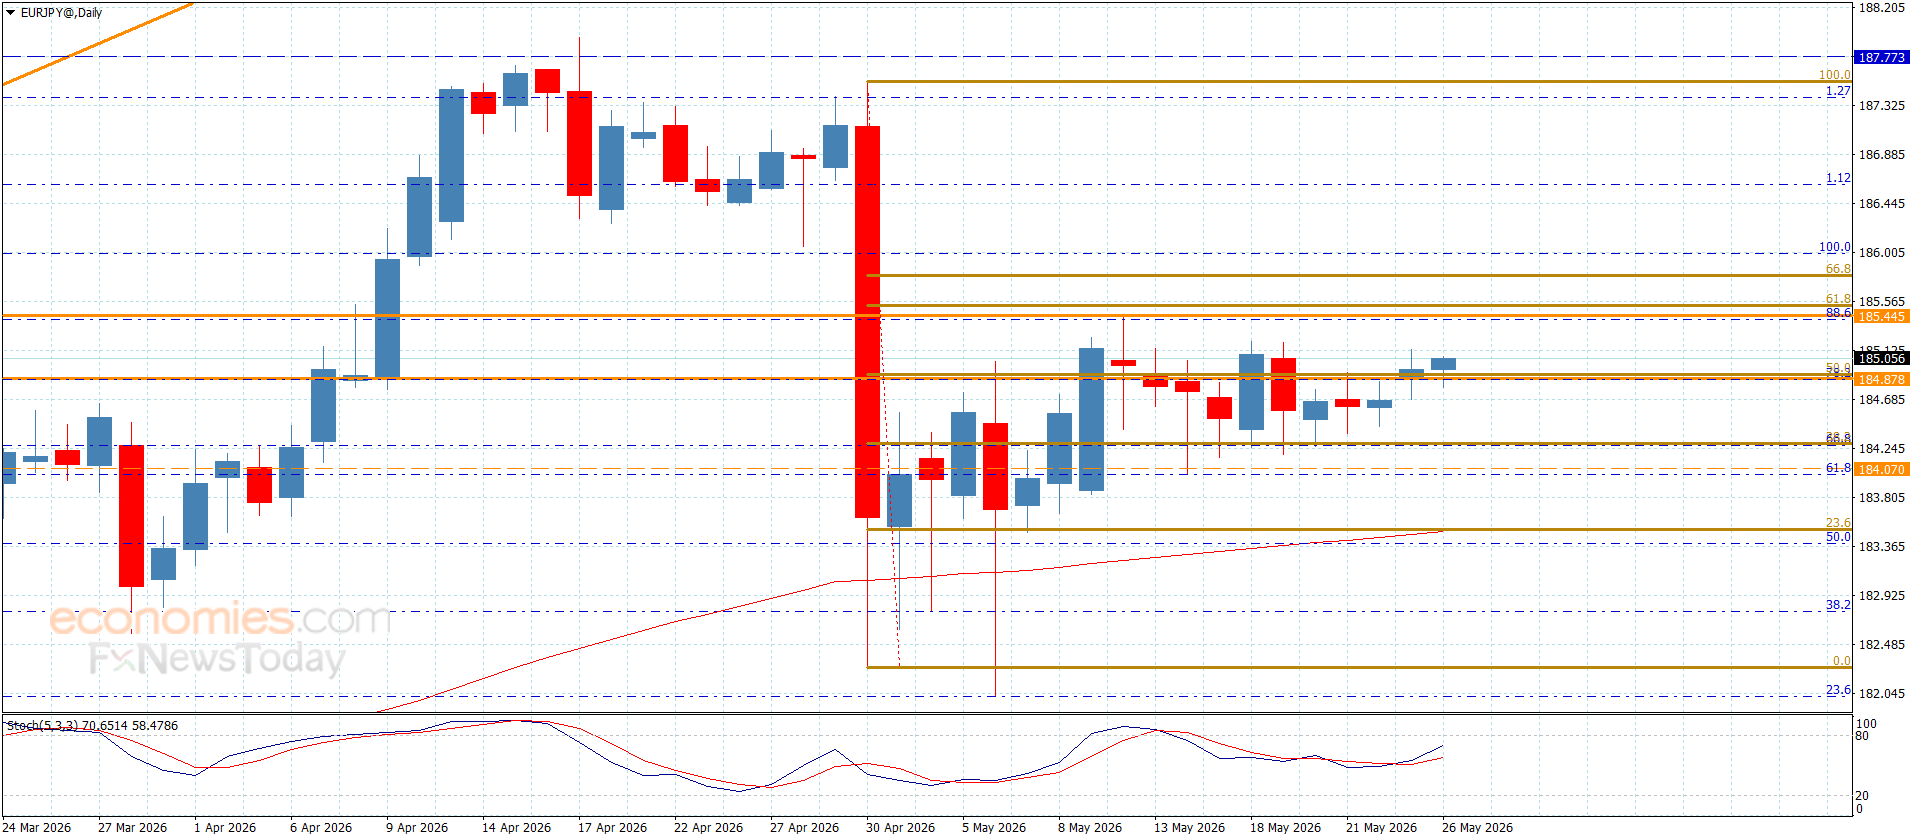
The EURJPY surrenders to the negative pressure– Forecast today – 24-4-2026

By |2026-04-25T07:37:07+03:00April 25, 2026|Forex News, News|0 Comments

Copper price remains affected by stochastic negativity, attempting to reach below $5.9700 to increase the chances of activating the temporary bearish corrective trend, to reach $5.8900 followed by $5.8200 level, which represents a new extra support against the current trading.


Forming a strong obstacle at $6.1200 level against the bullish attempts will increase the chances of forming negative attempts, to keep waiting to reach the previously suggested stations, to monitor its behavior to confirm the suggested trend in the upcoming trading.


The expected trading range for today is between $5.8200 and $6.0500


Trend forecast: Bearish


Source link

25 04, 2026

The EURGBP is under negative effect– Forecast today – 24-4-2026

By |2026-04-25T03:36:06+03:00April 25, 2026|Forex News, News|0 Comments

Despite the weakness of the EURGBP last trading and its stability neat 0.8675 level, its overall stability within the minor bearish channel levels which are represented by 0.8715 level as an extension of the main resistance, besides providing negative momentum will increase the chances of targeting new negative stations that might begin at 0.8630 and 0.8600.


Stochastic is fluctuating near 20 level to provide extra negative momentum to activate the bearish trend and reaching the previously suggested stations.


The expected trading range for today is between 0.8630 and 0.8690


Trend forecast: Bearish


Source link

24 04, 2026

GBP/USD: Elliott Wave Analysis and Forecast for 24.04.26–01.05.26

By |2026-04-24T23:35:06+03:00April 24, 2026|Forex News, News|0 Comments

The article covers the following subjects:

Major Takeaways

  • Main scenario: Consider long positions from corrections above the level of 1.3165 with a target of 1.3870–1.4300. A buy signal: the price holds above 1.3165. Stop Loss: below 1.3125, Take Profit: 1.3870–1.4300.
  • Alternative scenario: Breakout and consolidation below 1.3165 will allow the pair to continue declining to the levels of 1.2936–1.2736. A sell signal: the 1.3165 level is broken to the downside. Stop Loss: above 1.3205, Take Profit: 1.2936–1.2736.

Main Scenario

Consider long positions above the level of 1.3165 with a target of 1.3870–1.4300 once the correction ends.

Alternative Scenario

Breakout and consolidation below 1.3165 will allow the pair to continue declining to the levels of 1.2936–1.2736.

Analysis

On the weekly timeframe, an ascending wave of larger degree (A) of B is developing. Within it, wave 1 of (A) has formed, and a downward correction has been completed as wave 2 of (A). The third wave 3 of (A) appears to continue forming on the daily chart, with wave iii of 3 developing as its part. On the H4 timeframe, the third wave of smaller degree (iii) of iii has presumably started to form, within which wave i of (iii) has formed and a local correction ii of (iii) is developing. If the presumption is correct, GBP/USD will continue to rise to the levels of 1.3870–1.4300 after the correction ends. The level of 1.3165 is critical in this scenario as a breakout below it will enable the pair to continue declining to the levels of 1.2936–1.2736.


This forecast is based on the Elliott Wave Theory. When developing trading strategies, it is essential to consider fundamental factors, as the market situation can change at any time.

Price chart of GBPUSD in real time mode

The content of this article reflects the author’s opinion and does not necessarily reflect the official position of LiteFinance broker. The material published on this page is provided for informational purposes only and should not be considered as the provision of investment advice for the purposes of Directive 2014/65/EU.


According to copyright law, this article is considered intellectual property, which includes a prohibition on copying and distributing it without consent.

Rate this article:

{{value}} ( {{count}} {{title}} )


Source link

24 04, 2026

EUR/USD, GBP/USD and USD/JPY Forecasts – US Dollar Drops Despite Rising Rates

By |2026-04-24T19:34:01+03:00April 24, 2026|Forex News, News|0 Comments

The British pound finds itself recovering as we are at the 1.35 level again. This is a market that has been a bit more positive in general over the last year and a half or so than many others against the US dollar. So, not a surprise if we’re seeing the Euro bounce that we’re seeing the pound bounce.

I still see a lot of noise just above though, and I think that even if we were to see this market rally from here to the 1.36 level, I don’t think it’s going to be easy. I don’t necessarily want to short this market, at least not yet, but signs of exhaustion could have me interested.

USD/JPY Technical Analysis

Source link

24 04, 2026

EUR/USD: Elliott Wave Analysis and Forecast for 24.04.26–01.05.26

By |2026-04-24T15:33:12+03:00April 24, 2026|Forex News, News|0 Comments

The article covers the following subjects:

Major Takeaways

  • Main scenario: Consider long positions from corrections above 1.1445 with a target of 1.2088–1.2400. A buy signal: the price holds above 1.1445. Stop Loss: below 1.1405, Take Profit: 1.2088–1.2400.
  • Alternative scenario: Breakout and consolidation below 1.1445 will allow the pair to continue declining to the levels of 1.1185–1.1000. A sell signal: the 1.1445 level is broken to the downside. Stop Loss: above 1.1485, Take Profit: 1.1185–1.1000.

Main Scenario

Consider long positions above the level of 1.1445 with a target of 1.2088–1.2400 once the correction ends.

Alternative Scenario

Breakout and consolidation below 1.1445 will allow the pair to continue declining to the levels of 1.1185–1.1000.

Analysis

On the weekly timeframe, an ascending wave of larger degree B is developing, with wave (A) of B forming as its part. On the daily timeframe, the third wave 3 of (A) is apparently unfolding. Within it, wave i of 3 has formed, corrective wave ii of 3 has been completed, and wave iii of 3 has started developing. The first wave of smaller degree (i) of iii is forming on the H4 chart. As its parts, wave iii of (i) has been completed, and a local correction iv of (i) is nearing completion. If the presumption is correct, EUR/USD will continue to rise to the levels of 1.2088–1.2400 after the correction ends. The level of 1.1445 is critical in this scenario. A breakout below it will allow the pair to continue falling to the levels of 1.1185–1.1000.


This forecast is based on the Elliott Wave Theory. When developing trading strategies, it is essential to consider fundamental factors, as the market situation can change at any time.

Price chart of EURUSD in real time mode

The content of this article reflects the author’s opinion and does not necessarily reflect the official position of LiteFinance broker. The material published on this page is provided for informational purposes only and should not be considered as the provision of investment advice for the purposes of Directive 2014/65/EU.


According to copyright law, this article is considered intellectual property, which includes a prohibition on copying and distributing it without consent.

Rate this article:

{{value}} ( {{count}} {{title}} )


Source link

24 04, 2026

GBP/JPY Price Forecast: Pound rejected at 216.00, risks deepen below 215.00

By |2026-04-24T11:31:59+03:00April 24, 2026|Forex News, News|0 Comments

GBP/JPY advance stalled around 215.70 on Thursday, retreating to 215.00 as risk appetite deteriorated amid Middle East headlines, leaving traders uncertain about the conflict’s outcome. The cross trades at 215.06 at the time of writing.

GBP/JPY Price Forecast: Technical Outlook

The GBP/JPY pair is consolidating for the second straight day, suggesting that further gains are off the table, with the psychological 216.00 level not yet tested. Worth noting that every upside move towards the latter was rejected, with the 214.00 figure capping downward moves.

Momentum is bullish, as depicted by the Relative Strength Index (RSI), though moving gradually towards its 50 neutral level.

If GBP/JPY closes daily below 215.00, the potential to test the April 17 swing low of 214.00 increases. On further weakness, the next support would be the 20-day Simple Moving Average (SMA) at 213.35, followed by the 50-day SMA at 211.98.

On the other hand, if GBP/JPY registers a new yearly high above 215.91, the chance of clearing 216.00 increases.

GBP/JPY Price Chart – Daily

GBP/JPY daily chart

Japanese Yen Price This week

The table below shows the percentage change of Japanese Yen (JPY) against listed major currencies this week. Japanese Yen was the strongest against the Swiss Franc.

USD EUR GBP JPY CAD AUD NZD CHF
USD 0.50% 0.17% 0.59% 0.09% -0.05% 0.15% 0.64%
EUR -0.50% -0.32% 0.07% -0.39% -0.52% -0.39% 0.14%
GBP -0.17% 0.32% 0.41% -0.06% -0.19% -0.06% 0.47%
JPY -0.59% -0.07% -0.41% -0.51% -0.58% -0.45% 0.07%
CAD -0.09% 0.39% 0.06% 0.51% -0.03% 0.05% 0.53%
AUD 0.05% 0.52% 0.19% 0.58% 0.03% 0.20% 0.70%
NZD -0.15% 0.39% 0.06% 0.45% -0.05% -0.20% 0.50%
CHF -0.64% -0.14% -0.47% -0.07% -0.53% -0.70% -0.50%

The heat map shows percentage changes of major currencies against each other. The base currency is picked from the left column, while the quote currency is picked from the top row. For example, if you pick the Japanese Yen from the left column and move along the horizontal line to the US Dollar, the percentage change displayed in the box will represent JPY (base)/USD (quote).

Source link

24 04, 2026

EUR/JPY Price Forecast: Holds above 186.50 to test nine-day EMA barrier

By |2026-04-24T07:31:06+03:00April 24, 2026|Forex News, News|0 Comments

EUR/JPY inches higher after three days of gains, trading around 186.60 during Asian hours on Friday. The technical analysis of the daily chart indicates the currency cross is positioned slightly below the ascending channel, signaling potential for a bearish reversal.

However, the EUR/JPY cross holds a constructive bullish bias as it remains above the 50-day Exponential Moving Average (EMA) while facing immediate friction at the nine-day EMA.

Additionally, the 14-day Relative Strength Index sits around 58, comfortably above the midline yet below overbought territory, which suggests positive but not overstretched momentum that could favor further upside as long as the EUR/JPY cross holds over the underlying average.

The EUR/JPY cross is testing the immediate barrier at the nine-day EMA of 186.69. A rebound back to the ascending channel would reinforce the bullish bias and support the EUR/JPY cross to test the all-time high of 187.95, which was recorded on April 17. Further advances above this level would support the currency cross to explore the region around the upper boundary of the channel, around 189.40.

On the downside, further declines would put downward pressure on the EUR/JPY cross to navigate the region around the 50-day EMA at 184.86.

EUR/JPY: Daily Chart

(The technical analysis of this story was written with the help of an AI tool.)

Euro Price Today

The table below shows the percentage change of Euro (EUR) against listed major currencies today. Euro was the strongest against the New Zealand Dollar.

USD EUR GBP JPY CAD AUD NZD CHF
USD 0.09% 0.10% 0.05% 0.10% 0.17% 0.21% 0.12%
EUR -0.09% 0.00% 0.00% 0.00% 0.08% 0.12% 0.04%
GBP -0.10% -0.01% -2.13% 0.02% 0.08% 0.12% 0.02%
JPY -0.05% 0.00% 2.13% 0.03% 0.10% 0.14% 0.03%
CAD -0.10% 0.00% -0.02% -0.03% 0.06% 0.10% 0.02%
AUD -0.17% -0.08% -0.08% -0.10% -0.06% 0.04% -0.07%
NZD -0.21% -0.12% -0.12% -0.14% -0.10% -0.04% -0.09%
CHF -0.12% -0.04% -0.02% -0.03% -0.02% 0.07% 0.09%

The heat map shows percentage changes of major currencies against each other. The base currency is picked from the left column, while the quote currency is picked from the top row. For example, if you pick the Euro from the left column and move along the horizontal line to the US Dollar, the percentage change displayed in the box will represent EUR (base)/USD (quote).

Source link

24 04, 2026

GBP/USD Forecast Live: Retail Sales to Test Pound Sterling Strength

By |2026-04-24T03:30:27+03:00April 24, 2026|Forex News, News|0 Comments


– Written by

The Pound to US Dollar (GBP/USD) exchange rate traded without a clear direction on Thursday, as a combination of upbeat UK PMI data and a cautious market mood pulled the pair in opposite directions.

At the time of writing, GBP/USD hovered around $1.3505, having faced narrow volatility throughout the session.

The Pound (GBP) had a muted start to the trading session, drifting lower as markets considered the possible economic consequences of the Middle East crisis, including concerns that the UK government might introduce tax increases later this year.

As the day went on, however, Sterling found renewed support following the release of the UK’s preliminary April PMI data, which exceeded expectations in both the manufacturing and services sectors.

The services sector, in particular, drew focus, with activity rising from 50.5 to 52, outperforming forecasts that had pointed to a slowdown towards the 50 threshold.

The data also revealed stronger-than-expected growth in price pressures.

Reflecting on the results, Chris Williamson, Chief Business Economist at S&P Global Market Intelligence, said that price growth has surged at a pace rarely observed outside of the pandemic period, indicating that inflation may climb higher than many analysts had projected.

Save on Your GBP/USD Transfer

Get better rates and lower fees on your next international money transfer.
Compare TorFX with top UK banks in seconds and see how much you could save.


Compare the Best GBP/USD Rates »

This led markets to revise their expectations for monetary policy, with speculation that the Bank of England (BoE) could still pursue tightening this year helping to underpin the Pound.

The US Dollar (USD) found early support as a cautious market mood boosted demand for safe-haven assets, with investors unsettled by developments in the Middle East.

While the US moved to extend its ceasefire arrangement, Iran signalled it had not formally accepted the agreement, citing the continued US blockade of the Strait of Hormuz. At the same time, reported attacks on vessels in the region added to investor unease.

Ongoing uncertainty and heightened geopolitical tensions dampened market sentiment, helping to underpin the US Dollar.

Short-Term GBP/USD Forecast: UK Retail Sales in Focus

Looking ahead, attention turns to the UK’s March retail sales release on Friday. A slight rebound of around 0.2% growth may offer some support to Sterling, though any upside is likely to be modest.

For the US Dollar, focus will shift to the University of Michigan’s final consumer sentiment reading. If the data confirms a sharp drop in household confidence during April, it could place some pressure on USD.

Broader market sentiment is also expected to remain a key driver of GBP/USD. Continued developments in the Middle East may inject further volatility, with shifts in risk appetite potentially causing fluctuations in the currency pair.

Like this piece? Please share with your friends and colleagues:


International Money Transfer? Ask our resident FX expert a money transfer question or try John’s new, free, no-obligation personal service! ,where he helps every step of the way,
ensuring you get the best exchange rates on your currency requirements.

TAGS: Pound Dollar Forecasts

Source link

Go to Top