The main tag of Forex News Today Articles.
You can use the search box below to find what you need.
[wd_asp id=1]

14 06, 2026

GBP/JPY Price Forecast: Consolidates as intervention woes cap upside

By |2026-06-14T17:23:54+03:00June 14, 2026|Forex News, News|0 Comments

The Pound Sterling ended Thursday’s session almost flat at around 214.70 as market sentiment fluctuated but ultimately improved after US President Donald Trump cancelled attacks and hinted at a possible deal in place. The GBP/JPY traded with gains of almost 0.04%.

GBP/JPY Price Forecast: Technical outlook

Price action suggests the cross-pair is consolidating as traders refrain from pushing GBP/JPY higher amid fears of a possible Japanese authorities’ intervention in USD/JPY. If they decided that the Yen is weaker and intervene, this would generate ripples, as the Japanese currency would appreciate against most G8 currencies.

Hence, the GBP/JPY drifts higher, though steadily, but it remains unable to clear the most recent cycle high reached on June 5 at 215.61. Momentum, as measured by the Relative Strength Index (RSI), favours further upside, though it has shifted slightly, suggesting indecision.

If GBP/JPY surpasses the June 10 high at 215.24, the next stop would be the June 5 high at 215.61, followed by the year-to-date (YTD) high of 216.60.

On the flip side, if GBP/JPY drops below the confluence of the 20- and 50-day Simple Moving Averages (SMAs) at around the 214.23-214.10 area, this opens the door toward 214.00. Below this level sits the June 8 swing low of 212.93, ahead of the 100-day SMA at 212.67.

GBP/JPY Price Chart – Daily

GBP/JPY daily chart

Japanese Yen FAQs

The Japanese Yen (JPY) is one of the world’s most traded currencies. Its value is broadly determined by the performance of the Japanese economy, but more specifically by the Bank of Japan’s policy, the differential between Japanese and US bond yields, or risk sentiment among traders, among other factors.

One of the Bank of Japan’s mandates is currency control, so its moves are key for the Yen. The BoJ has directly intervened in currency markets sometimes, generally to lower the value of the Yen, although it refrains from doing it often due to political concerns of its main trading partners. The BoJ ultra-loose monetary policy between 2013 and 2024 caused the Yen to depreciate against its main currency peers due to an increasing policy divergence between the Bank of Japan and other main central banks. More recently, the gradually unwinding of this ultra-loose policy has given some support to the Yen.

Over the last decade, the BoJ’s stance of sticking to ultra-loose monetary policy has led to a widening policy divergence with other central banks, particularly with the US Federal Reserve. This supported a widening of the differential between the 10-year US and Japanese bonds, which favored the US Dollar against the Japanese Yen. The BoJ decision in 2024 to gradually abandon the ultra-loose policy, coupled with interest-rate cuts in other major central banks, is narrowing this differential.

The Japanese Yen is often seen as a safe-haven investment. This means that in times of market stress, investors are more likely to put their money in the Japanese currency due to its supposed reliability and stability. Turbulent times are likely to strengthen the Yen’s value against other currencies seen as more risky to invest in.

Source link

14 06, 2026

USD/JPY: Elliott Wave Analysis and Forecast for 12.06.26–19.06.26

By |2026-06-14T05:19:55+03:00June 14, 2026|Forex News, News|0 Comments

The article covers the following subjects:

Major Takeaways

  • Main scenario: Consider short positions from corrections below 160.62 with a target of 152.10–145.50. A sell signal: the price holds below 160.62. Stop Loss: above 161.20, Take Profit: 152.10–145.50.
  • Alternative scenario: Breakout and consolidation above the level of 160.62 will allow the pair to continue rising to the levels of 165.00–170.00. A buy signal: the level of 160.62 is broken to the upside. Stop Loss: below 160.00, Take Profit: 165.00–170.00.

Main Scenario

Consider short positions from corrections below the level of 160.62 with a target of 152.10–145.50.

Alternative Scenario

Breakout and consolidation above 160.62 will allow the pair to continue rising to the levels of 165.00–170.00.

Analysis

An ascending third wave of larger degree 3 has formed on the weekly chart, and a bearish correction is developing as the fourth wave 4. On the daily time frame, wave (B) of 4 has presumably been completed, and a descending wave (C) of 4 has started to form. The first wave of smaller degree 1 of (C) is unfolding on the H4 chart. Within this structure, wave i of 1 has been completed, and a local corrective wave ii of 1 has likely formed. Wave iii of 1 is in progress now. If the presumption is correct, USD/JPY will continue to decline to 152.10–145.50 within wave iii of 1. The level of 160.62 is critical in this scenario as a breakout above it will enable the pair to continue rising to the levels of 165.00–170.00.


This forecast is based on the Elliott Wave Theory. When developing trading strategies, it is essential to consider fundamental factors, as the market situation can change at any time.

Price chart of USDJPY in real time mode

The content of this article reflects the author’s opinion and does not necessarily reflect the official position of LiteFinance broker. The material published on this page is provided for informational purposes only and should not be considered as the provision of investment advice for the purposes of Directive 2014/65/EU.


According to copyright law, this article is considered intellectual property, which includes a prohibition on copying and distributing it without consent.

Rate this article:

{{value}} ( {{count}} {{title}} )


Source link

14 06, 2026

EUR/USD Forecast: Kevin Warsh debut as Fed Chair and war drums to keep volatility high

By |2026-06-14T01:19:02+03:00June 14, 2026|Forex News, News|0 Comments

The EUR/USD pair managed to close the week in positive territory, but not before trading as low as 1.1499, its lowest since late March and still far below the previous weekly open. The US Dollar (USD) appreciated throughout the first half of the week on the back of renewed tensions between the United States (US) and Iran, changing course on Thursday on headlines indicating an upcoming end to the Middle East conflict.

War drums sounding low and low

The second week of June started with the US and Iran exchanging fire, despite the agreed ceasefire, which escalated after the latter downed an American helicopter, triggering Washington’s response with more strikes and US President Donald Trump’s threats to “hit hard” Iran.

Things changed on Thursday, when Trump announced that an agreement was almost done and that a deal would be signed imminently, subject to Iran’s signature. He also claimed the Strait of Hormuz would reopen shortly after the signing. Crude Oil prices edged sharply lower with the headlines, and the USD fell accordingly as optimism reigned. On Friday, however, hopes began to fade amid reports that Iran’s terms and the US terms are far from near. The USD recovered modestly on Friday as optimism faded, but it has not been lost.

US Dollar before the Federal Reserve

The Greenback surged on safety demand, also boosted by hot US inflation readings, reinforcing speculation that the Federal Reserve (Fed) will have to hike interest rates before the year is over. The US Consumer Price Index (CPI) rose to its highest level in three years at 4.2% in May, following the 3.8% posted in April. Core annual CPI was up 2.9%, after printing 2.8% in the previous month.

The Fed will announce its monetary policy decision on Wednesday. Market participants anticipate the benchmark interest rate will remain unchanged at the current range set at 3.50% to 3.75%. But there are two big ifs: One, it will be the first one chaired by Kevin Warsh, and two, the central bank will release a fresh Summary of Economic Projections (SEP).

The Federal Open Market Committee (FOMC) is between a rock and a hard place. Hiking interest rates is a tool designed to counter consumer-driven inflation, not inflation coming from a supply shock like the one resulting from the Iran war. Even further, the central bank is being pressured to cut rates while data points in the opposite direction.

Finally, it’s worth noting that Chair Warsh is a believer in hard data but skeptical about forward guidance. It’s hard to believe he will announce relevant changes to the ongoing FOMC ways, but everything is possible. His words will be scrutinized to the coma in search of hints on what the Fed may do in the foreseeable future.

Euro after the European Central Bank

In the Old Continent, the European Central Bank (ECB) had a monetary policy meeting, and as expected, ECB officials hiked interest rates by 25 basis points (bps), the first hike in three years. With this decision, the interest rate on the main refinancing operations, the interest rates on the marginal lending facility and the deposit facility stood at 2.4%, 2.65% and 2.25%, respectively.

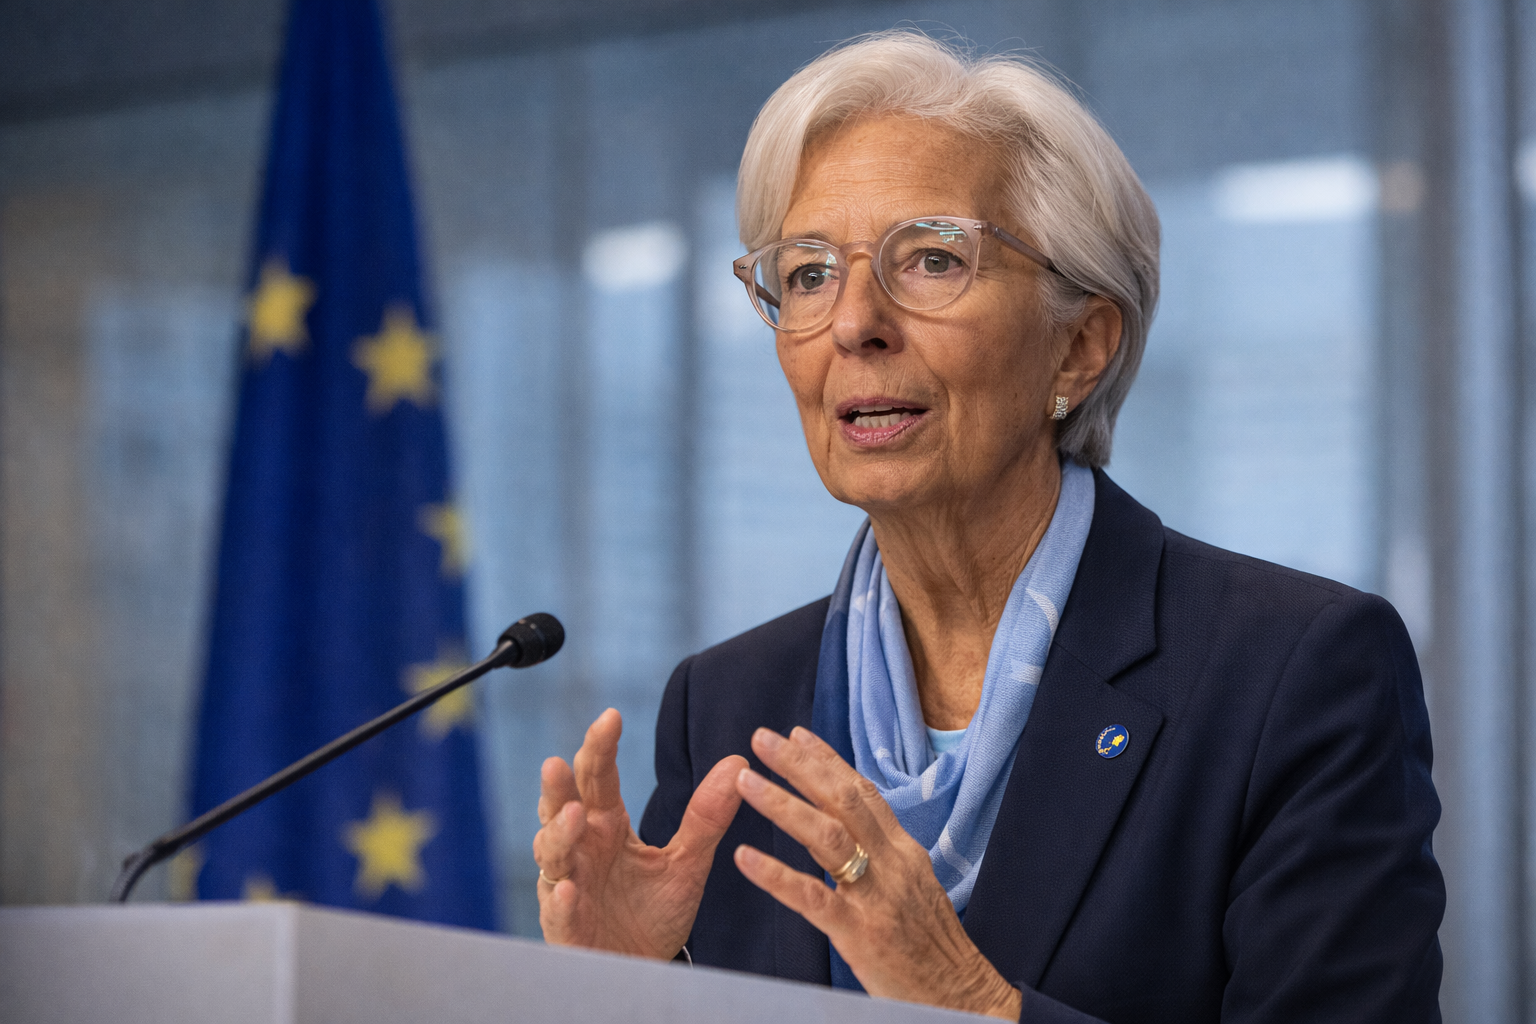
ECB President Christine Lagarde offered a press conference, in which she hinted at additional hikes amid broadening inflationary pressures, while adding that growth risks are now skewed to the downside. Lagarde failed to surprise investors with the hike decision, mostly seen as symbolic, having no real impact on the Euro (EUR). Fears of stagflation remain at the top of policymakers’ concerns, although Lagarde tempered preoccupations.

Busy calendar ahead

Other data released these days showed that the German Harmonized Index of Consumer Prices (HCIP) rose 2.7% YoY in May, as previously estimated. Across the pond, the US University of Michigan (UoM) reported that the Consumer Sentiment Index rose to 48.9 in June, up from 44.8 in May, according to the preliminary estimate..

In the upcoming sessions, the Fed’s monetary policy decision stands out, yet the macroeconomic calendar will include other relevant figures. Germany will publish the June ZEW Survey on Economic Sentiment and the May Producer Price Index (PPI), while the Eurozone will publish the final estimate of the May HICP. As for the US, the focus will be on May Retail Sales and employment-related data.

Following central banks’ announcements, comments from ECB and Fed officials will be back in fashion.

EUR/USD Technical Outlook:

Chart Analysis EUR/USD

In the daily chart, EUR/USD trades with a bearish near-term bias as spot remains below the 20-, 100-, and 200-day Simple Moving Averages (SMAs), which cap recovery attempts. Momentum studies reinforce the downside tone, with the 14-period Relative Strength Index (RSI) indicator hovering in the low-40s and the 14-period Momentum indicator in negative territory, both lacking clear directional strength. The lower low, however, hints at mounting selling pressure.

On a weekly basis, EUR/USD is neutral to bearish. The pair holds comfortably above the 100- and 200-week simple moving averages (SMAs) at 1.1279 and 1.0979, but it is capped by the 20-week SMA at 1.1674. The weekly RSI indicator ticks lower at 46.7, while the Momentum indicator seesaws just below its midline, both lacking clear directional strength.

On the topside, initial resistance is located at the 20-week SMA around 1.1674; a sustained break above this barrier would be needed to revive bullish traction toward higher weekly highs, yet as long as the pair remains below 1.1700, the odds for a firmer advance remain limited. On the downside, first support emerges at the 1.1500 threshold, closely followed by the long-term static support area around 1.1470. Once below the latter, sellers are likely to add pressure and push the pair towards 1.1400.

(The technical analysis of this story was written with the help of an AI tool.)

Source link

13 06, 2026

USD/JPY Forecast Today 12/06: Resistance High (Video&Chart)

By |2026-06-13T21:17:54+03:00June 13, 2026|Forex News, News|0 Comments

  • The Forex markets will be paying close attention to this pair, as we are looking for a potential break of a major swing high dating back to 1990.

  • The US dollar has been noisy against the Japanese yen during the trading session on Thursday, as we continue to see the dollar reaching an area where the Bank of Japan has intervened.

After all, just about a month ago, we had seen a lot of selling pressure as the Bank of Japan defended the yen, but at this point in time, the interest rate differential remains very high, and because of this, you have to be very concerned about the overall area.

If we can break above the 161-yen level, we will be clear of that, and then I think at that point in time, the only thing that really drives this pair back down would be some type of massive change with the Federal Reserve or the Bank of Japan again. That being said, any intervention by the Bank of Japan will be a short-term move and, quite frankly, offers a buying opportunity in the USD/JPY currency pair. We’ve just seen that, and that’s typically how that works.

Deteriorating Inflation and Long-Term Outlook

With the Japanese seeing deteriorating inflation recently and the inflation numbers in the United States remaining fairly reasonably strong, that means that we probably continue to go to the upside. Furthermore, a lot of people are looking for US dollars at the moment, so when we break the 161 yen level, then we have cleared the 1990 swing high completely, and at that point, we could see the market looking to get to the 224 yen level over the next several years, at least that’s what the technical analysis says.

The swap that you get paid at the end of every day will help build your account as well, and this is one of those situations where, if we do take off from here, this could be an investment, not just a trade. Short-term pullbacks continue to be buying opportunities with the 50-day EMA offering a floor.

Want to trade our USD/JPY forex analysis and predictions? Here’s a list of forex brokers in Japan to check out.

Christopher Lewis is a technical analyst and market commentator at DailyForex with more than two decades of trading experience in Forex and other leveraged markets. Based in Columbus, Ohio, he specializes in chart-based analysis of major currency pairs, stock indices, commodities, and energy markets, focusing on clear support and resistance levels, trend structure, and risk management. Christopher produces daily written and video analysis for traders who rely on technical setups to navigate volatile market conditions

As seen on: Pairs Of Aces Podcast,The Trader Guy, FXEmpire

Source link

13 06, 2026

EUR/GBP forecast: rare chart pattern points to a crash after ECB decision

By |2026-06-13T17:17:23+03:00June 13, 2026|Forex News, News|0 Comments

The EUR/GBP exchange rate has moved sideways in the past few days as traders focus on the upcoming European Central Bank (ECB) and Bank of England (BoE) interest rate decisions. It was trading at 0.8627, down from last year’s high of 0.8865. It has formed two major chart patterns, pointing to more downside.

The daily chart shows that the EUR to GBP exchange rate has pulled back in the past few months. It has retreated from a high of 0.8865 in November last year to 0.8628. 

A closer look shows that the pair has found substantial support at 0.8615, its lowest level on February 5,  March 19, and May 25. This support is part of the descending triangle pattern, whose upper side connects the highest swings in November last year and February and May this year. The descending triangle is a common continuation sign in technical analysis

The pair has also formed a small head-and-shoulders pattern, a common bearish sign. Also, it also remained below the 50-day and 200-day Weighted Moving Averages (WMA).

Therefore, the pair will likely have a strong bearish breakout in the near term, potentially to the key support at 0.8545, the 50% Fibonacci Retracement level. 

EUR/USD chart | Source: TradingView

The EUR/GBP pair has come under pressure in the past few days as investors waited for the upcoming ECB interest rate decision. Economists polled by Reuters expect Christine Lagarde and her team to deliver the first interest rate hike of the year. 

If this happens, the bank will hike rates by 0.25% to 2.40% and the deposit facility rate to 2.25%. It will be the first time that the bank has hiked interest rates since September 2023. Also, it will be a big reversal after the bank delivered several interest rate cuts last year.

The bank’s rate hike will come as it combats the elevated inflation, which has continued rising in the past few months. Data shows that the headline CPI rose to 3.2% in May from 3.0% in the previous month. It has jumped sharply from the year-to-date low of 1.7%. Anal

The next key catalyst for the EUR/USD pair will be the upcoming Bank of England interest rate decision scheduled for Thursday. Economists expect the bank to leave interest rates unchanged in its meeting next week.

The most recent data showed that the headline Consumer Price Index retreated to 2.8% in April, helped by the ongoing government actions. Still, Polymarket traders are predicting that the bank will hike interest rates in the coming months as inflation ticks up again. 

Source link

13 06, 2026

Pound To Dollar Price News, Forecast: GBP Shrugs Off UK Growth Slowdown

By |2026-06-13T13:16:30+03:00June 13, 2026|Forex News, News|0 Comments

The Pound to Dollar (GBP/USD) exchange rate traded in a narrow range on Friday after data confirmed the UK economy contracted by 0.1% in April, while ongoing tensions in the Middle East continued to underpin demand for the safe-haven US Dollar.

At the time of writing, GBP/USD was trading at $1.3408, with investors balancing weaker UK growth data against broader geopolitical risks.

Latest — Exchange Rates:
Pound to Dollar (GBP/USD): 1.34081 (-0.05%)
Euro to Dollar (EUR/USD): 1.15672 (-0.08%)
Dollar to Yen (USD/JPY): 160.2845 (+0.09%)

DAILY RECAP:

The US Dollar (USD) held a firm tone throughout Thursday’s session as investors continued to favour defensive assets amid ongoing geopolitical uncertainty.

Market sentiment remained fragile after the United States launched strikes against Iranian targets for a second consecutive day, raising concerns that recent diplomatic efforts could lose momentum.

Although reports suggested negotiations between Washington and Tehran remain active behind the scenes, investors remained cautious about the prospect of a lasting breakthrough.

This cautious backdrop helped support demand for the safe-haven US Dollar, although hopes that diplomacy could eventually prevail prevented the currency from posting stronger gains.

Meanwhile, the Pound (GBP) struggled to attract meaningful support as investors remained wary of risk-sensitive assets.

foreign exchange rates

Sterling was cushioned by a modest retreat in UK government bond yields, which helped ease some concerns surrounding domestic financing conditions.

The relative stability in energy prices also helped calm gilt markets following recent volatility, preventing heavier losses for the Pound despite the risk-off trading environment.

With little in the way of major UK economic releases, broader market sentiment remained the primary driver of Sterling price action.

Near-Term GBP/USD Forecast: UK GDP Data

The latest UK GDP figures confirmed that the economy contracted by 0.1% in April, matching market expectations but reinforcing concerns that growth momentum has weakened since the start of the year.

The data highlighted the challenge facing the Bank of England as policymakers weigh signs of slowing economic activity against persistent inflation pressures and rising energy costs.

While the GDP release is unlikely to significantly alter expectations for next week’s policy decision, any further evidence of economic weakness could limit Sterling’s upside potential in the weeks ahead.

For the US Dollar, the University of Michigan’s latest consumer sentiment survey will also attract attention.

Forecasts suggest confidence improved in June, which may support the ‘Greenback’ if confirmed and reinforce expectations that the US economy remains resilient.

Beyond economic data, developments in the Middle East are likely to remain a key market driver. Any escalation in tensions could continue to boost safe-haven demand for the US Dollar, while renewed diplomatic progress may encourage a modest recovery in risk appetite.

Source link

13 06, 2026

EUR/USD Forecast: Kevin Warsh debut as Fed Chair and war drums to keep volatility high

By |2026-06-13T09:15:33+03:00June 13, 2026|Forex News, News|0 Comments

The EUR/USD pair managed to close the week in positive territory, but not before trading as low as 1.1499, its lowest since late March and still far below the previous weekly open. The US Dollar (USD) appreciated throughout the first half of the week on the back of renewed tensions between the United States (US) and Iran, changing course on Thursday on headlines indicating an upcoming end to the Middle East conflict.

War drums sounding low and low

The second week of June started with the US and Iran exchanging fire, despite the agreed ceasefire, which escalated after the latter downed an American helicopter, triggering Washington’s response with more strikes and US President Donald Trump’s threats to “hit hard” Iran.

Things changed on Thursday, when Trump announced that an agreement was almost done and that a deal would be signed imminently, subject to Iran’s signature. He also claimed the Strait of Hormuz would reopen shortly after the signing. Crude Oil prices edged sharply lower with the headlines, and the USD fell accordingly as optimism reigned. On Friday, however, hopes began to fade amid reports that Iran’s terms and the US terms are far from near. The USD recovered modestly on Friday as optimism faded, but it has not been lost.

US Dollar before the Federal Reserve

The Greenback surged on safety demand, also boosted by hot US inflation readings, reinforcing speculation that the Federal Reserve (Fed) will have to hike interest rates before the year is over. The US Consumer Price Index (CPI) rose to its highest level in three years at 4.2% in May, following the 3.8% posted in April. Core annual CPI was up 2.9%, after printing 2.8% in the previous month.

The Fed will announce its monetary policy decision on Wednesday. Market participants anticipate the benchmark interest rate will remain unchanged at the current range set at 3.50% to 3.75%. But there are two big ifs: One, it will be the first one chaired by Kevin Warsh, and two, the central bank will release a fresh Summary of Economic Projections (SEP).

The Federal Open Market Committee (FOMC) is between a rock and a hard place. Hiking interest rates is a tool designed to counter consumer-driven inflation, not inflation coming from a supply shock like the one resulting from the Iran war. Even further, the central bank is being pressured to cut rates while data points in the opposite direction.

Finally, it’s worth noting that Chair Warsh is a believer in hard data but skeptical about forward guidance. It’s hard to believe he will announce relevant changes to the ongoing FOMC ways, but everything is possible. His words will be scrutinized to the coma in search of hints on what the Fed may do in the foreseeable future.

Euro after the European Central Bank

In the Old Continent, the European Central Bank (ECB) had a monetary policy meeting, and as expected, ECB officials hiked interest rates by 25 basis points (bps), the first hike in three years. With this decision, the interest rate on the main refinancing operations, the interest rates on the marginal lending facility and the deposit facility stood at 2.4%, 2.65% and 2.25%, respectively.

ECB President Christine Lagarde offered a press conference, in which she hinted at additional hikes amid broadening inflationary pressures, while adding that growth risks are now skewed to the downside. Lagarde failed to surprise investors with the hike decision, mostly seen as symbolic, having no real impact on the Euro (EUR). Fears of stagflation remain at the top of policymakers’ concerns, although Lagarde tempered preoccupations.

Busy calendar ahead

Other data released these days showed that the German Harmonized Index of Consumer Prices (HCIP) rose 2.7% YoY in May, as previously estimated. Across the pond, the US University of Michigan (UoM) reported that the Consumer Sentiment Index rose to 48.9 in June, up from 44.8 in May, according to the preliminary estimate..

In the upcoming sessions, the Fed’s monetary policy decision stands out, yet the macroeconomic calendar will include other relevant figures. Germany will publish the June ZEW Survey on Economic Sentiment and the May Producer Price Index (PPI), while the Eurozone will publish the final estimate of the May HICP. As for the US, the focus will be on May Retail Sales and employment-related data.

Following central banks’ announcements, comments from ECB and Fed officials will be back in fashion.

EUR/USD Technical Outlook:

Chart Analysis EUR/USD

In the daily chart, EUR/USD trades with a bearish near-term bias as spot remains below the 20-, 100-, and 200-day Simple Moving Averages (SMAs), which cap recovery attempts. Momentum studies reinforce the downside tone, with the 14-period Relative Strength Index (RSI) indicator hovering in the low-40s and the 14-period Momentum indicator in negative territory, both lacking clear directional strength. The lower low, however, hints at mounting selling pressure.

On a weekly basis, EUR/USD is neutral to bearish. The pair holds comfortably above the 100- and 200-week simple moving averages (SMAs) at 1.1279 and 1.0979, but it is capped by the 20-week SMA at 1.1674. The weekly RSI indicator ticks lower at 46.7, while the Momentum indicator seesaws just below its midline, both lacking clear directional strength.

On the topside, initial resistance is located at the 20-week SMA around 1.1674; a sustained break above this barrier would be needed to revive bullish traction toward higher weekly highs, yet as long as the pair remains below 1.1700, the odds for a firmer advance remain limited. On the downside, first support emerges at the 1.1500 threshold, closely followed by the long-term static support area around 1.1470. Once below the latter, sellers are likely to add pressure and push the pair towards 1.1400.

(The technical analysis of this story was written with the help of an AI tool.)

Source link

13 06, 2026

GBP/JPY Price Forecast: Consolidation Continues as Intervention Concerns Cap Upside

By |2026-06-13T05:14:05+03:00June 13, 2026|Forex News, News|0 Comments

BitcoinWorld

GBP/JPY Price Forecast: Consolidation Continues as Intervention Concerns Cap Upside

The British pound versus the Japanese yen (GBP/JPY) pair is currently trading in a narrow range, consolidating recent gains as market participants remain cautious over potential intervention by Japanese authorities. The cross rate has been unable to break decisively above the 190.00 psychological barrier, with intervention fears acting as a persistent cap on upside momentum.

Market Context and Key Drivers

GBP/JPY has been range-bound between approximately 188.50 and 190.50 over the past week, reflecting a tug-of-war between divergent monetary policy expectations and intervention risk. The Bank of Japan’s (BoJ) ultra-loose stance continues to weigh on the yen, while the Bank of England (BoE) maintains a relatively hawkish posture, supporting the pound.

However, recent verbal warnings from Japanese finance officials have introduced a new layer of uncertainty. Finance Minister Shunichi Suzuki reiterated that authorities are watching currency moves closely and will take appropriate action against excessive volatility. This has deterred aggressive yen selling, keeping GBP/JPY in a holding pattern.

Technical Analysis: Key Levels to Watch

From a technical perspective, GBP/JPY is trading near the middle of its recent range, with support at 188.50 (the 50-day moving average) and resistance at 190.50 (the recent swing high). A break above 190.50 could open the door to a test of the 192.00 area, while a move below 188.50 may trigger a deeper correction toward 187.00.

The Relative Strength Index (RSI) is hovering around 55, indicating neutral momentum without clear directional bias. The pair remains above its 100- and 200-day moving averages, suggesting the broader trend is still bullish, but the consolidation phase may persist in the near term.

Why Intervention Matters for Traders

Japanese intervention in the forex market is a significant event risk. Historically, when the yen weakens rapidly, the Ministry of Finance may step in to buy yen and sell dollars or other currencies. Such actions can cause sharp, short-term reversals, often catching leveraged traders offside.

For GBP/JPY traders, the key is to monitor verbal intervention cues and actual intervention triggers. The 190.00-192.00 zone is widely seen as a potential intervention threshold, especially if the move is deemed disorderly. This creates a risk premium that may limit upside potential even if fundamental drivers remain yen-negative.

Conclusion

GBP/JPY is likely to remain in a consolidation phase in the coming sessions, with intervention fears capping upside while the underlying yen weakness provides support. Traders should watch for any escalation in verbal warnings or actual intervention, which could trigger a sharp but potentially short-lived reversal. A break above 190.50 or below 188.50 will likely determine the next directional move.

FAQs

Q1: What is causing GBP/JPY to consolidate?
GBP/JPY is consolidating due to a balance between bullish fundamentals (BoE hawkishness, BoJ dovishness) and bearish intervention risk (Japanese authorities warning against excessive yen weakness). This uncertainty keeps the pair range-bound.

Q2: How likely is Japanese intervention in GBP/JPY?
Intervention is possible if the yen weakens rapidly or in a disorderly manner. The 190.00-192.00 zone is seen as a key threshold. However, intervention is not guaranteed and depends on the pace and nature of the move.

Q3: What are the key technical levels for GBP/JPY?
Support is at 188.50 (50-day MA) and 187.00. Resistance is at 190.50 (recent high) and 192.00. A break above 190.50 could signal further upside, while a break below 188.50 may lead to a deeper correction.

This post GBP/JPY Price Forecast: Consolidation Continues as Intervention Concerns Cap Upside first appeared on BitcoinWorld.

Source link

13 06, 2026

GBP/USD: Elliott Wave Analysis and Forecast for 12.06.26–19.06.26

By |2026-06-13T01:12:33+03:00June 13, 2026|Forex News, News|0 Comments

The article covers the following subjects:

Major Takeaways

  • Main scenario: Consider short positions from corrections below the level of 1.3650 with a target of 1.3140–1.2936. A sell signal: the price holds below 1.3650. Stop Loss: above 1.3690, Take Profit: 1.3140–1.2936.
  • Alternative scenario: Breakout and consolidation above the level of 1.3650 will allow the pair to continue rising to the levels of 1.3870–1.4300. A buy signal: the level of 1.3650 is broken to the upside. Stop Loss: below 1.3610, Take Profit: 1.3870–1.4300.

Main Scenario

Consider short positions from corrections below 1.3650 with a target of 1.3140–1.2936.

Alternative Scenario

Breakout and consolidation above 1.3650 will allow the pair to continue rising to the levels of 1.3870–1.4300.

Analysis

On the weekly time frame, an ascending wave of larger degree (A) of B is developing. Within it, wave 1 of (A) has formed, and a downward correction has been completed as wave 2 of (A). The third wave 3 of (A) appears to be unfolding on the daily chart. Within it, wave i of 3 has formed, and bearish correction ii of 3 is developing. Wave (c) of ii is developing on the H4 chart, with wave iii of (c) unfolding as its part. If the presumption is correct, GBP/USD will continue to decline to the levels of 1.3140–1.2936. The level of 1.3650 is critical in this scenario as a breakout above it will enable the pair to continue rising to the levels of 1.3870–1.4300.


This forecast is based on the Elliott Wave Theory. When developing trading strategies, it is essential to consider fundamental factors, as the market situation can change at any time.

Price chart of GBPUSD in real time mode

The content of this article reflects the author’s opinion and does not necessarily reflect the official position of LiteFinance broker. The material published on this page is provided for informational purposes only and should not be considered as the provision of investment advice for the purposes of Directive 2014/65/EU.


According to copyright law, this article is considered intellectual property, which includes a prohibition on copying and distributing it without consent.

Rate this article:

{{value}} ( {{count}} {{title}} )


Source link

12 06, 2026

EUR/USD, GBP/USD and USD/JPY Forecasts – US Dollar Settling into the Weekend

By |2026-06-12T21:10:59+03:00June 12, 2026|Forex News, News|0 Comments

The U.S. dollar has rallied just a bit against the Japanese yen, but really, at this point in time I think we’re going to be very cautious heading into the weekend. There is going to be a lot of fear that maybe the Japanese will intervene. I think, given enough time, though, we probably do break out to a fresh new high, which would be the demolishing of a 1990 swing high, so that really could get this thing moving.

In fact, the measured move of the rounded bottom is for $224, so we’re talking multi-year. Whether or not that happens remains to be seen, but I still assume it will eventually. If we break down from here, I’ll be looking at the 50-day EMA as a potential area of support as well. I have no interest in shorting the dollar against the yen, and I do plan on continuing to keep holding onto the position in a long trade so that I can click swap at the end of every day.

Source link

Go to Top