Bank of England will cut rates faster than expected, warns UniCredit.
The market is underestimating how far and fast the Bank of England will cut interest rates, which will weigh materially on the pound to euro exchange rate, says a leading global investment bank.
“We see more and faster rate cuts than markets,” says Daniel Vernazza, Chief International Economist at UniCredit in London.
The market is currently anticipating two more reductions in Bank Rate during this cycle, taking it to 3.5%.
This expectation was reinforced by Thursday’s decision to leave interest rates unchanged at 4.0% but signal in clear terms that another cut was imminent. Most economists think the tone adopted by the Bank points to a cut at December’s meeting.
However, UniCredit expects the labour market to continue to weaken and consumption growth to remain soft, reinforced by the likely material tightening of fiscal policy in the upcoming Autumn Budget.
The government looks all but set to raise the basic rate of income tax for the first time since the 1970s, which economists say will squeeze the economy and pressure inflation.
“Inflation should move down to 2% next year. In this environment, we expect the MPC to cut rates in December, followed by a quarterly pace of rate cuts next year to 2.75%,” says Vernazza.
The Bank of England’s November Monetary Policy Report revealed forecasts showing it expects inflation to fall back to the 2.0% target much later, in late 2027.
The Bank’s latest forecasts also show it is modelling the economic outlook on the market’s assumption that Bank Rate will fall to a terminal rate at 3.5% next year.
Foreign exchange markets are responsive to interest rate expectations, meaning the pound would decline in the event that the market adjusts to UniCredit’s thinking on inflation and the more aggressive path of cuts that the Bank of England would respond with.
If the Milan-based lender is correct, a significant repricing in market interest rate expectations awaits, which will drag materially on the pound.
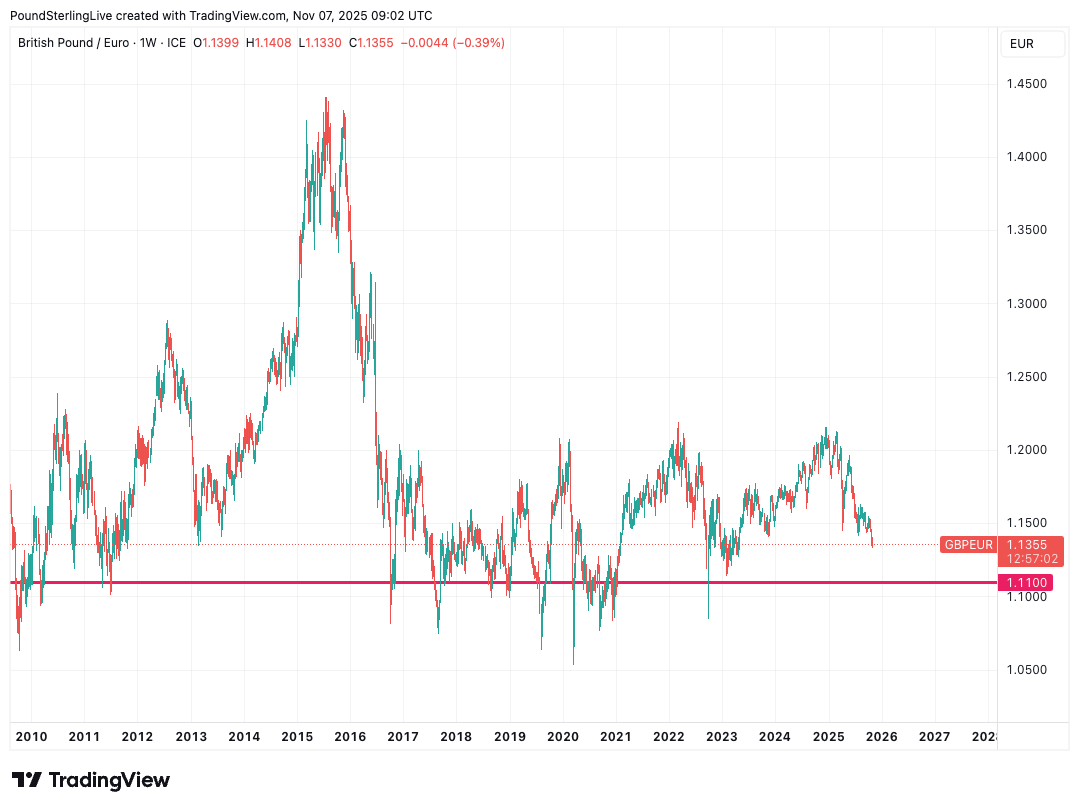
Given this, UniCredit holds a pound to euro forecast of 1.11, which is well below the consensus of predictions made by its peer investment banks.
Above: 1.11 is the bottom of a long-term range for GBP/EUR.
The Pound Sterling (GBP) extended its downtrend and reached seven-month lows near 1.3000 against the US Dollar (USD), before GBP/USD buyers quickly jumped in and recovered some ground.
Pound Sterling rebounded; not out of the woods yet
Safe-haven flows returned with a bang and acted as a strong headwind to the risk-sensitive Pound Sterling while boosting the US Dollar to its highest in five months against its six major currency rivals.
“Sell everything” theme gripped the market as traders witnessed a wave of exhaustion following the Artificial Intelligence (AI) driven record rally in global stocks. US tech stocks tumbled, drowning the major indices, with investors selling Gold to cover their losses in equity markets.
Investors grew concerned over inflated technology stock valuations, particularly in the artificial intelligence (AI) space, fuelling the long-due correction in global indices.
That being said, the USD also found fresh support from reduced expectations that the US Federal Reserve (Fed) will deliver another interest rate cut in December. The December Fed rate cut bets were slashed after strong US private sector employment and services activity data.
Data published by the ADP showed that US private payrolls increased by 42,000 jobs in October, exceeding expectations of a 25,000 gain, while the ISM Services PMI increased more than expected to 52.4 last month due to a solid jump in New Orders.
This broad USD strength smashed the GBP/USD pair to challenge the 1.3000 psychological level before it staged a decent comeback in the latter part of the week.
Cable’s turnaround was mainly driven by a sharp pullback in the USD across the board and US Treasury bond yields, following Thursday’s private labor data and resurfacing concerns over a protracted government shutdown.
The executive outplacement firm Challenger, Gray & Christmas said on Thursday that corporations announced a 183.1% monthly surge in layoffs, the worst October in over two decades, per Reuters.
The latest jobs data refuelled concerns about the weakening US labor market conditions, slightly boosting the odds of the Fed rate cut next month to 69% versus a drop to 62% seen after the release of the US ADP Employment Change data.
The recovery in GBP/USD was unfazed by the Bank of England’s (BoE) dovish hold decision. The members of the BoE Monetary Policy Committee (MPC) voted 5-4 to maintain the key Bank Rate at 4%, in a narrower than expected split.
The BOE underscored that future rate cuts will depend on the evolution of the outlook for inflation. “If progress on disinflation continues, Bank Rate is likely to continue on a gradual downward path,” the Monetary Policy Statement (MPS) said.
Heading into the weekend, the USD came under renewed selling pressure and helped GBP/USD stretch higher. The monthly report published by the University of Michigan (UoM) showed that the Consumer Sentiment Index dropped to 50.3 in November from 53.6 in October.
Week ahead: High-impact UK data to hog the limelight
Amid a holiday-shortened week, the data drought from the United States (US) will likely continue as no end in sight to the government shutdown.
The longest shutdown in American history will put the focus back on some private-sector statistics and speeches from Fed officials. In case the government funding is restored, the delayed US Nonfarm Payrolls and Jobless Claims will be eagerly awaited.
The US Consumer Price Index (CPI), Producer Price Index (PPI) and Retail Sales reports for October will also be in focus.
From the United Kingdom’s (UK) economic calendar, the employment data on Tuesday will offer some incentives to Pound Sterling traders.
On Wednesday, BoE Chief Economist Huw Pill is due to speak in a panel discussion titled “An assessment of the BoE’s reaction to Covid-19” at the Institute of International Monetary Research Conference hosted by the University of Buckingham.
Thursday will feature the monthly and preliminary reading of the British third-quarter Gross Domestic Product (GDP) data alongside the industrial figures.
GBP/USD: Technical outlook
GBP/USD: Daily Chart
As observed on the daily chart, GBP/USD is struggling at the previous strong support-turned-resistance at 1.3142 on the road to recovery.
The 14-day Relative Strength Index (RSI) has turned lower while below the midline, currently near 36, suggesting that more downside remains on the cards.
Adding credence to the bearish potential, the 21-day Simple Moving Average (SMA) is looking to close the week below the 200-day SMA, which will confirm a Bear Cross if that happens.
These technical indicators point to more pain for the GBP/USD pair heading into a new week.
If the abovementioned resistance is scaled decisively, powerful resistance will then align around the 1.3265 region, where the Aug 4 low, the 21-day and 200-day SMA close in.
A sustained move above that zone will unleash additional recovery toward the 50-day SMA barrier at 1.3393.
Conversely, if the downside regains momentum, a test of the multi-month troughs at 1.3010 will be inevitable.
Selling pressure will intensify below the latter, opening the door toward the April 11 low of 1.2967.
The last line of defense for Pound Sterling buyers is seen at the 1.2850 psychological level.
Economic Indicator
Gross Domestic Product (QoQ)
The Gross Domestic Product (GDP), released by the Office for National Statistics on a monthly and quarterly basis, is a measure of the total value of all goods and services produced in the UK during a given period. The GDP is considered as the main measure of UK economic activity. The QoQ reading compares economic activity in the reference quarter to the previous quarter. Generally, a rise in this indicator is bullish for the Pound Sterling (GBP), while a low reading is seen as bearish.
EUR/USD stays in a consolidation phase above 1.1500 in the European session on Friday after rising nearly 0.5% on Thursday. As market participants await the University of Michigan’s (UoM) Consumer Sentiment data for November, the pair’s technical outlook highlights buyers’ hesitancy.
Euro Price This week
The table below shows the percentage change of Euro (EUR) against listed major currencies this week. Euro was the weakest against the Japanese Yen.
USD
EUR
GBP
JPY
CAD
AUD
NZD
CHF
USD
-0.01%
0.14%
-0.40%
0.74%
0.95%
2.11%
0.39%
EUR
0.01%
0.16%
-0.28%
0.75%
0.95%
2.13%
0.40%
GBP
-0.14%
-0.16%
-0.60%
0.59%
0.79%
1.96%
0.24%
JPY
0.40%
0.28%
0.60%
1.09%
1.32%
2.49%
0.90%
CAD
-0.74%
-0.75%
-0.59%
-1.09%
0.15%
1.34%
-0.33%
AUD
-0.95%
-0.95%
-0.79%
-1.32%
-0.15%
1.17%
-0.51%
NZD
-2.11%
-2.13%
-1.96%
-2.49%
-1.34%
-1.17%
-1.69%
CHF
-0.39%
-0.40%
-0.24%
-0.90%
0.33%
0.51%
1.69%
The heat map shows percentage changes of major currencies against each other. The base currency is picked from the left column, while the quote currency is picked from the top row. For example, if you pick the Euro from the left column and move along the horizontal line to the US Dollar, the percentage change displayed in the box will represent EUR (base)/USD (quote).
In the absence of the official employment report, because of the ongoing government shutdown in the US, investors scrutinize data that could provide fresh insights into the labor market conditions.
On Thursday, Challenger, Gray & Christmas reported that US-based employers cut more than 150,000 jobs in October. This marked the biggest reduction for the month in over two decades. The underlying details of the publication showed that tech firms, retailers and the services sector led the job cuts in this period. With this report reviving concerns over worsening conditions in the labor market, the USD came under selling pressure on Thursday and helped EUR/USD push higher.
Early Friday, the USD corrects higher and limits EUR/USD’s upside. In the second half of the day, markets will pay close attention to the UoM Consumer Sentiment data. A noticeable deterioration in consumer confidence could make it difficult for the USD to stay resilient against its rivals heading into the weekend. On the other hand, an improvement in the headline print, combined with an uptick in the 1-year Consumer Inflation Expectations component of the report, could support the USD and weigh on EUR/USD.
EUR/USD Technical Analysis
The Relative Strength Index (RSI) indicator on the 4-hour chart declines toward 50, reflecting buyers’ hesitancy. Additionally, EUR/USD started to edge lower after coming within a touching distance of the 50-perios Simple Moving Average (SMA).
On the downside, 1.1500 (Fibonacci 78.6% retracement of the latest uptrend) aligns as the first support level before 1.1450 (static level) and 1.1425 (lower limit of the descending regression channel).
Looking north, resistance levels could be spotted at 1.1550 (50-period SMA), 1.1580 (Fibonacci 61.8% retracement) and 1.1600-1.1610 (100-period SMA, upper limit of the descending channel).
Euro FAQs
The Euro is the currency for the 20 European Union countries that belong to the Eurozone. It is the second most heavily traded currency in the world behind the US Dollar. In 2022, it accounted for 31% of all foreign exchange transactions, with an average daily turnover of over $2.2 trillion a day.
EUR/USD is the most heavily traded currency pair in the world, accounting for an estimated 30% off all transactions, followed by EUR/JPY (4%), EUR/GBP (3%) and EUR/AUD (2%).
The European Central Bank (ECB) in Frankfurt, Germany, is the reserve bank for the Eurozone. The ECB sets interest rates and manages monetary policy.
The ECB’s primary mandate is to maintain price stability, which means either controlling inflation or stimulating growth. Its primary tool is the raising or lowering of interest rates. Relatively high interest rates – or the expectation of higher rates – will usually benefit the Euro and vice versa.
The ECB Governing Council makes monetary policy decisions at meetings held eight times a year. Decisions are made by heads of the Eurozone national banks and six permanent members, including the President of the ECB, Christine Lagarde.
Eurozone inflation data, measured by the Harmonized Index of Consumer Prices (HICP), is an important econometric for the Euro. If inflation rises more than expected, especially if above the ECB’s 2% target, it obliges the ECB to raise interest rates to bring it back under control.
Relatively high interest rates compared to its counterparts will usually benefit the Euro, as it makes the region more attractive as a place for global investors to park their money.
Data releases gauge the health of the economy and can impact on the Euro. Indicators such as GDP, Manufacturing and Services PMIs, employment, and consumer sentiment surveys can all influence the direction of the single currency.
A strong economy is good for the Euro. Not only does it attract more foreign investment but it may encourage the ECB to put up interest rates, which will directly strengthen the Euro. Otherwise, if economic data is weak, the Euro is likely to fall.
Economic data for the four largest economies in the euro area (Germany, France, Italy and Spain) are especially significant, as they account for 75% of the Eurozone’s economy.
Another significant data release for the Euro is the Trade Balance. This indicator measures the difference between what a country earns from its exports and what it spends on imports over a given period.
If a country produces highly sought after exports then its currency will gain in value purely from the extra demand created from foreign buyers seeking to purchase these goods. Therefore, a positive net Trade Balance strengthens a currency and vice versa for a negative balance.
Platinum price didn’t change anything due to its fluctuation between the levels of the current sideways track, that are represented by $1605.00, and $1525.00, which represents a key support for reducing the chances of suffering extra losses.
Note that stochastic attempt to provide positive momentum might push the price to form bullish trading, to attempt to renew the pressure on the previously mentioned barrier, to find an exit to record extra gains in the upcoming period, while breaking the support and holding below it will force it to suffer several losses that begin at $1485.00.
The expected trading range for today is between 985.00 and 1040.00
The GBP/USD forecast shows the pound trading lower amid the BoE’s dovish policy stance.
The BoE kept rates unchanged at 4%, increasing the probability for easing in the coming months.
Traders await the US preliminary UoM reports and commentary from FOMC and MPC members for further policy cues.
The GBP/USD forecast shows the pair trading slightly lower on Friday, near 1.3100, as the pound weakened amid the Bank of England’s dovish policy decision. As expected, the BoE kept the interest rates unchanged at 4% in the November meeting.
The MPC members’ votes revealed a 5-4 split, highlighting growing support for further rate cuts by the central bank. Four policymakers favored a 25 bps reduction to 3.75%, suggesting that the Central Bank could prepare for policy easing sooner than expected.
The BoE’s stance also implied that if disinflation persists, the bank rate could gradually decline to support the easing economy instead of mitigating inflation. This stance weighed on the pound sterling, with investors anticipating a potential December rate cut, declining bond yields, and the pound’s momentum after its last rally.
Across the Atlantic, the greenback witnessed a boost amid fresh safe-haven demand and cautious optimism regarding the Fed’s next move. The US labor data came in softer, revealing over 153,000 job cuts in October, its highest in the past two decades. According to the CME FedWatch Tool, the markets are pricing in a 67% probability of a December Fed cut, instead of yesterday’s 62%. Meanwhile, the ongoing Federal government shutdown has halted key data releases, with traders focusing on private data sources for further near-term clues.
GBP/USD Daily Key Events
The major events in the day include:
MPC Member Pill Speaks
FOMC Member Jefferson Speaks
Prelim UoM Consumer Sentiment
Prelim UoM Inflation Expectations
On Friday, traders await the commentary from MPC member Pill and FOMC member Jefferson, along with the US Prelim UoM consumer sentiment, to gauge the momentum.
GBP/USD Technical Forecast: Struggling to Hold Above 1.3100
GBP/USD 4-hour chart
The GBP/USD 4-hour chart suggests a mild bearish bias as the pair trades near 1.3100, losing ground after surging from previous lows near 1.3050. The price remains below the key 50-, 100-, and 200-period MAs, indicating the bearish bias continues. However, the 20-MA near 1.3085 could support the pair.
The RSI declined to 50.0, suggesting consolidation after reaching posting recovery from 1.3000 mark. A sustained breach above the 50-MA near 1.3140 could open room for 1.13260. Conversely, a drop below 1.3100 could potentially trigger renewed selling pressure, extending the downside towards 1.3050 and 1.3000.
–Are you interested to learn more about forex bonuses? Check our detailed guide-
Support Levels
Resistance Levels
Looking to trade forex now? Invest at eToro!
68% of retail investor accounts lose money when trading CFDs with this provider. You should consider whether you can afford to take the high risk of losing your money.
FX Empire – Survey of Consumers – University of Michigan
Waning consumer confidence and elevated inflation expectations could signal a pullback in consumer spending. Softer spending trends could dampen inflation and the US economy, given that private consumption accounts for roughly 65% of GDP.
A cooling inflation outlook and potential loss of economic momentum may raise expectations of a December Fed rate cut. A more dovish Fed rate path could push USD/JPY toward the 50-day Exponential Moving Average (EMA).
On the other hand, a pickup in consumer sentiment and easing inflation expectations could signal an upswing in consumer spending, supporting a less hawkish Fed policy stance. Fading bets on a December Fed rate cut could send USD/JPY toward the November 4 high of 154.483.
Fed Speakers in Focus as Labor Market Data Flashes Red
Beyond the data, FOMC members’ speeches will require consideration, given growing concerns about the US labor market. According to Challenger, Gray, & Christmas data, job cuts soared from 54.064k in September to 153.074k in October, raising bets on a December Fed rate cut.
According to the CME FedWatch Tool, the chances of a December policy adjustment rose from 62.0% to 70.6% on Thursday, November 6.
Growing Fed support for a rate cut in December could weigh on the US dollar, supporting a USD/JPY fall toward 151 and the 50-day EMA. Conversely, continued concerns about elevated inflation, despite a cooling labor market, may send the pair toward 154.483.
Given the US labor market data and potential impact on wage growth and spending, the near-term outlook looks bearish for USD/JPY.
USD/JPY Scenarios: Diverging Monetary Policies
Bearish USD/JPY Scenario: Hawkish BoJ rhetoric, intervention threats, weak US data, and dovish Fed cues could push USD/JPY toward 151.
Bullish USD/JPY Scenario: Dovish BoJ commentary, strong US data, and hawkish Fed policy signals could send USD/JPY toward 154.483.
The British pound rallied early Thursday following the Bank of England’s decision to hold rates, but the overall trend remains bearish.
Resistance sits near 1.32, with downside risks below 1.30 potentially extending toward 1.2750.
The British pound has rallied significantly during the early hours on Thursday as the market reacts to the Bank of England and its interest rate decision, which was to keep things as they were. However, it’s also worth noting that the Bank of England is narrowly maintaining its stance. With that being the case, I believe we are still very much in a downtrend, and I’ll be watching the 1.32 level for potential resistance. That area had previously acted as support, and the 200-day EMA moving toward that zone also adds to the resistance that we could see on any attempt to break higher.
Ultimately, this move looks like a rebound from the 1.30 level, a large round number with psychological significance that attracts plenty of market attention. If and when we break down below 1.30, the British pound will likely target the 1.2750 level. Conversely, a break above the 200-day EMA, currently at 1.3265, might signal a recovery, though it’s important to remember that we remain well below that moving average, and this is what some people will look at to determine the longer-term trend in a market.
The 50-day EMA is now dropping sharply toward the 200-day EMA, setting up the possibility of a “death cross.” The prior uptrend line has been broken, retested, and then followed by another sell-off. All things considered, this is a market where traders are likely watching for signs of exhaustion to start selling into. While the pound’s reprieve for the day may draw attention, it doesn’t change the overall downward trajectory of this currency pair.
Christopher Lewis has been trading Forex and has over 20 years experience in financial markets. Chris has been a regular contributor to Daily Forex since the early days of the site. He writes about Forex for several online publications, including FX Empire, Investing.com, and his own site, aptly named The Trader Guy. Chris favours technical analysis methods to identify his trades and likes to trade equity indices and commodities as well as Forex. He favours a longer-term trading style, and his trades often last for days or weeks.
As I analyze the U.S. dollar’s decline against the Japanese yen, I emphasize key support near ¥153 and ¥150.
Despite recent weakness, I expect buyers to return, favoring the dollar as the broader uptrend remains intact due to rate differentials.
The U.S. dollar fell pretty significantly during the trading session on Thursday against the Japanese yen, but we find ourselves hanging around the crucial ¥153 level. The ¥153 level is an area that a lot of people have been paying close attention to multiple times in the past, and therefore, I think if we get some type of breakdown from here, there’s plenty of support all the way down to the ¥151.50 level, possibly even the 50-day EMA, which is at the ¥150.66 level.
The ¥150 level is a major support area after that. It really isn’t until we break down below the ¥150 level that I think we see a potential shift in the trend, and right now I think that’s a bit much to ask. I like the idea of buying the bounce if and when we get it, and therefore, I expect a certain amount of volume to come back into the market and push it higher. For now, my job is simply to wait and get involved once the market shows signs of life.
The Importance of 155 Yen
The ¥155 level is another area that many traders will be paying close attention to, as it has been important in the past. If we break above the ¥155 level, this market could continue to move much higher.
The interest rate differential will continue to favor the Americans, and the Bank of Japan really won’t have much opportunity to tighten monetary policy or close that differential between the two currencies. I think it’s probably only a matter of time before the overall uptrend continues. I plan on getting involved again once it does, adding to an already long position that I’ve held for months.
Christopher Lewis has been trading Forex and has over 20 years experience in financial markets. Chris has been a regular contributor to Daily Forex since the early days of the site. He writes about Forex for several online publications, including FX Empire, Investing.com, and his own site, aptly named The Trader Guy. Chris favours technical analysis methods to identify his trades and likes to trade equity indices and commodities as well as Forex. He favours a longer-term trading style, and his trades often last for days or weeks.
Register now to be able to add articles to your reading list.
” aria-hidden=”true”>
Quick overview
The British pound stabilized around $1.3100 after the Bank of England held its Official Bank Rate at 4.00%, reflecting internal divisions within the Monetary Policy Committee.
Governor Andrew Bailey cautioned that while inflation is easing, price pressures remain high, emphasizing the need for vigilance regarding wage growth and services inflation.
Market expectations suggest the BoE will maintain its current rate until at least early 2026, with future decisions hinging on upcoming inflation and labor data.
Technically, GBP/USD shows signs of potential stabilization, with key resistance levels identified at $1.3120 and $1.3180, indicating a possible buy-on-breakout strategy.
The British pound steadied near $1.3100 on Thursday after the Bank of England (BoE) voted to keep its Official Bank Rate unchanged at 4.00%, marking the fifth consecutive hold. The decision, however, revealed deep divisions within the Monetary Policy Committee (MPC), with a 0–4–5 split, underscoring policymakers’ struggle to balance persistent inflation risks against slowing economic momentum.
Governor Andrew Bailey maintained a cautious tone, acknowledging signs of easing inflation but warning that price pressures remain elevated. “We’re not declaring victory yet,” Bailey noted, stressing that the BoE must stay alert to wage growth and services inflation, both of which continue to run above target.
The pound’s reaction was muted, as traders digested the lack of fresh guidance on rate cuts. Market participants now see the BoE staying on hold until at least early 2026, with the next move dependent on inflation and labor data in the months ahead.
Mixed U.S. Data Caps Dollar Gains
Across the Atlantic, the U.S. dollar stabilized after a volatile midweek session. The ADP Non-Farm Employment Change showed a gain of 42,000 jobs, beating expectations of 32,000, while the ISM Services PMI rose modestly to 52.4, indicating steady but moderate expansion.
Despite the upbeat data, dollar strength stalled as traders looked ahead to remarks from FOMC member Christopher Waller later in the day. His comments could shape expectations for future rate adjustments, especially as inflationary pressures begin to soften.
GBP/USD Technical Outlook
From a technical standpoint, GBP/USD is attempting to stabilize after weeks of heavy selling. The pair recently rebounded from $1.3010, aligning with the 0% Fibonacci retracement of its August-to-September rally, hinting at short-term exhaustion among sellers.
GBP/USD Price Chart – Source: Tradingview
Candlestick patterns show a hammer followed by a bullish engulfing, signaling potential for a short-term rebound. The RSI near 34 has turned upward from oversold territory, suggesting a possible shift in momentum.
Resistance lies at $1.3120 and $1.3180, where the 20-day EMA converges with the mid-channel trendline. A confirmed breakout above these could open the door toward $1.3240–$1.3320, while failure to hold above $1.3010 risks another slide toward $1.2940.
For traders, the setup favors a buy-on-breakout strategy above $1.3120, targeting $1.3240, with a stop near $1.3010.
Arslan Butt
Lead Markets Analyst – Multi-Asset (FX, Commodities, Crypto)
Arslan Butt serves as the Lead Commodities and Indices Analyst, bringing a wealth of expertise to the field. With an MBA in Behavioral Finance and active progress towards a Ph.D., Arslan possesses a deep understanding of market dynamics.
His professional journey includes a significant role as a senior analyst at a leading brokerage firm, complementing his extensive experience as a market analyst and day trader. Adept in educating others, Arslan has a commendable track record as an instructor and public speaker.
His incisive analyses, particularly within the realms of cryptocurrency and forex markets, are showcased across esteemed financial publications such as ForexCrunch, InsideBitcoins, and EconomyWatch, solidifying his reputation in the financial community.


")

")
