The main tag of Forex News Today Articles.
You can use the search box below to find what you need.
[wd_asp id=1]

24 06, 2026

EUR/JPY Price Forecast: Symmetrical Triangle Nears Breakdown Point At 183.50

By |2026-06-24T10:29:19+03:00June 24, 2026|Forex News, News|0 Comments

The EUR/JPY currency pair is approaching a critical juncture as it tests the lower boundary of a symmetrical triangle pattern near the 183.50 support level. This technical formation, which has been developing over recent weeks, signals that a decisive directional move may be imminent. Traders are closely watching whether the pair can hold this level or if a breakdown will trigger further downside momentum.

Understanding the Symmetrical Triangle Pattern

A symmetrical triangle is a continuation pattern that forms when price action consolidates between converging trendlines. In the case of EUR/JPY, the upper trendline has been declining while the lower trendline has been rising, compressing the trading range. The pattern typically resolves with a breakout in the direction of the prevailing trend, which for EUR/JPY has been bearish over the short term. The 183.50 level represents the lower boundary of this triangle and is a key support zone that bulls must defend to prevent a bearish breakdown.

The pattern’s significance lies in its ability to measure potential price targets after a breakout. If the support at 183.50 fails, the measured move suggests a decline toward the 180.00 psychological level. Conversely, a bounce from this level could see the pair rally back toward the upper trendline near 185.50 or higher.

Key Technical Levels to Watch

Beyond the immediate triangle boundaries, several other technical levels are relevant for traders. The 183.00 round number provides secondary support below the triangle. On the upside, resistance is clustered around the 185.00 handle, followed by the 186.00 zone, which aligns with previous swing highs. The 50-day moving average, currently near 184.80, also acts as a dynamic resistance level.

Momentum indicators such as the Relative Strength Index (RSI) are hovering near neutral territory, offering no clear directional bias. This indecision reinforces the importance of the triangle breakout as a catalyst for the next trend. Volume patterns will also be critical; a breakout accompanied by above-average volume would lend credibility to the move.

What This Means for Forex Traders

For traders, the current setup presents both opportunity and risk. Those positioned for a breakdown may look for a close below 183.50 on a daily basis as confirmation, targeting the next support levels. Alternatively, traders anticipating a bounce may enter long positions near the triangle support with a stop loss below the recent swing low. The narrow range of the triangle also suggests that volatility could expand sharply once the breakout occurs, making position sizing and risk management essential.

Fundamental factors also play a role. The euro has been under pressure from a dovish European Central Bank outlook, while the yen has been supported by safe-haven flows amid global uncertainty. Any shift in these dynamics could influence the direction of the breakout.

Conclusion

The EUR/JPY pair is at a pivotal point as it tests the symmetrical triangle support near 183.50. The outcome of this technical test will likely determine the pair’s direction in the coming sessions. Traders should monitor price action closely for a confirmed breakout or breakdown, while remaining mindful of broader fundamental drivers. As always, disciplined risk management is advised given the potential for increased volatility.

FAQs

Q1: What is a symmetrical triangle pattern in forex trading?
A symmetrical triangle is a chart pattern formed by converging trendlines, indicating a period of consolidation. It typically resolves with a breakout in the direction of the prior trend, and traders use it to anticipate the next significant price move.

Q2: Why is the 183.50 level important for EUR/JPY?
The 183.50 level represents the lower boundary of the symmetrical triangle pattern. A break below this level could trigger further downside, while holding it may lead to a bounce toward the upper trendline. It is a key support zone for the pair.

Q3: How can traders manage risk during a triangle breakout?
Traders should wait for a confirmed close outside the triangle boundaries before entering a trade. Using stop-loss orders below the breakout point or recent swing lows helps limit potential losses. Position sizing should account for the expected increase in volatility.

Disclaimer: The information provided is not trading advice, Bitcoinworld.co.in holds no liability for any investments made based on the information provided on this page. We strongly recommend independent research and/or consultation with a qualified professional before making any investment decisions.

Source link

24 06, 2026

EUR/USD Analysis 23/06: USD Dominates Euro 11 Week Low

By |2026-06-24T06:28:24+03:00June 24, 2026|Forex News, News|0 Comments

EUR/USD Analysis Summary Today

EUR/USD Trading Signals:

  • Buy scenario: From the support level of 1.1390 ​​with a target of 1.1550 and a stop-loss at 1.1320

  • Sell scenario: From the resistance level of 1.1540 with a target of 1.1400 and a stop-loss at 1.1600

Technical Analysis of EUR/USD Today

The Euro to US Dollar (EUR/USD) exchange rate faced strong selling pressure during last week’s trading. This came after the US Federal Reserve reinforced market expectations that tight monetary policy will persist for longer than anticipated, pushing the currency pair to its lowest level in nearly 11 weeks near the 1.1418 level during Tuesday’s trading session.

Although the Euro managed to trim some of its losses by the end of the week, the pair’s direction in the coming period will remain captive to the balance between US inflation concerns and the monetary policy paths of both the Federal Reserve and the European Central Bank (ECB).

Technically, the overall trend for the EUR/USD pair remains tilted toward the negative (bearish) side as long as trading stabilizes below the main resistance zone of 1.1550 – 1.1600. Breaking the 1.1450 level reinforces the chances of targeting the 1.1400 and then 1.1300 zones in the coming weeks. Its recent losses are pushing technical indicators closer to oversold lines, as is the case with the Relative Strength Index (RSI) and the MACD indicator.

Conversely, if buyers manage to regain control and break through the nearby resistance levels, this could pave the way for an upward rebound towards 1.1700 and then 1.1800 in the medium term.

In general, the performance of the EUR/USD pair during the current trading week will remain primarily linked to US inflation data and statements from Federal Reserve officials, along with any new indications regarding the European Central Bank’s (ECB) policy direction. These factors could determine the future direction of one of the most traded currency pairs in global markets.

Federal Reserve Policies and Dollar Strength

Last week, the Federal Reserve kept US interest rates unchanged at 3.75%, a decision that aligned with market expectations. However, the surprise came in the updated economic projections, where half of the Federal Open Market Committee (FOMC) members indicated a potential need for further interest rate hikes by the end of 2026.

Federal Reserve Chairman Kevin Warsh’s comments also supported the dollar, as he affirmed the US central bank’s commitment to bringing inflation back to its 2% target. This reinforced investors’ bets on continued monetary tightening in the coming months.

Concurrently, the likelihood of another US interest rate hike increased, which contributed to increased demand for the dollar and pushed the EUR/USD pair further down.

Will the Euro’s Losses Continue?

Danske Bank believes that the downward pressure on the EUR/USD is not over yet, maintaining its forecast for the pair to drop to the 1.12 support level over the next twelve months—a level below the market consensus average. The bank believes that tightening global financial conditions will negatively impact the pace of economic growth, which has already been reflected in the performance of equity markets and cyclically linked currencies, playing in favor of the US Dollar as a more attractive safe haven.

The bank also maintains its expectation that the Federal Reserve will raise interest rates two more times next year, with an increasing likelihood of an earlier tightening cycle if US economic data continues to outperform expectations.

On the other hand, ING Bank adopts a more balanced view toward the pair’s movement. While it acknowledges that the Dollar is currently benefiting from tight monetary policy expectations, it questions the Federal Reserve’s ability to execute further interest rate increases. The bank believes that inflationary pressures could ease significantly next year, and the strength of the US labor market still requires further confirmation. Therefore, it expects the EUR/USD pair to remain under pressure over the next two months near the 1.14 – 1.15 levels before beginning to recover gradually.

According to the bank’s estimates, the pair could rise to 1.18 by the end of the year if US economic data comes in weaker than expected and fails to justify further monetary tightening.

Trading Advice:

It is preferable for traders to monitor stronger gains that could serve as selling targets. Meawhile, maintaining strict risk management in light of the ongoing market uncertainty.

Ready to trade our EUR/USD analysis and predictions? Here are the best European brokers to choose from.

Source link

24 06, 2026

GBP/USD Price Forecast: Hawkish Fed Expectations Keep US Dollar Supported

By |2026-06-24T02:26:59+03:00June 24, 2026|Forex News, News|0 Comments


– Written by

The Pound to US Dollar (GBP/USD) exchange rate edged lower on Tuesday as investors reacted to the latest UK purchasing managers’ index data.

At the time of writing, GBP/USD was trading close to $1.3224, down roughly 0.2% compared with Tuesday’s opening levels.

The Pound (GBP) came under selling pressure on Tuesday after fresh survey data painted a weaker-than-expected picture of the UK economy.

Markets had anticipated that June’s preliminary PMI figures would show a return to growth in the UK’s dominant services sector. Instead, the data revealed that activity contracted at a faster pace than in the previous month, dampening confidence in the economic outlook.

The disappointing release prompted investors to further scale back expectations for future Bank of England (BoE) policy tightening. Some analysts now believe the central bank could keep interest rates unchanged for the rest of 2026.

The US Dollar (USD) remained firmly bid throughout Tuesday’s session as markets continued to digest the implications of the Federal Reserve’s latest policy meeting.

Demand for the ‘Greenback’ was underpinned by expectations that US interest rates may stay elevated for an extended period, with investors increasingly embracing a higher-for-longer outlook.

Save on Your GBP/USD Transfer

Get better rates and lower fees on your next international money transfer.
Compare TorFX with top UK banks in seconds and see how much you could save.


Compare the Best GBP/USD Rates »

Although the Fed left borrowing costs unchanged at its most recent meeting, officials struck a relatively hawkish tone, indicating that further policy tightening cannot be ruled out should inflationary pressures prove stubborn.

Additional support for USD came from a cautious market mood, as weakness across global technology stocks encouraged investors to seek the safety of traditional haven assets.

Near-Term GBP/USD Forecast: Political Developments Could Drive Sterling

With little in the way of major economic releases scheduled over the next couple of days, movements in the Pound to US Dollar (GBP/USD) exchange rate may be driven largely by developments on the UK political front.

As Andy Burnham looks all but guaranteed to succeed Keir Starmer as Prime Minister, investors are increasingly focused on who may be selected for key cabinet positions. In particular, any indications regarding the next Chancellor could have implications for market sentiment toward the UK.

Sterling traders may also pay close attention to comments from BoE policymaker Sarah Breeden on Wednesday. Given her reputation as one of the more dovish members of the Monetary Policy Committee, any suggestion that rates are likely to remain on hold could weigh on the Pound.

For the US Dollar, broader market sentiment may remain the primary driver in the near term, with investors awaiting a series of high-profile US economic releases due later in the week.

Like this piece? Please share with your friends and colleagues:


International Money Transfer? Ask our resident FX expert a money transfer question or try John’s new, free, no-obligation personal service! ,where he helps every step of the way,
ensuring you get the best exchange rates on your currency requirements.

TAGS: Pound Dollar Forecasts

Source link

23 06, 2026

USD/JPY Forecast: Holds above 161.50 as multi‑decade high nears

By |2026-06-23T22:26:25+03:00June 23, 2026|Forex News, News|0 Comments

The USD/JPY pair enters a bullish consolidation phase during the Asian session on Tuesday and currently trades just above 161.50 amid mixed fundamental cues. Spot prices, however, remain well within striking distance of a 40-year peak, around the 162.00 neighborhood set in July 2024, as traders remain on edge amid fears that Japanese authorities will step in to prop up the Japanese Yen (JPY).

Local broadcaster TBS reported that Japan’s Finance Minister Katayama held an online meeting with US Treasury Secretary Bessent to discuss the JPY’s sharp decline and potential intervention. Adding to this, Japan’s Chief Cabinet Secretary Minoru Kihara said that he will take appropriate action against the foreign exchange (FX) moves if needed. This holds back JPY bears from placing fresh bets and caps the upside for the USD/JPY pair.

However, economic risks stemming from the Middle East conflict and energy supply disruptions through the Strait of Hormuz continue to undermine the JPY. Apart from this, a persistently wide Japan-US rate differential keeps the JPY bulls on the back foot. The US Dollar (USD), on the other hand, stands firm near its highest level since May 2025, lending additional support to the USD/JPY pair.

Last week’s sustained breakout through the previous intervention zone, around the 160.50-160.60 area, comes on top of the recent solid bounce from the 200-day Exponential Moving Average (EMA) and keeps the broader uptrend intact. That said, the Relative Strength Index (14) is hovering in overbought territory near 70, which hints at risk of consolidation or a corrective pause rather than a confirmed near-term top for the USD/JPY pair.

Meanwhile, the Moving Average Convergence Divergence (MACD) indicator remains positive above the zero line, reinforcing the underlying upward pressure. In the meantime, the structural pivot around 160.60-160.50 should protect the immediate downside. Moreover, the 200-day EMA at 156.47 should provide a deeper layer of trend support if a sharper corrective pullback unfolds amid elevated RSI readings.

(The technical analysis of this story was written with the help of an AI tool.)

USD/JPY daily chart

Japanese Yen Price Last 30 days

The table below shows the percentage change of Japanese Yen (JPY) against listed major currencies last 30 days. Japanese Yen was the strongest against the New Zealand Dollar.

USD EUR GBP JPY CAD AUD NZD CHF
USD 1.73% 1.49% 1.66% 2.90% 2.62% 3.16% 2.85%
EUR -1.73% -0.24% -0.09% 1.12% 0.88% 1.42% 1.11%
GBP -1.49% 0.24% 0.21% 1.43% 1.16% 1.68% 1.39%
JPY -1.66% 0.09% -0.21% 1.17% 0.99% 1.51% 1.10%
CAD -2.90% -1.12% -1.43% -1.17% -0.17% 0.33% -0.04%
AUD -2.62% -0.88% -1.16% -0.99% 0.17% 0.53% 0.22%
NZD -3.16% -1.42% -1.68% -1.51% -0.33% -0.53% -0.31%
CHF -2.85% -1.11% -1.39% -1.10% 0.04% -0.22% 0.31%

The heat map shows percentage changes of major currencies against each other. The base currency is picked from the left column, while the quote currency is picked from the top row. For example, if you pick the Japanese Yen from the left column and move along the horizontal line to the US Dollar, the percentage change displayed in the box will represent JPY (base)/USD (quote).

Source link

23 06, 2026

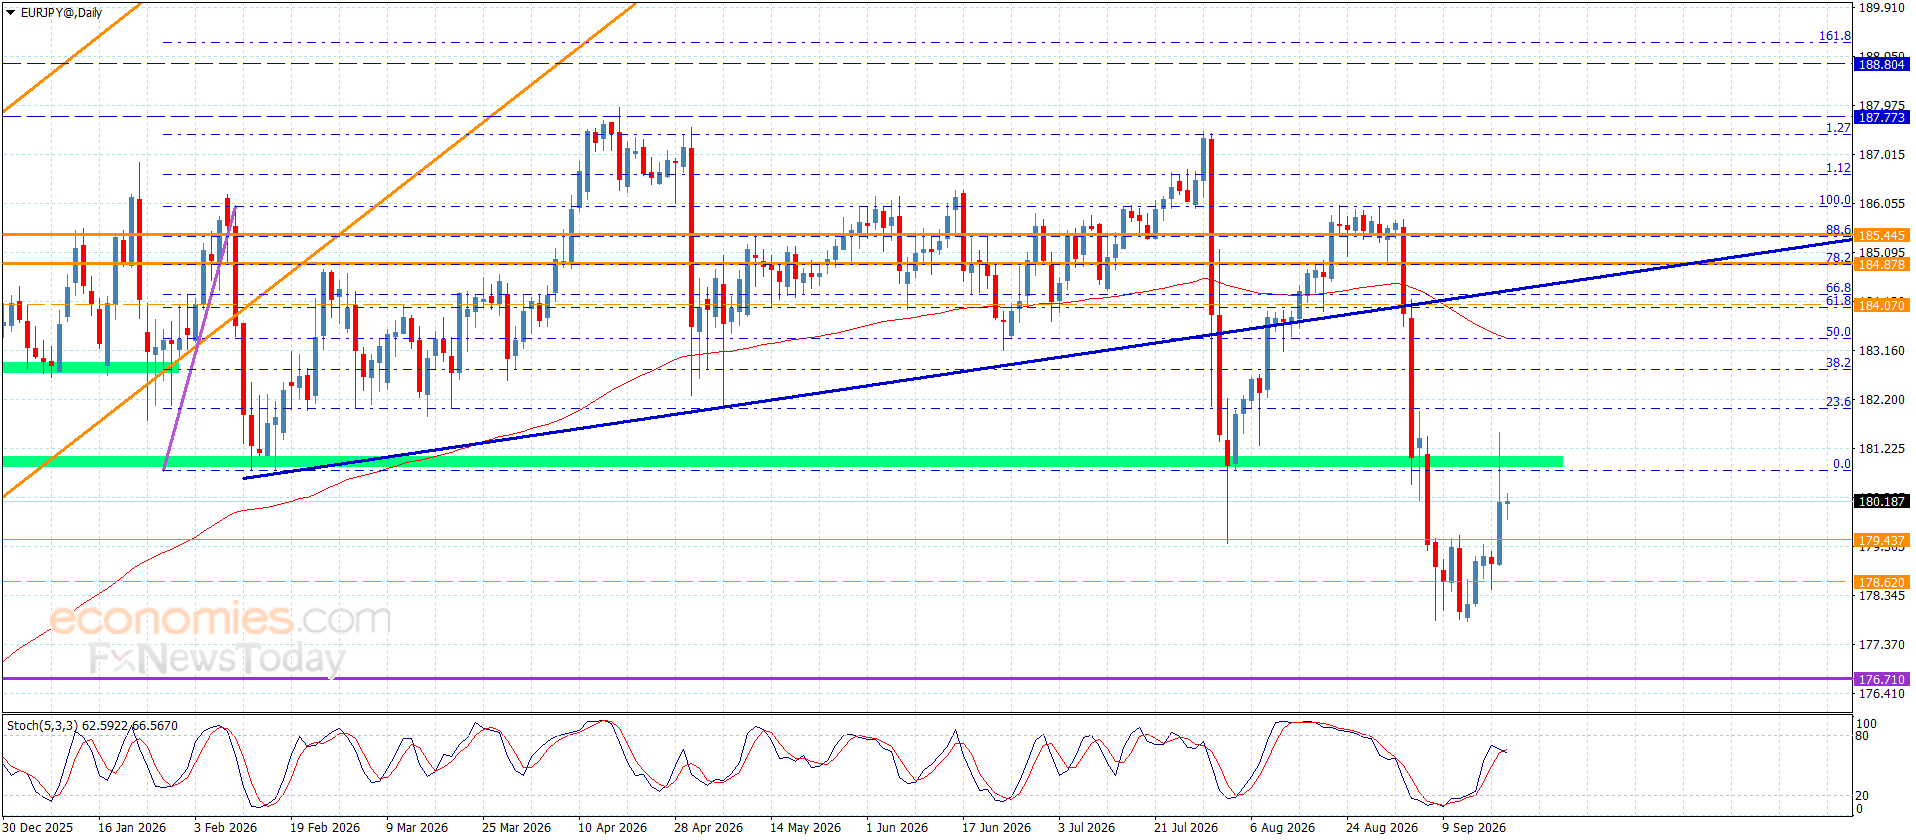
The GBPJPY Price Repeats Negative Stability – Forecast today – 23-6-2026

By |2026-06-23T18:24:22+03:00June 23, 2026|Forex News, News|0 Comments


Platinum price remains affected by recurring negative pressures, represented by its overall stability below the main resistance level currently extending toward $1,940.00. In addition, the $1,865.00 level is forming another strong barrier, forcing the price to renew its bearish attempts, with the price currently positioned near the $1,645.00 level.


The availability of negative momentum will increase the chances of the price attacking the support level at $1,605.00 soon. A break below this level would strengthen the chances of resuming the bearish move, targeting $1,565.00 and then $1,490.00 respectively.


The expected trading range for today is between $1,565.00 and $1,700.00


Trend forecast: Bearish


Source link

23 06, 2026

The EURJPY Price Searching for a Breakout – Forecast today – 23-6-2026

By |2026-06-23T14:23:19+03:00June 23, 2026|Forex News, News|0 Comments


Platinum price remains affected by recurring negative pressures, represented by its overall stability below the main resistance level currently extending toward $1,940.00. In addition, the $1,865.00 level is forming another strong barrier, forcing the price to renew its bearish attempts, with the price currently positioned near the $1,645.00 level.


The availability of negative momentum will increase the chances of the price attacking the support level at $1,605.00 soon. A break below this level would strengthen the chances of resuming the bearish move, targeting $1,565.00 and then $1,490.00 respectively.


The expected trading range for today is between $1,565.00 and $1,700.00


Trend forecast: Bearish


Source link

23 06, 2026

GBP/USD, EUR/USD Forecast: Two trades to watch

By |2026-06-23T10:22:15+03:00June 23, 2026|Forex News, News|0 Comments

GBP/USD Struggles as Starmer on Resignation Watch

GBP/USD is trading close to this year’s lows as political uncertainty builds and speculation surrounding Prime Minister Keir Starmer’s future adds another headwind for sterling.

Starmer may step down as soon as today, although it is still unclear whether he will or whether he will remain in power to fight any potential leadership challenge from Greater Manchester Mayor Andy Burnham, whose victory in the Makerfield by-election has given him a path to Westminster.

For the pound, the key focus is fiscal policy. Should Burnham become Prime Minister, markets will want clarity on his spending plans and whether he would maintain the current fiscal rules. Any suggestion of increased borrowing could be poorly received by the UK bond market, particularly given the UK’s already stretched debt position.

A potential increase in gilt issuance to fund higher spending could make investors nervous at a time when concerns surrounding public finances remain elevated.

The pound has also come under pressure after cooler-than-expected UK CPI data last week prompted markets to scale back expectations for a Bank of England rate hike this year.

This contrasts with the more hawkish tone from the Federal Reserve following last week’s FOMC meeting.

The Fed’s hawkish tilt helped lift the US Dollar Index to a fresh 2026 high and could continue to support the greenback.

Attention now turns to US Core PCE inflation data, which could provide further clues over the outlook for US interest rates.

GBP/USD Forecast – Technical Analysis

image-20260622085917-1

GBP/USD broke below its symmetrical triangle pattern, falling to a low of 1.3160 before recovering back above 1.3200. The pair continues to trade below its 50 and 200 SMAs, while the RSI remains below 50, keeping sellers hopeful of further downside.

Sellers will look for a break below 1.3160 to create a lower low and open the door towards the psychological 1.3000 level.

Buyers may be encouraged by the hammer candlestick reversal pattern. However, they will need to reclaim 1.3250 before bringing 1.3335 into focus. Above here, the 200 SMA around 1.3400 and the rising trendline resistance come into view.

EUR/USD Caught Between Falling Oil Prices and a Hawkish Fed

EUR/USD fell to 1.1410 last week, its lowest level since March, as the US dollar surged following the hawkish FOMC meeting. While the pair has recovered some ground, it remains well below 1.1500.

The euro is finding some support today after progress was reported in the first session of talks between the US and Iran. Oil prices have fallen further as vessels continue to move through the Strait of Hormuz.

This is positive for Europe, which remains heavily dependent on imported energy.

However, gains in EUR/USD could remain limited by continued US dollar strength. Last week’s FOMC meeting saw the Fed leave rates unchanged, but nine of 18 policymakers now expect a rate hike before the end of the year. Meanwhile, new Fed Chair Kevin Walsh doubled down on the importance of returning inflation to target, reinforcing the hawkish message.

Attention this week will focus on US Core PCE, the Fed’s preferred inflation gauge, which could provide further clues over the path of US interest rates.

While the ECB raised rates just a week before the Federal Reserve, that move already appears to have faded into the background. The ECB maintained a cautious, data-dependent tone and another rate hike risks placing additional pressure on an already fragile Eurozone economy.

Today, attention turns to Eurozone consumer confidence, which is expected to remain broadly stable around -18. ECB President Christine Lagarde is also due to speak.

Tomorrow’s PMI figures could provide further insight into the health of the Eurozone economy after May’s composite PMI remained in contraction territory. Another weak reading could keep pressure on the euro.

EUR/USD Forecast – Technical Analysis

image-20260622085956-2

EUR/USD broke down from its symmetrical triangle pattern, falling below its 200 SMA and dropping to a low of 1.1410. This, combined with the RSI below 50, keeps sellers hopeful of further downside.

Immediate support can be seen at 1.1450, with a break below opening the door to 1.1400. Sellers will be looking to take out this level to create a lower low and extend the decline towards 1.1300.

Buyers may be encouraged by the long lower wick on Friday’s candle, suggesting demand emerged at lower levels. The hammer candlestick could signal a reversal. In that scenario, buyers would need to rise above 1.1500 to bring 1.1600 into focus, before exposing the 200 SMA at 1.1670.

Source link

23 06, 2026

Yen Can Move Mountains. Forecast as of 22.06.2026

By |2026-06-23T06:21:17+03:00June 23, 2026|Forex News, News|0 Comments

Both the US and Japanese governments are seeking to place allies in key central bank positions to increase their influence. However, while Donald Trump has achieved limited success, Sanae Takaichi has been far more effective. Let’s discuss this topic and develop a trading plan for the USD/JPY pair.

The article covers the following subjects:

Major Takeaways

  • The Japanese government wants to gain control over the BoJ.
  • The Bank of Japan will raise rates in October or December.
  • The Fed is poised to tighten policy in September.
  • Consider short trades if the USDJPY pair falls below 161.45.

Weekly Fundamental Forecast for Yen

While Donald Trump openly pressures the Fed to cut rates, Sanae Takaichi has pursued a more discreet strategy. Despite backing the Bank of Japan’s tightening cycle in public, she has helped place dovish officials on the Board of Governors. One recent appointee, Toichiro Osada, voted against further tightening, raising concerns that the BoJ could slow the pace of normalization and support the ongoing USD/JPY rally.

The Board of Governors consists of nine members, and within the next 12 months, four of them could be supporters of Sanae Takaichi’s expansionary monetary and fiscal agenda. What Donald Trump has so far failed to achieve—gaining greater influence over the central bank—could become a reality in Japan under its prime minister. Growing concerns over the BoJ’s independence have emerged as another factor, pushing the USD/JPY pair to its strongest levels since 1986.

Expected Timing of the Next BoJ Rate Hike

Source: Bloomberg.

What can the Bank of Japan do in this situation? It needs to raise rates to a neutral level as quickly as possible, one that neither stimulates nor restrains the economy, before it’s too late and before the doves gain greater influence on the Board of Governors.

Deputy Governor Ryozo Himino’s message is becoming increasingly clear. He has warned that delaying monetary tightening could ultimately force the Bank of Japan to raise rates more aggressively, making the eventual adjustment more costly for the economy. Nevertheless, 52% of economists surveyed by Bloomberg expect the BoJ’s next rate hike to come only in December, while 36% see October as the most likely timing.

The BoJ’s cautious approach continues to weigh heavily on the yen. The wide interest rate gap with the Fed encourages capital to flow from Japan to the US, providing ongoing support for USD/JPY. The pair is drawing additional strength from market expectations that the Fed is not done tightening yet. According to derivatives pricing, investors see a 77% probability of a rate hike in September and a 59% chance of two additional rate increases before year-end.

USD/JPY and Japan’s Currency Interventions

Source: Bloomberg.

The government’s desire to maintain an accommodative monetary policy is increasingly constrained by the weakening yen. Further depreciation may fuel inflation, particularly as higher energy costs continue to feed into Japan’s core CPI. As a result, Tokyo may have little choice but to step up its efforts to bolster the currency through intervention.

However, the authorities face two major obstacles: the limited effectiveness of past interventions, which consumed roughly $73 billion, and the dollar’s strong underlying fundamentals. The market has largely shrugged off Finance Minister Satsuki Katayama’s warnings of decisive action. Had the latest warning come from Japan’s top currency diplomat, Atsushi Mimura, as it did in April, investors might have paid much closer attention.

Weekly USDJPY Trading Plan

Probably, currency interventions are on the horizon. If the USD/JPY pair drops below 161.45, short trades can be opened.


This forecast is based on the analysis of fundamental factors, including official statements from financial institutions and regulators, various geopolitical and economic developments, and statistical data. Historical market data are also considered.

Price chart of USDJPY in real time mode

The content of this article reflects the author’s opinion and does not necessarily reflect the official position of LiteFinance broker. The material published on this page is provided for informational purposes only and should not be considered as the provision of investment advice for the purposes of Directive 2014/65/EU.


According to copyright law, this article is considered intellectual property, which includes a prohibition on copying and distributing it without consent.

Rate this article:

{{value}} ( {{count}} {{title}} )


Source link

23 06, 2026

The EURJPY holds above support – Forecast today – 22-6-2026

By |2026-06-23T02:20:20+03:00June 23, 2026|Forex News, News|0 Comments


Platinum price returned to stabilize near the $1,655.00 level, affected by the negative pressures represented by the formation of the $1,780.00 level as an additional strong resistance barrier, along with the main indicators providing negative momentum during the recent period.


Based on the above, we expect the price to attempt to resume its bearish moves, which may target the stable support level at $1,605.00 in the near term. A break below this level could extend the losses toward $1,565.00 and $1,490.00.


The expected trading range for today is between $1,605.00 and $1,730.00


Trend forecast: Bearish


Source link

22 06, 2026

GBP/USD Forecast 22/06: Watching the Floor (Video)

By |2026-06-22T22:19:24+03:00June 22, 2026|Forex News, News|0 Comments

The British pound has shown some signs of bouncing for a bigger move, as we were getting close to a big support level. This is a pair that features two relatively firm currencies at the moment, so this could remain rangebound.

GBP/USD

The British pound has shown itself to be somewhat resilient during the trading session as the market drifted into a basically 3-day weekend in the United States, as Juneteenth would be celebrated. That being said, we were also at the bottom of a significant range, with the 1.32 level being a massive support level.

Ultimately, I like the idea of maybe playing a short-term rally here, understanding that any signs of exhaustion would be a potential selling opportunity. I think you have to look at this as a market that is currently trying to navigate the interest rate situation, but when you zoom way out, you can see that this 1.32 level is an area that’s been important, and I think you would have to assume that some type of reaction makes sense.

Technical Resistance and Range Dynamics

Again, I think the 1.33 level is resistance followed by the 200-day EMA. I’ve got no interest in getting into a longer-term trade at the moment. I think just a short-term bounce makes sense.

Keep in mind it was Juneteenth in the United States, and that means that about half the day was pretty quiet. And then I do believe ultimately, though, we are looking at a pair that is just staying within the same range it’s been in for well over a year.

We’re getting close to the bottom of that range, so range-bound longer-term swings make sense. I think a short-term bounce for those of you who are a little short-term in your thinking probably makes sense as well.

Ready to trade the GBP/USD Forex analysis? Check out the best forex trading company in UK worth using.

Christopher Lewis is a technical analyst and market commentator at DailyForex with more than two decades of trading experience in Forex and other leveraged markets. Based in Columbus, Ohio, he specializes in chart-based analysis of major currency pairs, stock indices, commodities, and energy markets, focusing on clear support and resistance levels, trend structure, and risk management. Christopher produces daily written and video analysis for traders who rely on technical setups to navigate volatile market conditions

As seen on: Pairs Of Aces Podcast,The Trader Guy, FXEmpire

Source link

Go to Top