The main tag of Forex News Today Articles.
You can use the search box below to find what you need.
[wd_asp id=1]

23 08, 2026

EUR/USD Forecast: Political and fiscal uncertainty likely to maintain USD pressured

By |2026-08-23T04:48:01+03:00August 23, 2026|Forex News, News|0 Comments

The US Dollar (USD) collapsed this week, helping EUR/USD reach a fresh three-month high just above the 1.1700 mark, heading into the weekly close a handful of pips below that level but still firmly up.

Unexpected boost to US liquidity

The USD sell-off was triggered by the United States (US) Department of the Treasury, which announced on Wednesday that it will increase the government debt repurchase size by at least double. According to the press release, the current maximum size of $2 billion per operation will be at least $4 billion per operation, and the change will become effective September 9.

The announcement, while aimed at taming long-term bond yields, was also a signal that the Treasury is sensitive to yield volatility. The Treasury made its move after the 30-year bond yield climbed to 5.327% on Tuesday, its highest level since June 2007, immediately falling afterward by roughly 9 basis points.

There are, however, a couple of things that are worth understanding. First, buybacks are just a rearrangement of the maturity schedule, as the Treasury will have to issue fresh bonds to replace those that it plans to buy back. Government debt and fiscal deficits will remain the same.

Second, the decision has an impact on the Federal Reserve’s (Fed) future monetary policy decisions. Given that the US Treasury will have to issue more bills to finance the planned removal, this would likely ease financial conditions, which would increase the odds of a tighter monetary policy.

The future looks cloudy for the USD, with precious metals likely to outpace the Greenback in a risk-averse environment. Neither Treasury buybacks nor higher rates will address the root of the problem, which is the fiscal deficit.

In any case, that means further USD weakness in a risk-averse environment. The Middle East war is in a stalemate, and neither side is willing to budge. Oil prices have already picked up a bullish pace, and it won’t take much longer until energy prices become embedded inflation.

Financial war

Meanwhile, the Middle East war adds pressure on financial markets. Tensions between the US and Iran remain in place, with neither willing to give in to the other party´s demands. Fire exchange around the Strait of Hormuz remains paused, as well as talks aimed at ending the conflict.

Market participants are clearly seeing a long-standing conflict ahead, and generally speaking, they are getting used to the idea. However, Oil prices have been picking up lately, reviving inflation-related concerns and also hinting at central banks opting for tighter monetary policies.

US President Donald Trump, however, is unwilling to give up. Trump posted on Truth Social that the next move is choking Tehran’s economy by levying major penalties against any country that provides “any type of lifeline” to Iran, calling it an “Economic D-Day.”

His comments were reinforced by US Treasury Secretary Scott Bessent, who noted on Thursday that President Trump’s plan to crush Iran’s economy will likely negate the need for major US military operations against the Islamic Republic.

Bessent also had some comments on the Treasury buyback. He declared that the Treasury could increase bond buybacks beyond $4 billion, partly to signal that current yields do not reflect underlying economic fundamentals.

ECB Lagarde worried about Europe growth

European Central Bank (ECB) President Christine Lagarde hit the wires on Wednesday and expressed concerns about Europe facing an erosion of the conditions that have historically driven the continent’s growth at the World Economic Forum’s International Business Council in Geneva, Switzerland. Growth rested on three pillars, according to Lagarde: expanding global trade, manufacturing supported by access to cheap energy, and “a stable, rules-based global order, underpinned by a US security umbrella.”

“Today, that global order is under pressure. Geopolitical tensions are bringing critical dependencies and choke points into sharper focus, while Europe faces growing security threats on its doorstep,” Lagarde added. Her speech aimed to warn about Europe’s ability to compete in the age of AI, but her comments about the US did not pass unnoticed. War, physical or financial, poses a major risk and no one can ignore it.

Macroeconomic clues

The macroeconomic calendar had little to offer in the last few days. The Federal Open Market Committee (FOMC) released the Minutes of the July meeting, which brought nothing of substance. Officials remain concerned about inflation, and support rate hikes would be required if price pressures persist. A note of color was added by Chair Kevin Warsh, as he proposed reducing annual meetings from the current eight to six, to allow collecting more data in between meetings. This year’s schedule, however, remains the same.

Other than that, the focus was on the S&P Global and local banks’ Purchasing Managers’ Indexes (PMIs) released on Friday. The August flash estimates showed that Eurozone business activity expanded more than anticipated, as the Manufacturing PMI improved to 52.8 from 51.9 in July, against expectations of 51.8. Services output remained unchanged at 51.7, beating the expected slowdown to 51.5. Finally, the Composite PMI printed at 52.1, better than the expected 51.7 and the previous 52.

US PMIs also showed encouraging results, despite the Manufacturing PMI ticking lower to 53.2 from 53.9 in July. The Services index jumped to 56.8 from 54.6, pushing the Composite PMI to 56 from 54.5 in July, surpassing the expected 54. The figures help the USD recover some modest ground, though it is still sharply down for the week.

In the upcoming days, the macroeconomic calendar will include the German Q2 Gross Domestic Product (GDP) and the US July Personal Consumption Expenditures (PCE) Price Index. The US will also publish the second estimate of its Q2 GDP.

Additionally, investors will keep an eye on this year’s Jackson Hole Economic Policy Symposium, hosted by the Fed Bank of Kansas. This year’s theme is “Financial Innovation: Implications for Payments and Policy.” Policymakers from around the globe will discuss the main topic and may provide hints on the future of monetary policy.

Finally, the US Bureau of Labor Statistics (BLS) will release the annual Nonfarm Payrolls (NFP) Benchmark Revisions on Friday, a revision of labor statistics for the twelve months to March.

EUR/USD Technical Outlook:

From a technical perspective, EUR/USD is bullish. The pair extends its advance well above the short- and medium-term moving averages, with the shorter one clearly bullish. The 20-day Simple Moving Average (SMA) at 1.1542, the 100-day SMA at 1.1573 and the 200-day SMA at 1.1631 all sit below spot, reinforcing a supportive backdrop as price pushes further into higher ground. The outlook stays constructive, with the 14-day Relative Strength Index (RSI) consolidating at 71 and the 14-period Momentum indicator also holding above its midline, hinting that buyers still dominate in the near term even as conditions look stretched.

Chart Analysis EUR/USD

On the weekly chart, EUR/USD holds a constructive bullish bias and trades above bullish moving averages. The 20-week SMA stands at 1.1576, while the 100-week SMA is at 1.1326 and the 200-week SMA is at 1.1059, reinforcing a broader underlying support structure. Weekly momentum is building up, as technical indicators head firmly north after crossing their midlines into positive ground.

On the downside, initial support emerges at the 200-day SMA around 1.1631, followed by the 100-day SMA and the 20-week SMA, which converge in the 1.1570 price zone, forming a strong dynamic support area. Further slides could see EUR/USD dropping towards 1.1470 before relevant buying interest reappears. Recent highs around 1.1710 establish the first resistance area ahead of the 1.1800 mark. Additional gains should lead to a test of the April monthly peak at 1.1850.

(The technical analysis of this story was written with the help of an AI tool. Know more.)

Risk sentiment FAQs

In the world of financial jargon the two widely used terms “risk-on” and “risk off” refer to the level of risk that investors are willing to stomach during the period referenced. In a “risk-on” market, investors are optimistic about the future and more willing to buy risky assets. In a “risk-off” market investors start to ‘play it safe’ because they are worried about the future, and therefore buy less risky assets that are more certain of bringing a return, even if it is relatively modest.

Typically, during periods of “risk-on”, stock markets will rise, most commodities – except Gold – will also gain in value, since they benefit from a positive growth outlook. The currencies of nations that are heavy commodity exporters strengthen because of increased demand, and Cryptocurrencies rise. In a “risk-off” market, Bonds go up – especially major government Bonds – Gold shines, and safe-haven currencies such as the Japanese Yen, Swiss Franc and US Dollar all benefit.

The Australian Dollar (AUD), the Canadian Dollar (CAD), the New Zealand Dollar (NZD) and minor FX like the Ruble (RUB) and the South African Rand (ZAR), all tend to rise in markets that are “risk-on”. This is because the economies of these currencies are heavily reliant on commodity exports for growth, and commodities tend to rise in price during risk-on periods. This is because investors foresee greater demand for raw materials in the future due to heightened economic activity.

The major currencies that tend to rise during periods of “risk-off” are the US Dollar (USD), the Japanese Yen (JPY) and the Swiss Franc (CHF). The US Dollar, because it is the world’s reserve currency, and because in times of crisis investors buy US government debt, which is seen as safe because the largest economy in the world is unlikely to default. The Yen, from increased demand for Japanese government bonds, because a high proportion are held by domestic investors who are unlikely to dump them – even in a crisis. The Swiss Franc, because strict Swiss banking laws offer investors enhanced capital protection.

Source link

23 08, 2026

TMGM: CFD Broker | Award-Winning Global Online CFD Trading Platform

By |2026-08-23T00:47:24+03:00August 23, 2026|Forex News, News|0 Comments

Broker of
The Year

Followme
Hong Kong Summit

image

Best Multi Asset
Broker APAC

Brokersview
Fastbull Awards

image

Most Innovative
Sports
Sponsorship

Forex Sports Awards

image

SkyLine
Guide 2024
Award

WikiFX
SkyLine Guide
2024

image

Best Forex
Trading Platform

IFINEXPO

image

Most Trusted
Forex Broker

Wiki Finance Expo
Bangkok 2024

image

First Place
in Education
Courses

Forex Brokers
Annual Awards

image

Best Trading
Experience in the
Asia-Pacific Region

Ultimate
Fintech Awards

image

Best Broker
in Vietnam

Traders Fair
& Awards

image

Best Trading
Service Award
in Asia

Traders Fair
& Awards

image

Significant
Contribution to
Community 2022

Hurun

image

Silver Award in the
Financial Services
Video Category

The Telly Awards

image

Top 10 Most Popular
Traders of the Year
2022

Follow Me
Annual Awards

image

Fastest Growing
Broker

Asia Trading Expo

image

Best Growing
Broker

Follow Me
Annual Awards

image

Best Trading
Environment Award

Financial Technology
Conference

image

Best Trading
Environment
Platform Provider

UK Forex Awards

image

Integrity
Model Enterprise

China Enterprise
Strategic Alliance

image

Best Trading
Environment
Platform Provider

International
Financial World
Forum Malaysia

image

Best Forex
Broker-Customer
Service

China Australia
Media Group

image

Most Trusted
Broker of the Year

Sina

image

Fastest Growing
Forex Broker

UK Forex Award

image

Outstanding Broker
in Asia Pacific

Best Partner
Program Asia

Source link

22 08, 2026

EUR/GBP Forecast: Neutral RSI Points to Further Consolidation | Forex News Technical Analysis

By |2026-08-22T20:46:23+03:00August 22, 2026|Forex News, News|0 Comments

BitcoinWorld

EUR/GBP Forecast: Neutral RSI Points to Further Consolidation

The EUR/GBP currency pair is showing signs of a pause in its recent trend, as the Relative Strength Index (RSI) on the daily chart has moved to a neutral reading, suggesting that the pair is likely to consolidate in the near term.

This technical signal indicates that buying and selling momentum are currently balanced, following a period of directional movement. For traders, this often points to a range-bound market where the currency pair may trade sideways until a new catalyst emerges.

What Does a Neutral RSI Signal for EUR/GBP?

A neutral RSI, typically in the 40-60 range, signifies that the market is not overbought or oversold. This lack of directional momentum often precedes a period of consolidation. In the context of EUR/GBP, this means that neither the Euro nor the Pound has a clear technical advantage at the moment.

This technical setup often follows a significant move, allowing the market to ‘breathe’ before the next leg. For investors, a neutral RSI can be a signal to watch for breakouts from established support and resistance levels rather than expecting immediate trend continuation. The current setup suggests that the recent price action is digesting, with neither bulls nor bears in full control.

Key Levels and Market Context

As of this analysis, the pair is trading within a defined range, with traders closely monitoring key technical levels. A break above the recent swing high could signal renewed bullish momentum, while a drop below the current support zone might open the door for further downside. These levels are critical for determining the next significant move.

The consolidation comes amid a complex macroeconomic environment for both the Eurozone and the UK. Divergent monetary policy expectations between the European Central Bank (ECB) and the Bank of England (BoE) remain a core driver for the pair. Any shifts in economic data releases, such as inflation or GDP figures, could quickly alter the technical picture and inject new volatility into the market.

Implications for Traders and Investors

For traders, the current neutral RSI suggests a strategy of range trading or waiting for a clear breakout. The lack of momentum means that chasing price moves could be risky. Instead, focusing on well-defined support and resistance levels offers a more structured approach to navigating this phase.

For longer-term investors, this consolidation phase is a critical period to watch. It reflects the market’s uncertainty about the future path of interest rates in both economies. The resolution of this consolidation will likely set the tone for the pair’s direction in the coming weeks, making it an important development for anyone with exposure to the GBP or EUR.

Conclusion

The neutral RSI reading on the EUR/GBP daily chart indicates a period of consolidation is likely. This technical signal points to balanced momentum, suggesting that the pair may trade within a range until new economic data or policy signals provide a clearer direction. Traders should monitor key support and resistance levels for potential breakout opportunities.

FAQs

Q1: What is the RSI indicator and how is it used in forex trading?
The Relative Strength Index (RSI) is a momentum oscillator that measures the speed and change of price movements. It is used to identify overbought or oversold conditions in a market. A reading above 70 typically indicates overbought conditions, while a reading below 30 suggests oversold conditions. A neutral reading, usually between 40 and 60, indicates a lack of strong momentum and often precedes consolidation.

Q2: What does ‘consolidation’ mean for a currency pair like EUR/GBP?
Consolidation refers to a period where an asset’s price trades within a relatively narrow range, pausing its broader trend. It occurs when supply and demand are roughly balanced. For a currency pair, this often results in a sideways movement on the chart, as buyers and sellers are equally matched until a new catalyst forces a breakout.

Q3: What factors could break the current EUR/GBP consolidation?
Key factors that could break the consolidation include new economic data releases (like inflation or employment figures), shifts in monetary policy expectations from the European Central Bank or the Bank of England, geopolitical events, or significant changes in market risk sentiment. Any of these could provide the momentum needed for a decisive move beyond the current trading range.

This post EUR/GBP Forecast: Neutral RSI Points to Further Consolidation first appeared on BitcoinWorld.

Source link

22 08, 2026

Pound-to-Dollar Forecast: GBP/USD Just Tested The Level That Could Unlock 1.41

By |2026-08-22T16:45:43+03:00August 22, 2026|Forex News, News|0 Comments

Scotiabank’s conditional GBP/USD objective sits above consensus after Pound Sterling tests the 1.3650/60 resistance area

The Pound to US Dollar (GBP/USD) exchange rate has tested the mid-1.36s, putting Scotiabank’s conditional route towards 1.41 into focus.

ERUK market data show GBP/USD reached an intraday high near 1.3675 before slipping back towards 1.3645, so the sustained push required by Scotiabank has not yet occurred.

GBP/USD one-month exchange rate chart

The bank’s scenario depends on a durable advance beyond the 1.3650/60 area, which has contained Sterling near its early-May peak.

It is a notably bullish technical case: ERUK’s Research Currency Forecast Sentiment Survey places the median fourth-quarter forecast at 1.3446 and the top of the surveyed range at 1.40.

GBP/USD forecast consensus range chart

Scotiabank analysts noted the recent move reflected broad US Dollar weakness more than a sudden improvement in UK fundamentals.

Nevertheless, the bank judged the technical structure to be firmly positive after GBP/USD twice defended the 1.3150 area during April and June.

The strategists said “a sustained push above 1.3650/60 implies potential for an extension towards the 1.41 zone over the balance of the year”.

That makes 1.41 a possible extension rather than a guaranteed year-end destination, with Sterling still needing to establish former resistance as support.

1.3848 as the intermediate test

Sucden Financial analysts highlighted 1.3650/60 as the breakout zone and said the next broader objective was 1.3848.

Sucden described the set-up as one “with the January high around 1.3848 representing a broader upside target”.

The level therefore offers an intermediate test of whether Scotiabank’s larger scenario is gaining traction.

The two institutions reach a similar bullish conclusion but on different horizons.

Sucden’s 1.3848 is the first substantial obstacle above the trigger, while Scotiabank’s conditional 1.41 objective extends through the balance of 2026.

Sucden placed initial support near 1.3600 and a deeper cushion around 1.3500, where the 20-day average and 30-day volume-weighted average price reinforce the technical floor.

A daily close below 1.3600 would weaken the breakout case and expose 1.3500, while a sustained hold above 1.3650/60 would strengthen the route towards 1.3848 and 1.41.

Exchange Rates UK Research

Our currency coverage draws on live market data, official economic releases and published bank research.

Source link

22 08, 2026

USD/JPY Forecast: 20-Day EMA Caps Recovery as Yen Strength Persists | Forex News Technical Analysis

By |2026-08-22T12:44:20+03:00August 22, 2026|Forex News, News|0 Comments

BitcoinWorld

USD/JPY Forecast: 20-Day EMA Caps Recovery as Yen Strength Persists

The USD/JPY pair continues to face stiff resistance at the 20-day exponential moving average (EMA), a level that has repeatedly capped upside attempts over the past sessions, as of the latest trading data. Despite intermittent dollar bounces, the yen remains supported by growing expectations of a policy shift from the Bank of Japan, keeping the pair’s recovery momentum in check.

Why the 20-Day EMA Matters for USD/JPY

The 20-day EMA is a widely watched short-term trend indicator. In the current USD/JPY setup, it has acted as a dynamic ceiling, preventing the pair from extending any meaningful rebound. This technical barrier reflects a broader sentiment shift: traders are reluctant to push the dollar higher against the yen while the Bank of Japan signals a potential exit from its ultra-loose monetary policy.

As of this week, the pair has tested the 20-day EMA multiple times but has failed to close above it, suggesting that sellers are defending the level. A sustained break above this moving average could open the door for a move toward the next resistance zone, but until then, the bias remains tilted to the downside.

Fundamental Drivers Behind Yen Strength

The yen’s resilience is not just a technical phenomenon. Market participants are increasingly pricing in a possible policy normalization by the Bank of Japan, especially after recent comments from officials hinting at a shift away from negative interest rates. This has narrowed the yield differential between U.S. and Japanese bonds, reducing the dollar’s appeal.

Additionally, global risk sentiment has been fragile, with investors seeking safe-haven assets. The yen, despite its low yield, often benefits during periods of uncertainty. These fundamental factors align with the technical picture, creating a coherent narrative for the pair’s inability to rally.

What This Means for Traders

For traders, the 20-day EMA serves as a key level to watch. A daily close above it could signal a short-term bullish reversal, while a rejection from the level would confirm continued bearish pressure. Support levels below the current price are seen at recent swing lows, and a break below those could accelerate the decline.

The broader implications extend beyond intraday trading. If the Bank of Japan indeed tightens policy, the yen could strengthen further, potentially pushing USD/JPY to levels not seen in months. This would have ripple effects on Japanese exporters and global carry trades, making the pair a focal point for forex markets.

Conclusion

USD/JPY remains constrained by the 20-day EMA, with the technical barrier aligning with fundamental headwinds from Bank of Japan policy expectations. The pair’s direction hinges on whether buyers can overcome this resistance, but the prevailing sentiment suggests a cautious approach. As always, traders should monitor central bank communications and key economic data for further clues.

FAQs

Q1: What is the 20-day EMA and why is it important for USD/JPY?
The 20-day EMA is a moving average that smooths price data over the past 20 days, giving more weight to recent prices. It is a key technical indicator used by traders to gauge short-term trends. In USD/JPY, it has recently acted as resistance, meaning the pair has struggled to rise above it, indicating bearish pressure.

Q2: How could Bank of Japan policy changes affect USD/JPY?
If the Bank of Japan shifts away from its ultra-loose monetary policy, it would likely strengthen the yen as interest rate differentials narrow. This would make the dollar less attractive relative to the yen, potentially pushing USD/JPY lower.

Q3: What should traders watch for a potential breakout?
Traders should watch for a daily close above the 20-day EMA, which could signal a bullish reversal. Additionally, monitoring U.S. economic data and Federal Reserve commentary, as well as any BoJ statements, will provide clues about the pair’s next move.

This post USD/JPY Forecast: 20-Day EMA Caps Recovery as Yen Strength Persists first appeared on BitcoinWorld.

Source link

22 08, 2026

Pound to Dollar Forecast: US Bond Concerns Drive GBP Above 1.3670

By |2026-08-22T04:42:26+03:00August 22, 2026|Forex News, News|0 Comments


– Written by

The Pound to Dollar exchange rate (GBP/USD) surged to a six-month high of 1.3675 as persistent concerns over US Treasury intervention and the outlook for long-term bond yields kept the Dollar under heavy pressure. Stronger-than-expected UK services data added to Sterling support, although the pair surrendered part of its advance after breaking above the May highs.

GBP/USD Forecasts: Six-Month High

The Pound to Dollar (GBP/USD) exchange rate extended its advance on Friday, reaching fresh six-month highs before giving back part of the move later in the session.

GBP/USD climbed as high as 1.3675, its strongest level since February 11, before retreating towards 1.3645.

The Dollar remained under pressure amid concerns that US Treasury efforts to suppress long-term bond yields could ultimately undermine confidence in the currency.

The Dollar index remained close to three-month lows, leaving Sterling on course for a fourth consecutive weekly gain against the US currency.

According to MUFG; “There appears to now be more avenues opening for US dollar weakness ahead rather than dollar strength.”

Save on Your GBP/USD Transfer

Get better rates and lower fees on your next international money transfer.
Compare TorFX with top UK banks in seconds and see how much you could save.


Compare the Best GBP/USD Rates »

The Pound also benefited from continued expectations that the Bank of England could still raise interest rates before year-end, despite economists generally expecting policy to remain unchanged.

UoB had identified resistance just above 1.3650, with a sustained break potentially strengthening the case for a move towards the 1.3800 region.

That resistance was breached during Friday’s session, although GBP/USD was unable to maintain the move above 1.3670.

Friday’s UK business surveys provided further evidence that the economy retained momentum during the third quarter.

The S&P Global services PMI increased to 52.8 in August from 52.1 previously, reaching a six-month high and comfortably beating expectations for a slowdown.

The stronger services performance helped offset a modest easing in the manufacturing PMI to 51.5.

Business optimism in the services sector also rose to a seven-month high, while new orders improved.

The figures followed stronger-than-expected second-quarter GDP data and reinforced expectations that the UK economy could expand by around 0.3% during the third quarter.

There were less encouraging signals elsewhere.

Retail sales volumes excluding fuel fell 0.9% in July after a strong June performance, while government borrowing figures showed an unexpected budget deficit.

Nevertheless, the broader UK data flow has remained sufficiently resilient to keep expectations of another Bank of England rate increase alive.

US Treasury Policy Keeps Dollar under Pressure

The US Treasury’s decision to increase purchases of longer-dated bonds remained an important driver for currency markets.

The Treasury announced on Wednesday that it would at least double the size of buybacks of longer-dated securities in an attempt to improve liquidity and contain the surge in long-term yields.

Danske Bank commented; “The increased reliance on short-end issuance links the government’s financing costs more closely to the Fed’s monetary policy.”

The bank also suggested that renewed concern about Federal Reserve independence may have contributed to broad Dollar weakness.

ING commented; “Yesterday’s intervention in the Treasury market suggests the recent rise in longer-dated yields has touched a raw nerve.”

It added that a more activist Treasury reduced one potential risk to financial markets and was “slightly dollar negative”.

MUFG also warned that the policy could damage confidence in US assets.

The bank commented; “Even if the Treasury buy-back plan does contain yields, the US dollar now remains more vulnerable to the downside on the fact that yields are potentially lower.”

In practice, long-term Treasury yields have already started rising again despite the buyback announcement, suggesting investors remain concerned about the US fiscal outlook.

The 30-year yield had reached its highest level since 2007 earlier in the week, driven by concerns over debt sustainability, inflation and heavy issuance.

Jackson Hole Takes on Added Importance

MUFG also highlighted the implications for Federal Reserve policy.

The bank commented; “What this buyback announcement does mean is that the Jackson Hole speech next week by Fed Chair Warsh has now become more important.”

Fed Chair Kevin Warsh will face a difficult balancing act.

A strongly hawkish message could trigger another sell-off in Treasuries and undermine the Treasury’s attempts to stabilise long-term yields.

Conversely, a softer stance risks reinforcing concerns that monetary policy is becoming too accommodating or influenced by the administration’s preference for lower borrowing costs.

The minutes from July’s Federal Reserve meeting confirmed that policymakers had become more concerned about inflation, with several officials prepared to support another rate increase if price pressures failed to ease.

Capital Economics nevertheless commented; “The minutes of the Fed’s July meeting confirmed that the rate-setting committee had become more hawkish since the June meeting but, with the inflation, labour market and activity data since then all on the soft side, there is little to suggest that interest rate hikes are imminent.”

Markets currently place roughly a one-third probability on a September Fed increase.

Near-Term GBP/USD Forecast: 1.3675 Break Opens Route towards 1.38

GBP/USD’s move to 1.3675 has taken the pair beyond the May highs and strengthened the short-term technical picture.

A sustained break above the 1.3670-1.3680 area would bring 1.3700 into immediate focus, followed by the 1.3800 region highlighted by UoB.

Sterling could receive further support if resilient UK data keeps Bank of England tightening expectations alive while investors continue to scale back expectations for Federal Reserve action.

The Dollar remains vulnerable, however, for reasons that extend beyond interest-rate differentials.

Treasury intervention has revived wider concerns over the US fiscal outlook and the risk that attempts to suppress bond yields shift pressure from Treasuries onto the currency instead.

On the downside, 1.3600 should now provide initial support for GBP/USD.

A sustained retreat below this level would weaken the immediate bullish structure and bring the 1.3550 area back into focus.

For now, the combination of resilient UK economic data and persistent unease surrounding US fiscal and bond-market policy leaves Sterling with a firm underlying bias against the Dollar.

Like this piece? Please share with your friends and colleagues:


International Money Transfer? Ask our resident FX expert a money transfer question or try John’s new, free, no-obligation personal service! ,where he helps every step of the way,
ensuring you get the best exchange rates on your currency requirements.

TAGS: Pound Dollar Forecasts

Source link

22 08, 2026

USD/JPY: Elliott Wave Analysis and Forecast for 21.08.26–28.08.26

By |2026-08-22T00:41:33+03:00August 22, 2026|Forex News, News|0 Comments

The article covers the following subjects:

Major Takeaways

  • Main scenario: Once the correction has been completed, consider short positions below the level of 160.52 with a target of 151.76–148.92. A sell signal: the correction ends and the price holds below 160.52. Stop Loss: above 161.10, Take Profit: 151.76–148.92.
  • Alternative scenario: Breakout and consolidation above the level of 160.52 will allow the pair to continue rising to the levels of 163.90–166.50. A buy signal: the level of 160.52 is broken to the upside. Stop Loss: below 159.90, Take Profit: 163.90–166.50.

Main Scenario

Consider short positions below 160.52 with a target of 151.76–148.92 once the correction is completed.

Alternative Scenario

Breakout and consolidation above 160.52 will allow the pair to continue rising to the levels of 163.90–166.50.

Analysis

On the weekly time frame, an ascending third wave of larger degree 3 has formed, a downward correction has been completed as the fourth wave 4, and the fifth wave 5 is developing. Apparently, the first wave of smaller degree (1) of 5 has formed and a bearish correction (2) of 5 is developing on the daily chart. On the H4 time frame, wave A of (2) is developing, within which wave i of A has presumably been completed and a local correction ii of A is nearing completion. If the presumption is correct, USD/JPY will continue to decline to 151.76–148.92 after the correction ends. The level of 160.52 is critical in this scenario as a breakout above it will enable the pair to continue rising to the levels of 163.90–166.50.


This forecast is based on the Elliott Wave Theory. When developing trading strategies, it is essential to consider fundamental factors, as the market situation can change at any time. 

Price chart of USDJPY in real time mode

The content of this article reflects the author’s opinion and does not necessarily reflect the official position of LiteFinance broker. The material published on this page is provided for informational purposes only and should not be considered as the provision of investment advice for the purposes of Directive 2014/65/EU.


According to copyright law, this article is considered intellectual property, which includes a prohibition on copying and distributing it without consent.

Rate this article:

{{value}} ( {{count}} {{title}} )


Source link

21 08, 2026

EUR/USD Forecast: Political and fiscal uncertainty likely to maintain USD pressured

By |2026-08-21T20:40:52+03:00August 21, 2026|Forex News, News|0 Comments

The US Dollar (USD) collapsed this week, helping EUR/USD reach a fresh three-month high just above the 1.1700 mark, heading into the weekly close a handful of pips below that level but still firmly up.

Unexpected boost to US liquidity

The USD sell-off was triggered by the United States (US) Department of the Treasury, which announced on Wednesday that it will increase the government debt repurchase size by at least double. According to the press release, the current maximum size of $2 billion per operation will be at least $4 billion per operation, and the change will become effective September 9.

The announcement, while aimed at taming long-term bond yields, was also a signal that the Treasury is sensitive to yield volatility. The Treasury made its move after the 30-year bond yield climbed to 5.327% on Tuesday, its highest level since June 2007, immediately falling afterward by roughly 9 basis points.

There are, however, a couple of things that are worth understanding. First, buybacks are just a rearrangement of the maturity schedule, as the Treasury will have to issue fresh bonds to replace those that it plans to buy back. Government debt and fiscal deficits will remain the same.

Second, the decision has an impact on the Federal Reserve’s (Fed) future monetary policy decisions. Given that the US Treasury will have to issue more bills to finance the planned removal, this would likely ease financial conditions, which would increase the odds of a tighter monetary policy.

The future looks cloudy for the USD, with precious metals likely to outpace the Greenback in a risk-averse environment. Neither Treasury buybacks nor higher rates will address the root of the problem, which is the fiscal deficit.

In any case, that means further USD weakness in a risk-averse environment. The Middle East war is in a stalemate, and neither side is willing to budge. Oil prices have already picked up a bullish pace, and it won’t take much longer until energy prices become embedded inflation.

Financial war

Meanwhile, the Middle East war adds pressure on financial markets. Tensions between the US and Iran remain in place, with neither willing to give in to the other party´s demands. Fire exchange around the Strait of Hormuz remains paused, as well as talks aimed at ending the conflict.

Market participants are clearly seeing a long-standing conflict ahead, and generally speaking, they are getting used to the idea. However, Oil prices have been picking up lately, reviving inflation-related concerns and also hinting at central banks opting for tighter monetary policies.

US President Donald Trump, however, is unwilling to give up. Trump posted on Truth Social that the next move is choking Tehran’s economy by levying major penalties against any country that provides “any type of lifeline” to Iran, calling it an “Economic D-Day.”

His comments were reinforced by US Treasury Secretary Scott Bessent, who noted on Thursday that President Trump’s plan to crush Iran’s economy will likely negate the need for major US military operations against the Islamic Republic.

Bessent also had some comments on the Treasury buyback. He declared that the Treasury could increase bond buybacks beyond $4 billion, partly to signal that current yields do not reflect underlying economic fundamentals.

ECB Lagarde worried about Europe growth

European Central Bank (ECB) President Christine Lagarde hit the wires on Wednesday and expressed concerns about Europe facing an erosion of the conditions that have historically driven the continent’s growth at the World Economic Forum’s International Business Council in Geneva, Switzerland. Growth rested on three pillars, according to Lagarde: expanding global trade, manufacturing supported by access to cheap energy, and “a stable, rules-based global order, underpinned by a US security umbrella.”

“Today, that global order is under pressure. Geopolitical tensions are bringing critical dependencies and choke points into sharper focus, while Europe faces growing security threats on its doorstep,” Lagarde added. Her speech aimed to warn about Europe’s ability to compete in the age of AI, but her comments about the US did not pass unnoticed. War, physical or financial, poses a major risk and no one can ignore it.

Macroeconomic clues

The macroeconomic calendar had little to offer in the last few days. The Federal Open Market Committee (FOMC) released the Minutes of the July meeting, which brought nothing of substance. Officials remain concerned about inflation, and support rate hikes would be required if price pressures persist. A note of color was added by Chair Kevin Warsh, as he proposed reducing annual meetings from the current eight to six, to allow collecting more data in between meetings. This year’s schedule, however, remains the same.

Other than that, the focus was on the S&P Global and local banks’ Purchasing Managers’ Indexes (PMIs) released on Friday. The August flash estimates showed that Eurozone business activity expanded more than anticipated, as the Manufacturing PMI improved to 52.8 from 51.9 in July, against expectations of 51.8. Services output remained unchanged at 51.7, beating the expected slowdown to 51.5. Finally, the Composite PMI printed at 52.1, better than the expected 51.7 and the previous 52.

US PMIs also showed encouraging results, despite the Manufacturing PMI ticking lower to 53.2 from 53.9 in July. The Services index jumped to 56.8 from 54.6, pushing the Composite PMI to 56 from 54.5 in July, surpassing the expected 54. The figures help the USD recover some modest ground, though it is still sharply down for the week.

In the upcoming days, the macroeconomic calendar will include the German Q2 Gross Domestic Product (GDP) and the US July Personal Consumption Expenditures (PCE) Price Index. The US will also publish the second estimate of its Q2 GDP.

Additionally, investors will keep an eye on this year’s Jackson Hole Economic Policy Symposium, hosted by the Fed Bank of Kansas. This year’s theme is “Financial Innovation: Implications for Payments and Policy.” Policymakers from around the globe will discuss the main topic and may provide hints on the future of monetary policy.

Finally, the US Bureau of Labor Statistics (BLS) will release the annual Nonfarm Payrolls (NFP) Benchmark Revisions on Friday, a revision of labor statistics for the twelve months to March.

EUR/USD Technical Outlook:

From a technical perspective, EUR/USD is bullish. The pair extends its advance well above the short- and medium-term moving averages, with the shorter one clearly bullish. The 20-day Simple Moving Average (SMA) at 1.1542, the 100-day SMA at 1.1573 and the 200-day SMA at 1.1631 all sit below spot, reinforcing a supportive backdrop as price pushes further into higher ground. The outlook stays constructive, with the 14-day Relative Strength Index (RSI) consolidating at 71 and the 14-period Momentum indicator also holding above its midline, hinting that buyers still dominate in the near term even as conditions look stretched.

Chart Analysis EUR/USD

On the weekly chart, EUR/USD holds a constructive bullish bias and trades above bullish moving averages. The 20-week SMA stands at 1.1576, while the 100-week SMA is at 1.1326 and the 200-week SMA is at 1.1059, reinforcing a broader underlying support structure. Weekly momentum is building up, as technical indicators head firmly north after crossing their midlines into positive ground.

On the downside, initial support emerges at the 200-day SMA around 1.1631, followed by the 100-day SMA and the 20-week SMA, which converge in the 1.1570 price zone, forming a strong dynamic support area. Further slides could see EUR/USD dropping towards 1.1470 before relevant buying interest reappears. Recent highs around 1.1710 establish the first resistance area ahead of the 1.1800 mark. Additional gains should lead to a test of the April monthly peak at 1.1850.

(The technical analysis of this story was written with the help of an AI tool. Know more.)

Risk sentiment FAQs

In the world of financial jargon the two widely used terms “risk-on” and “risk off” refer to the level of risk that investors are willing to stomach during the period referenced. In a “risk-on” market, investors are optimistic about the future and more willing to buy risky assets. In a “risk-off” market investors start to ‘play it safe’ because they are worried about the future, and therefore buy less risky assets that are more certain of bringing a return, even if it is relatively modest.

Typically, during periods of “risk-on”, stock markets will rise, most commodities – except Gold – will also gain in value, since they benefit from a positive growth outlook. The currencies of nations that are heavy commodity exporters strengthen because of increased demand, and Cryptocurrencies rise. In a “risk-off” market, Bonds go up – especially major government Bonds – Gold shines, and safe-haven currencies such as the Japanese Yen, Swiss Franc and US Dollar all benefit.

The Australian Dollar (AUD), the Canadian Dollar (CAD), the New Zealand Dollar (NZD) and minor FX like the Ruble (RUB) and the South African Rand (ZAR), all tend to rise in markets that are “risk-on”. This is because the economies of these currencies are heavily reliant on commodity exports for growth, and commodities tend to rise in price during risk-on periods. This is because investors foresee greater demand for raw materials in the future due to heightened economic activity.

The major currencies that tend to rise during periods of “risk-off” are the US Dollar (USD), the Japanese Yen (JPY) and the Swiss Franc (CHF). The US Dollar, because it is the world’s reserve currency, and because in times of crisis investors buy US government debt, which is seen as safe because the largest economy in the world is unlikely to default. The Yen, from increased demand for Japanese government bonds, because a high proportion are held by domestic investors who are unlikely to dump them – even in a crisis. The Swiss Franc, because strict Swiss banking laws offer investors enhanced capital protection.

Source link

21 08, 2026

The EURJPY achieves the positive targets– Forecast today – 21-8-2026

By |2026-08-21T16:39:28+03:00August 21, 2026|Forex News, News|0 Comments


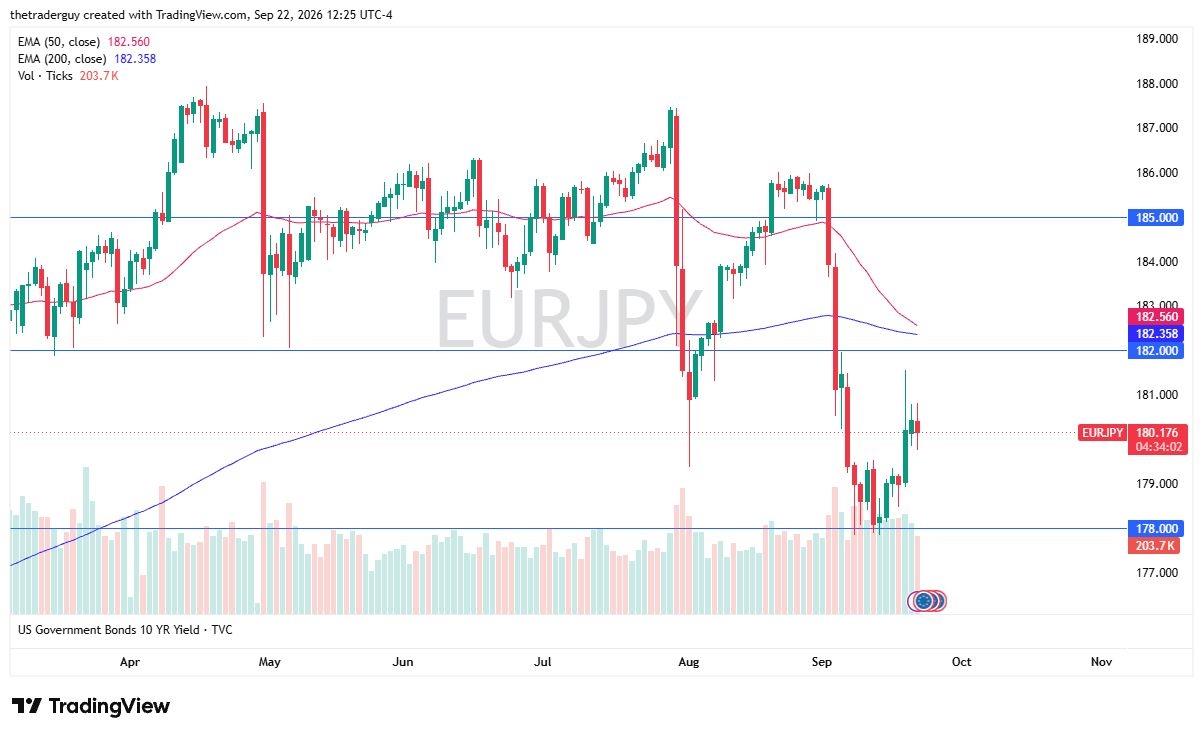
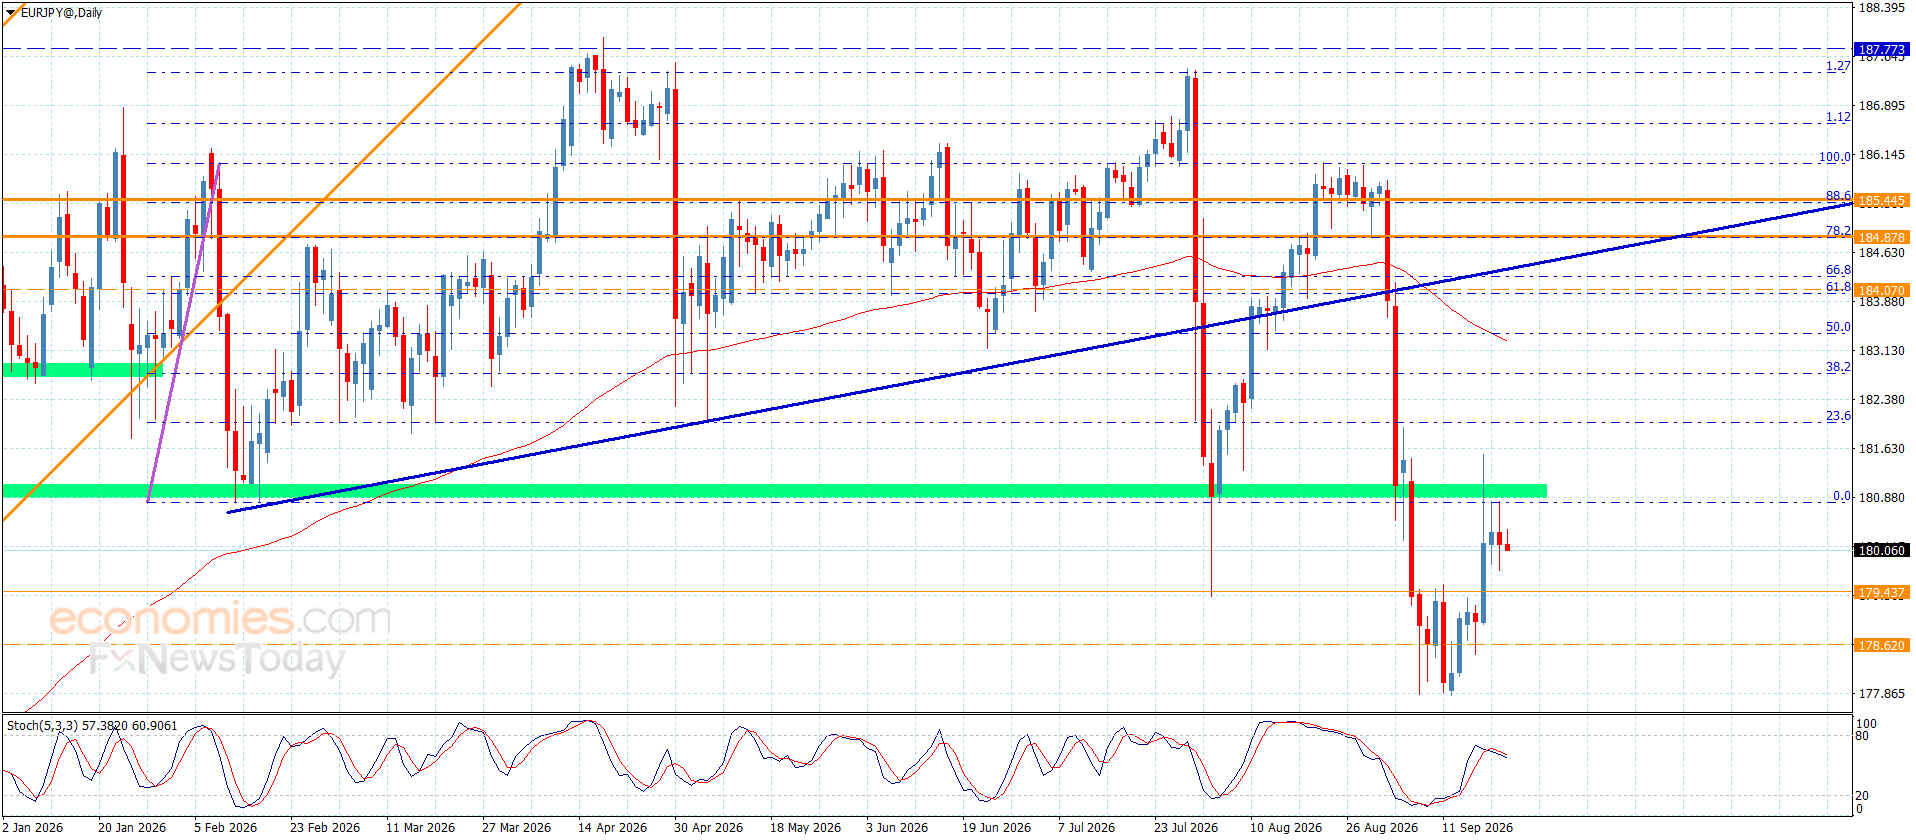
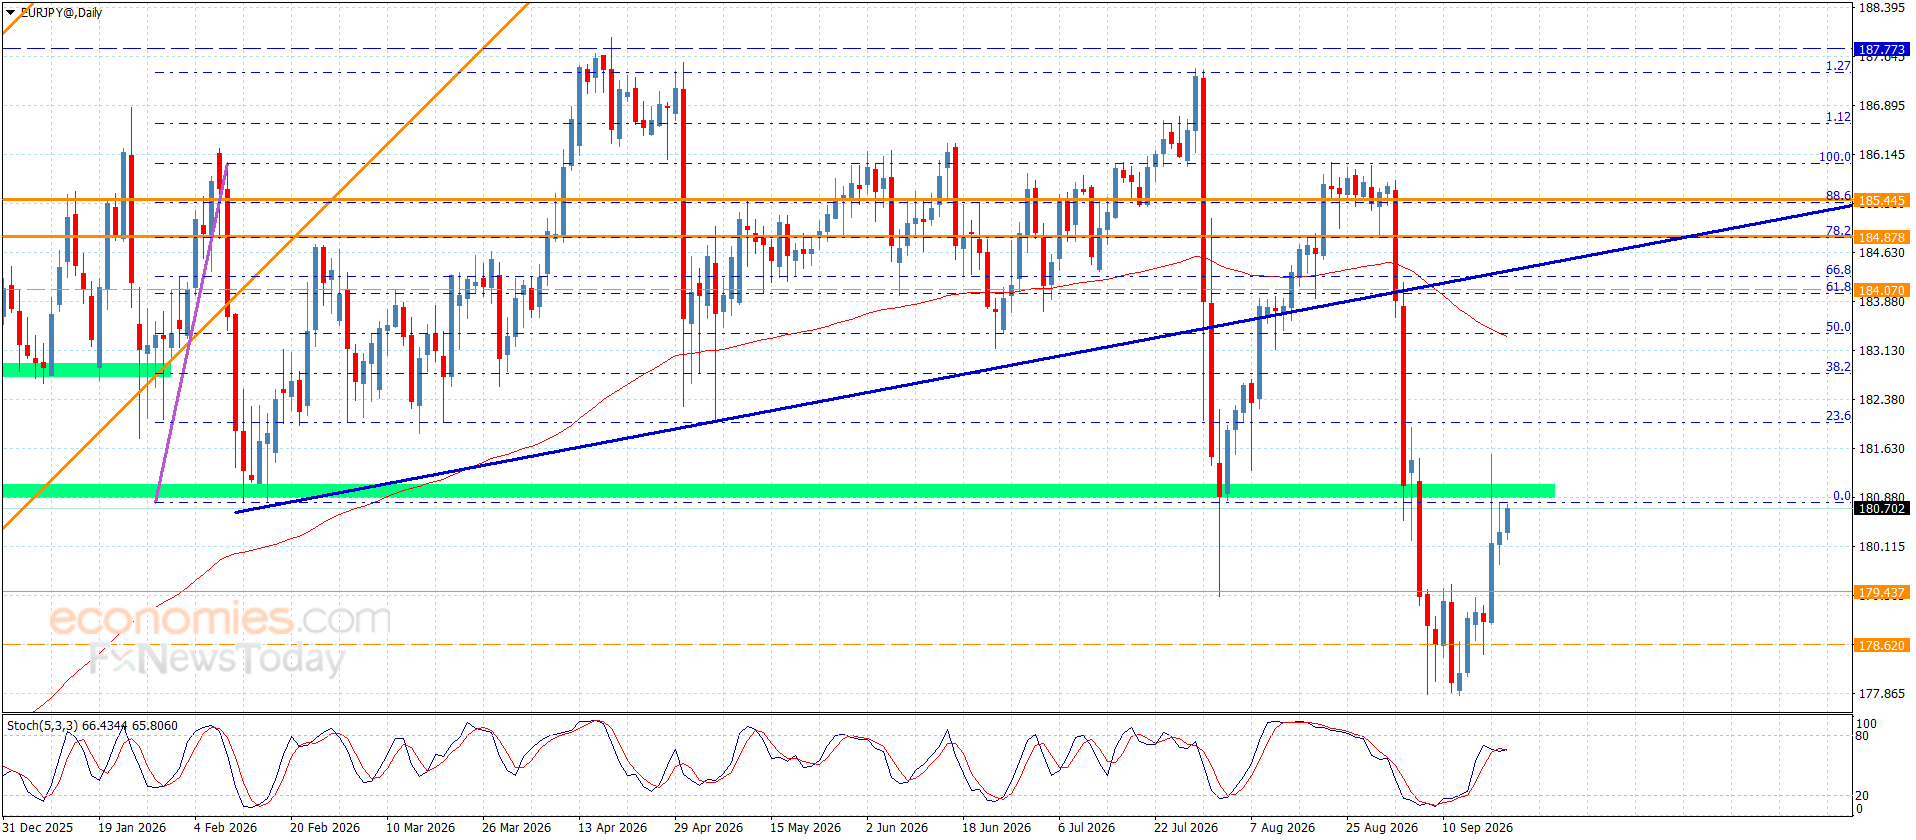
The EURJPY pair managed to confirm breaching the barrier at 184.90, reinforcing the bullish trend, to notice recording the suggested targets in the previous report by reaching 186.00 level.


The price might be forced to provide some sideways trading due to stochastic attempt to exit the overbought levels, however, it will not affect the main bullish trend that depends on the stability of the main support at 193.15, while breaching 186.00 level will provide a chance for recording extra gains that might begin at 186.55.


The expected trading range for today is between 185.20 and 186.25


Trend forecast: Fluctuated within the bullish trend


Source link

Go to Top