The main tag of Gold Price Articles.
You can use the search box below to find what you need.
[wd_asp id=1]
The main tag of Gold Price Articles.
You can use the search box below to find what you need.
[wd_asp id=1]
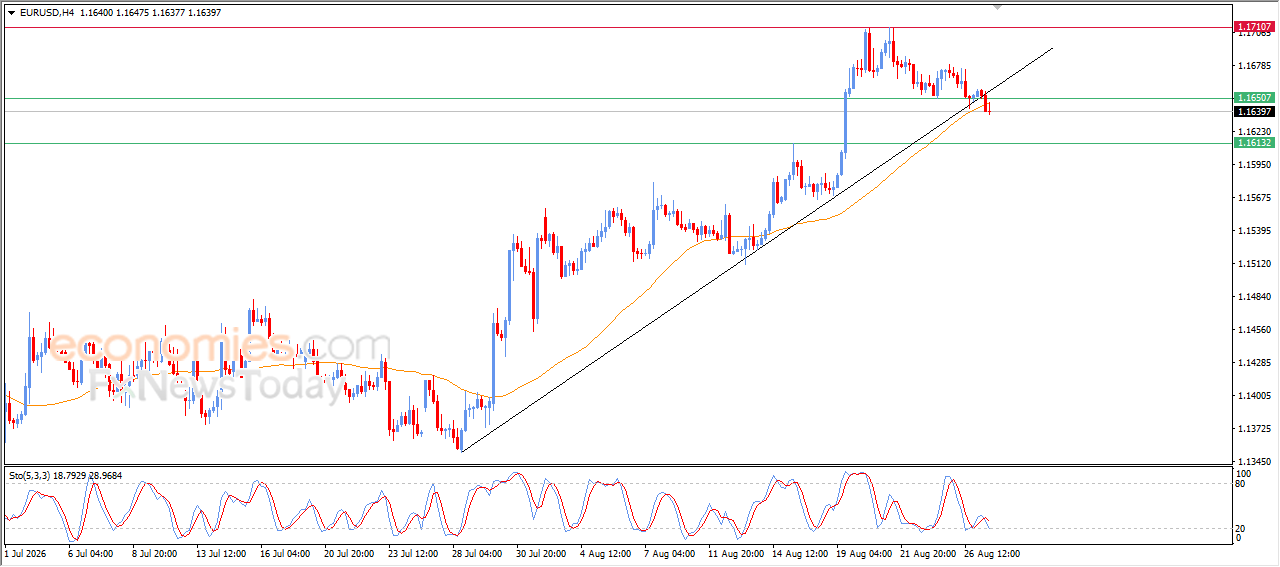
The EURUSD pair declined during its latest intraday trading, to break a main bullish trend on the short-term basis, which put it under negative pressure, which led it to surpass EMA50’s support, especially with the emergence of the negative signals from the relative strength indicators, after offloading some of its oversold conditions, opening the way towards recording more losses in the near period.
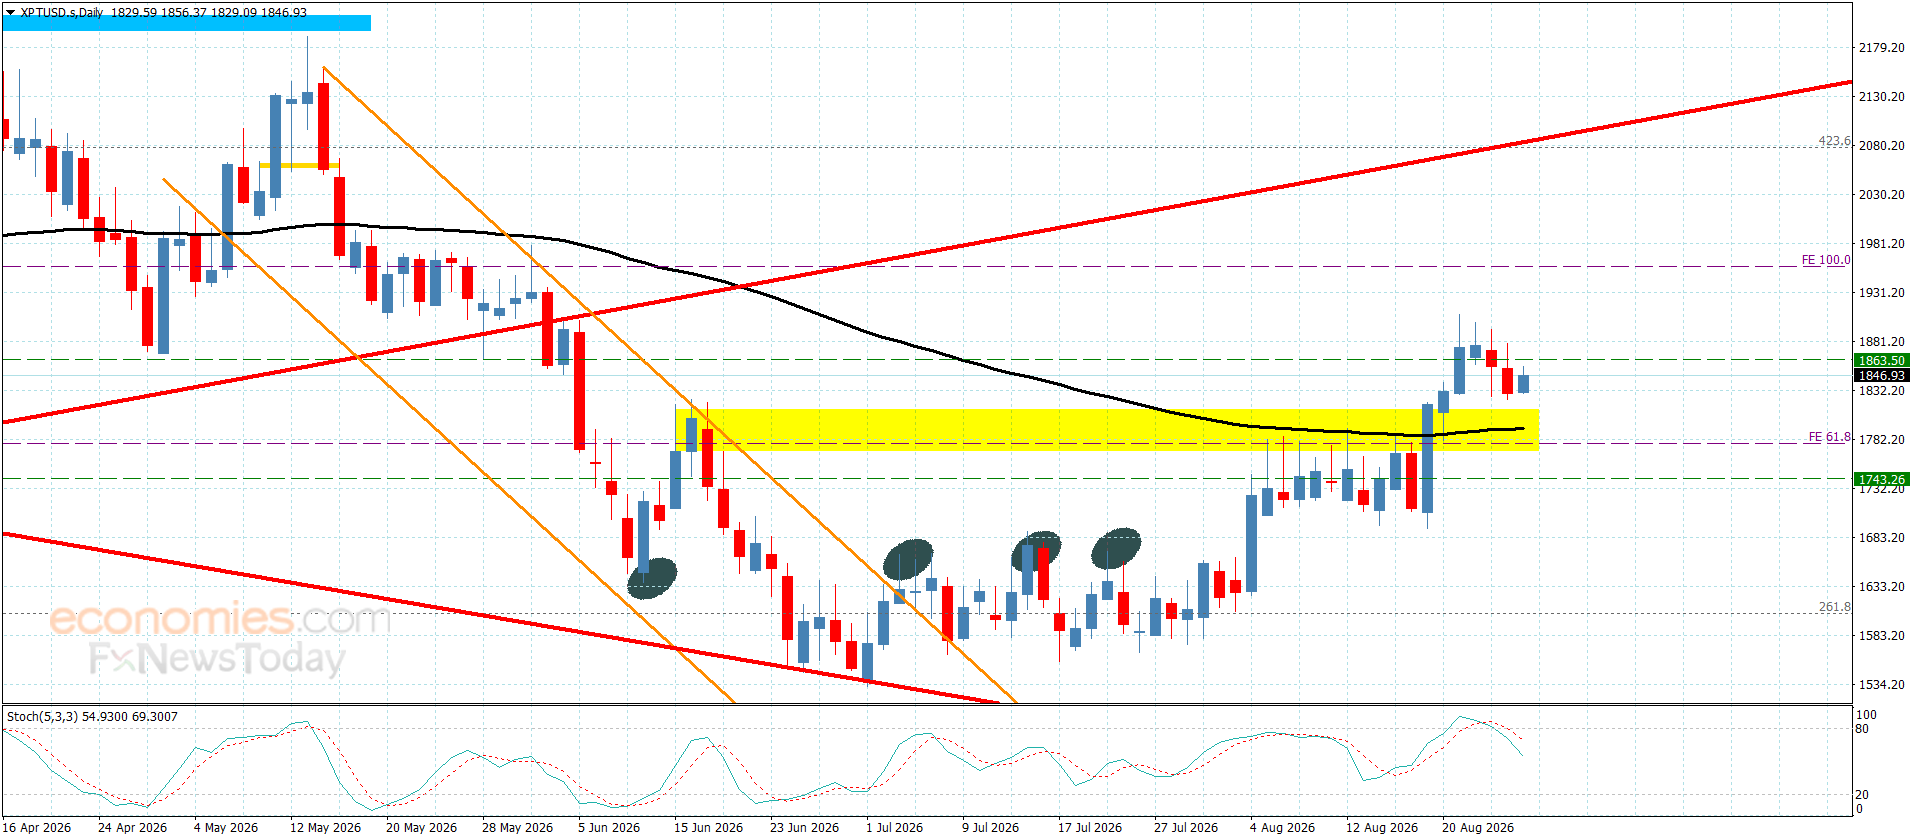
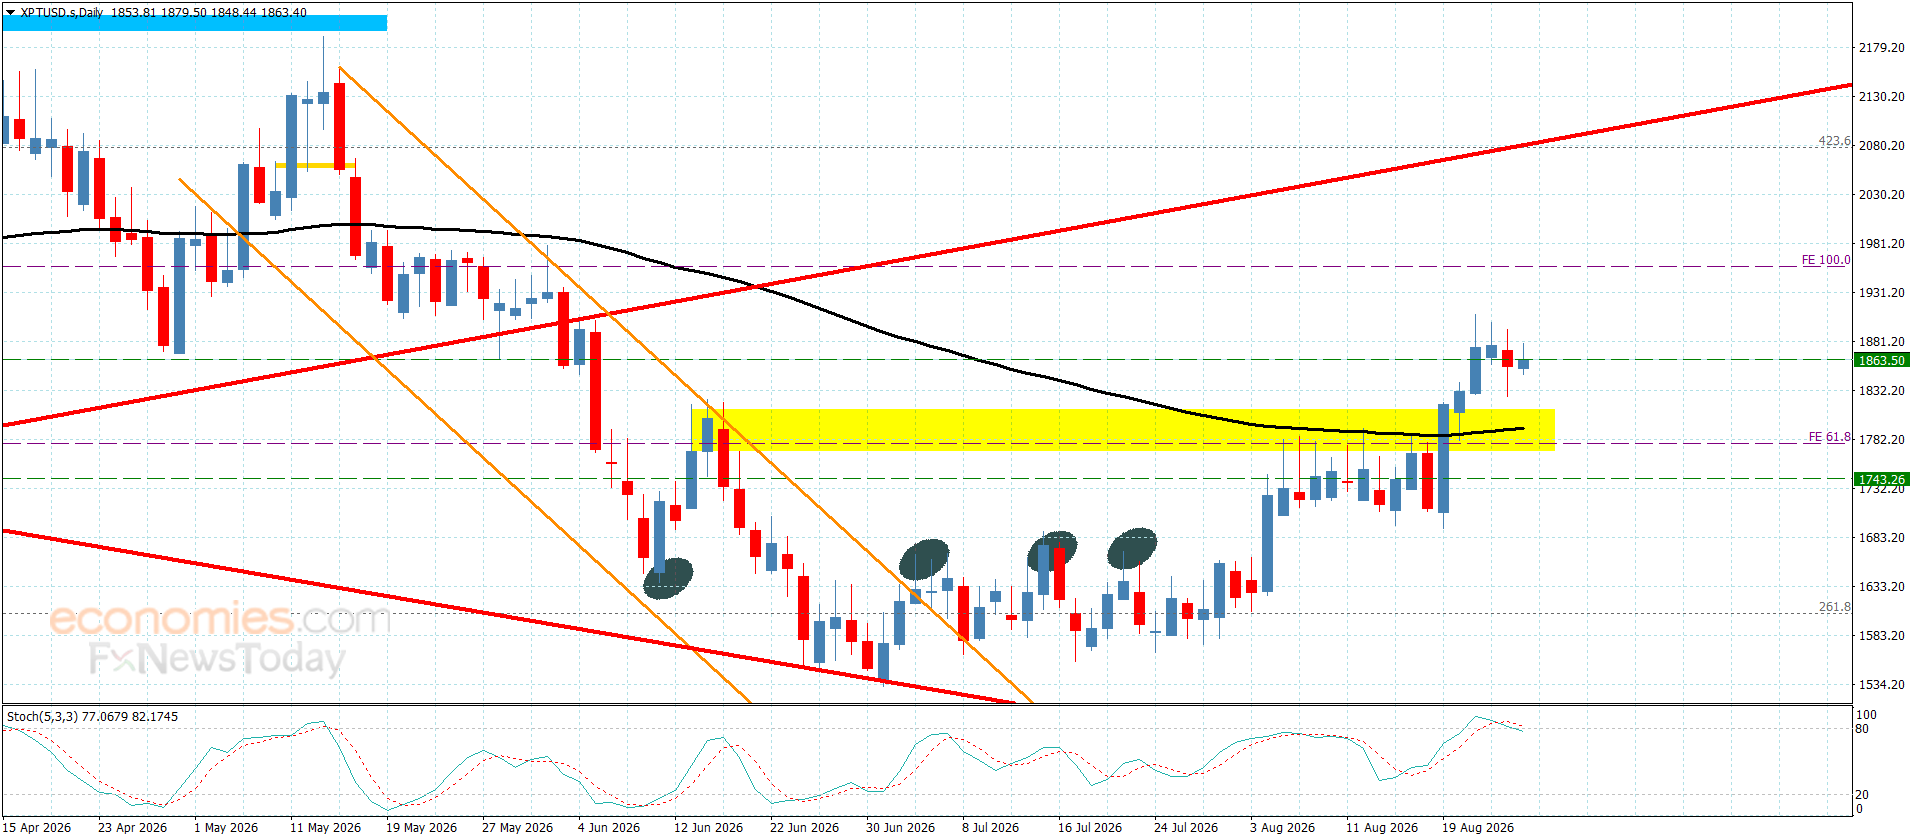
Platinum price kept providing sideways trading until this moment, due to its repeated confinement between $1780.00 support, while $1905.00 level represents a strong barrier against the attempts of resuming the bullish trend.
Noticing that stochastic exit the overbought level, which might push the price to provide corrective trading to test the mentioned sideways trend, while surpassing the barrier and holding above it will open the way for resuming the bullish trend, to expect targeting $1955.00 and $1990.00 level.
The expected trading range for today is between $1805.00 and $1905.0
Trend forecast: Sideways
Silver Price Forecast: XAG/USD Faces Key Test Below 100-Day SMA
The silver price (XAG/USD) is facing significant selling pressure as buyers struggle to reclaim ground below the 100-day Simple Moving Average (SMA), a key technical indicator watched by market participants. This level has emerged as a critical battleground for the precious metal, with the latest price action suggesting that momentum remains tilted to the downside in the current trading session.
The 100-day SMA is a widely followed trend indicator that smooths out price data over the past 100 trading days, offering a clearer view of the medium-term trend. As of the most recent market close, silver is trading below this dynamic resistance level, which is acting as a formidable barrier to any upside recovery. In technical analysis, a failure to break above a key moving average often signals that the broader trend is still bearish, prompting sellers to defend the level aggressively.
This price action is occurring within a broader context of consolidation. Silver has been range-bound for several weeks, but the repeated rejection at the 100-day SMA suggests that the balance of power is shifting in favor of the bears. A sustained move below the current support zone could open the door for a test of the next major support level, while a decisive break above the SMA would invalidate the bearish outlook and could trigger a wave of short-covering.
The movement in silver is being driven by a complex interplay of macroeconomic factors. The primary driver remains the monetary policy outlook from the U.S. Federal Reserve. Expectations for interest rate cuts have been a key support for precious metals, as lower rates reduce the opportunity cost of holding non-yielding assets like silver. However, recent economic data has been robust, leading traders to push back their expectations for the timing of the first rate cut, which in turn has strengthened the U.S. dollar and weighed on silver prices.
Additionally, industrial demand continues to provide a fundamental floor for silver. The metal is a critical component in solar panels, electronics, and electric vehicles. While this long-term demand story remains intact, short-term price action is heavily influenced by the dollar’s strength and U.S. Treasury yields. A stronger dollar makes silver more expensive for foreign buyers, while higher yields offer a competing safe-haven investment.
For traders and investors, the immediate focus is on the interaction between price and the 100-day SMA. The area just below this indicator is acting as immediate resistance. On the downside, the recent swing lows serve as the first line of support. A break below this level would likely accelerate selling pressure, potentially leading to a retest of the next psychological support level at the $30.00 mark. Conversely, a daily close above the 100-day SMA would be the first technical sign that the correction is over, with the next resistance target being the recent consolidation high.
Silver is at a critical juncture, with the 100-day SMA acting as a clear line in the sand for the medium-term trend. The failure of buyers to regain this level highlights the current bearish sentiment, driven by a resilient U.S. dollar and shifting rate cut expectations. While the long-term industrial outlook remains positive, the immediate technical picture suggests that the path of least resistance is to the downside unless a decisive break above the 100-day SMA occurs. Market participants will be closely watching upcoming U.S. economic data for fresh catalysts that could determine the next directional move.
Q1: What is the 100-day SMA in silver trading?
The 100-day Simple Moving Average is a technical indicator that calculates the average closing price of silver over the last 100 trading days. It is used by traders to gauge the medium-term trend and identify potential support and resistance levels.
Q2: Why is the U.S. dollar important for silver prices?
Silver is priced in U.S. dollars on global markets. When the dollar strengthens, it becomes more expensive for holders of other currencies to buy silver, which typically reduces demand and pushes prices down. Conversely, a weaker dollar usually supports higher silver prices.
Q3: What are the key support and resistance levels for silver?
Currently, the 100-day SMA acts as immediate resistance. On the downside, the recent swing low is the first support level, followed by the psychological $30.00 mark. A break above the 100-day SMA would point to the recent consolidation high as the next resistance target.
This post Silver Price Forecast: XAG/USD Faces Key Test Below 100-Day SMA first appeared on BitcoinWorld.
Domestic coffee prices today
Coffee prices today in the domestic market turned down in key areas. According to giacaphe. com, coffee prices on August 26 averaged 97,100 VND/kg, down 500 VND/kg compared to the previous session.
In Dak Lak, coffee prices were recorded at 97,000 VND/kg, down 500 VND/kg.
In Lam Dong, coffee prices reached 96,500 VND/kg, down 500 VND/kg. This is the lowest level among the surveyed areas.
In Gia Lai, coffee prices are at 97,000 VND/kg, down 500 VND/kg.
The old Dak Nong area recorded a level of 97,200 VND/kg, down 500 VND/kg. This is the highest level in today’s price list.
After the previous increase of 1,000 VND/kg, the price level has cooled down, but still remains around the 97,000 VND/kg range.
The USD/VND exchange rate according to Vietcombank was recorded at 25,890 VND/USD, down 30 VND.
World coffee prices
In the world market, coffee prices fell sharply in the most recent session.
According to Barchart, the December 2026 Arabica futures contract closed down 6.15 US cents/lb, equivalent to 1.80%. In the same session, the November 2026 Robusta futures contract fell 111 USD/ton, equivalent to 2.92%.
Barchart said coffee prices wiped out the upward momentum at the beginning of the session and fell sharply as information emerged that some warehouses in Brazil no longer received new coffee due to running out of storage space. This increased expectations that farmers may have to sell more as storage space shrinks.
This development puts pressure on domestic coffee prices, especially when Robusta fell nearly 3% in the most recent session. For Vietnam, Robusta is still the group that has a more direct impact on domestic purchasing prices.
Coffee price assessment
Domestic coffee prices decreased by 500 VND/kg after a strong increase session, in the same direction as the adjustment of world prices. Domestic decreases are not too deep, but show that the market is still fluctuating rapidly around the 97,000-98,000 VND/kg range.
According to Barchart, Robusta is under more pressure as Robusta’s ICE-certified inventory rose to a 9-month high. In the opposite direction, Arabica’s ICE-certified inventory fell to a 2.75-year low, which is a factor that could support Arabica in subsequent sessions.
Barchart also recorded Brazilian coffee harvest progress still slower than the same period. Cooxupe Cooperative said harvest reached 81.1% as of August 14, lower than 86.1% in the same period last year; Safras & Mercado recorded Brazilian coffee harvest reaching 90% as of August 12, lower than 97% in the same period and the 5-year average of 94%.
Domestically, according to the Ministry of Agriculture and Environment, in July, Vietnam exported about 147,600 tons of coffee, worth 639.5 million USD. Accumulated in the first 7 months of the year, coffee exports reached about 1.2 million tons, up 10.8% in volume but turnover decreased by 11.2%, to 5.45 billion USD. This development is mainly due to the average export price decreasing by 19.9% compared to the same period, down to 4,537 USD/ton.
Regarding the weather, the National Center for Hydro-Meteorological Forecasting said that on the day and night of August 26, the Central Highlands area will be cloudy, with showers and thunderstorms in some places; especially in the late afternoon and evening, there will be scattered showers and thunderstorms. Lowest temperature 21-24 degrees C, in some places below 20 degrees C; highest temperature 29-32 degrees C.
Rainstorms in this season need to be monitored in terms of garden care, pest and disease prevention, and goods preservation.
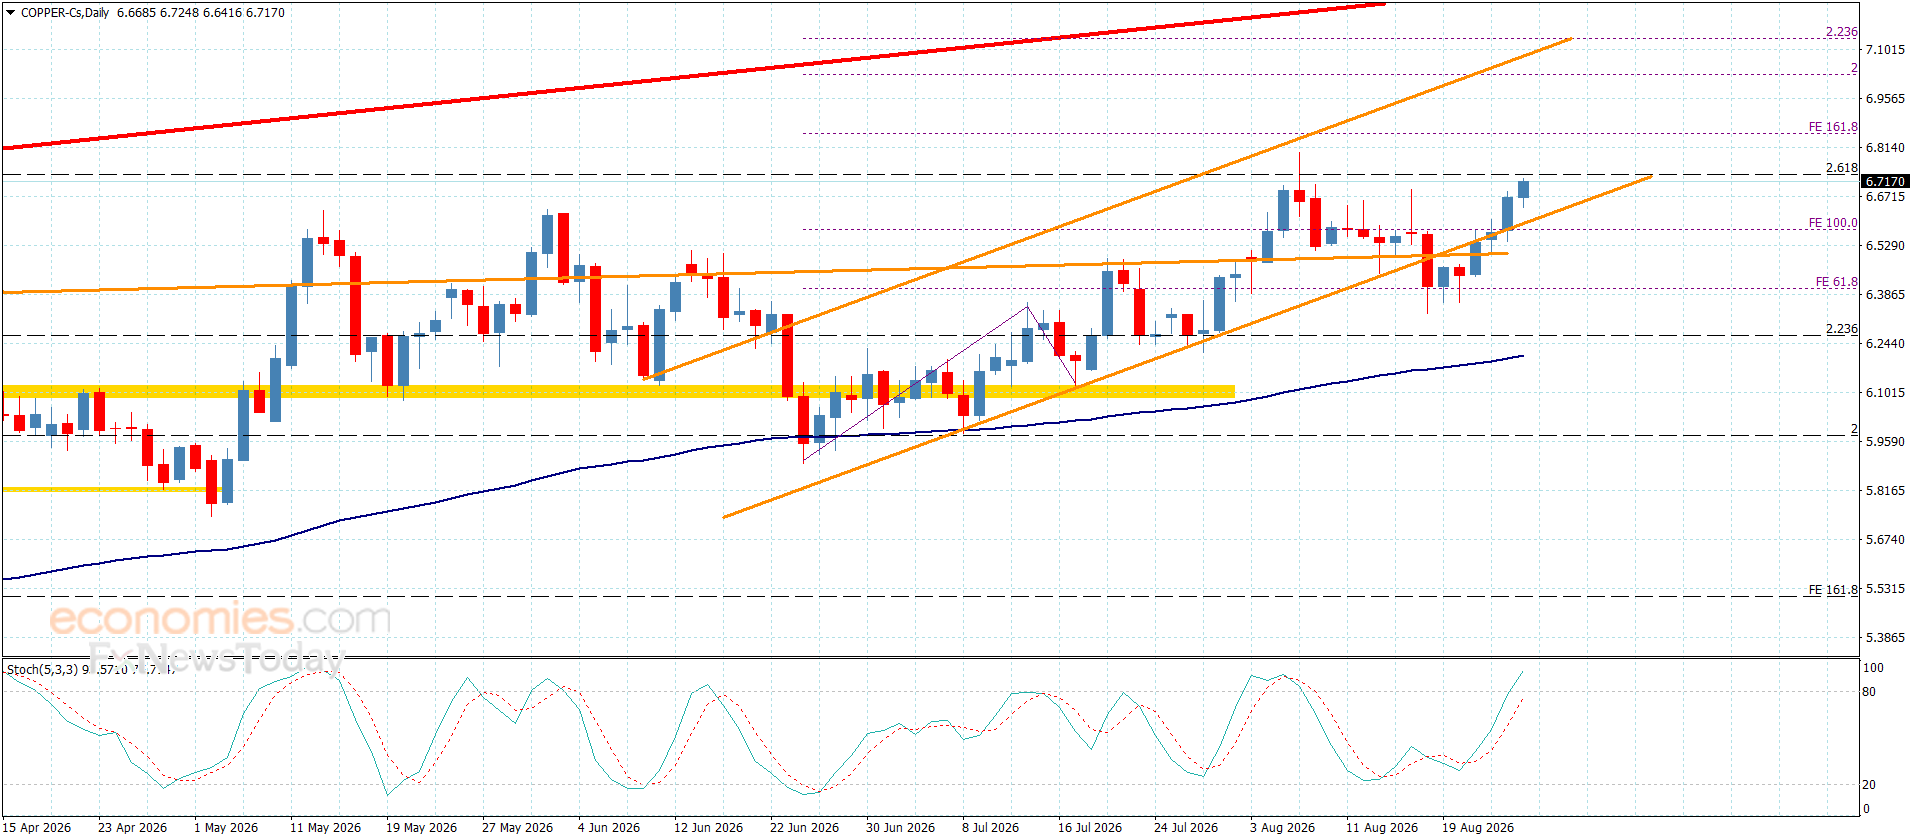
Copper price reacted to the positive signals from the main indicators, breaking above the barrier at $6.6100, reinforcing its commitment to the bullish scenario and currently settling near $6.7200 as it approaches the target proposed in the previous report.
The price is currently positioned within the pivots of the minor ascending channel. As the main indicators continue to provide positive momentum, this will increase the effectiveness of the bullish path, which could target $6.8500, followed by $7.0200 over the medium term.
The expected trading range for today is between $6.6300 and $6.7800
Trend forecast: Bullish
Gold price (XAU/USD) is down 0.75% to near $4,620 during the European trading session on Wednesday. The precious metal corrects as the rally pauses after posting a fresh three-month high at $4,697 the previous day, with investors turning cautious ahead of the United States (US) Personal Consumption Expenditure Price Index (PCE) data for July at 12:30 GMT and Federal Reserve (Fed) Chairman Kevin Warsh’s commentary at the Jackson Hole Symposium.
The US core PCE inflation, which is closely tracked by Federal Reserve (Fed) officials, is expected to have remained steady at 3.3% Year-on-Year (YoY), with monthly figures rising at a 0.2% pace, faster than the June reading of 0.1%.
Investors will pay close attention to the US PCE Inflation data to get fresh cues regarding the Federal Reserve’s (Fed) monetary policy outlook.
Signs of US inflationary pressures remaining steady might ease Fed’s interest rate hike expectations further, which receded significantly this month, following the release of the weak Nonfarm Payrolls (NFP) data for July.
Strategists at DBS flag Fed Chairman Kevin Warsh’s upcoming Jackson Hole keynote on Friday, August 28, as “the most important event this week,” but stress that the gathering is “viewed more as a credibility event rather than a rate-signalling one.” They note that “the past two days’ decline in the 30Y yield offers only a reprieve, not a resolution,” even as US Treasury Secretary Scott Bessent’s decision to expand long-bond buybacks “seeks to calm markets.” Against this backdrop, DBS argues that “Warsh faces a difficult balancing act: defending the Fed’s independence and price-stability mandate while providing greater clarity on the Fed’s reaction function without abandoning his preference for less forward guidance.”
In the daily chart, XAU/USD trades at $4,621.08, maintaining a bullish near-term bias as spot holds well above the 20-period Exponential Moving Average (EMA) at $4,411.62 and the 23.6% Fibonacci retracement at $4,338.71. The metal is also trading just over the 38.2% retracement at $4,580.10, suggesting buyers remain in control after the latest surge, while the Relative Strength Index (RSI) at 68.77 flirts with overbought territory, hinting that upside momentum is strong but increasingly stretched.
On the topside, initial resistance is located at the 50.0% Fibonacci retracement at $4,775.19, followed by the 61.8% level at $4,970.29, with higher hurdles aligning at the 78.6% retracement at $5,248.05 and the cycle high reference at $5,601.87. On the downside, immediate support is seen at the 38.2% retracement at $4,580.10, ahead of the 20-period EMA at $4,411.62, while a deeper pullback would expose the 23.6% Fibonacci retracement at $4,338.71 as the next notable demand area.
(The technical analysis of this story was written with the help of an AI tool. Know more.)
Gold has played a key role in human’s history as it has been widely used as a store of value and medium of exchange. Currently, apart from its shine and usage for jewelry, the precious metal is widely seen as a safe-haven asset, meaning that it is considered a good investment during turbulent times. Gold is also widely seen as a hedge against inflation and against depreciating currencies as it doesn’t rely on any specific issuer or government.
Central banks are the biggest Gold holders. In their aim to support their currencies in turbulent times, central banks tend to diversify their reserves and buy Gold to improve the perceived strength of the economy and the currency. High Gold reserves can be a source of trust for a country’s solvency. Central banks added 1,136 tonnes of Gold worth around $70 billion to their reserves in 2022, according to data from the World Gold Council. This is the highest yearly purchase since records began. Central banks from emerging economies such as China, India and Turkey are quickly increasing their Gold reserves.
Gold has an inverse correlation with the US Dollar and US Treasuries, which are both major reserve and safe-haven assets. When the Dollar depreciates, Gold tends to rise, enabling investors and central banks to diversify their assets in turbulent times. Gold is also inversely correlated with risk assets. A rally in the stock market tends to weaken Gold price, while sell-offs in riskier markets tend to favor the precious metal.
The price can move due to a wide range of factors. Geopolitical instability or fears of a deep recession can quickly make Gold price escalate due to its safe-haven status. As a yield-less asset, Gold tends to rise with lower interest rates, while higher cost of money usually weighs down on the yellow metal. Still, most moves depend on how the US Dollar (USD) behaves as the asset is priced in dollars (XAU/USD). A strong Dollar tends to keep the price of Gold controlled, whereas a weaker Dollar is likely to push Gold prices up.
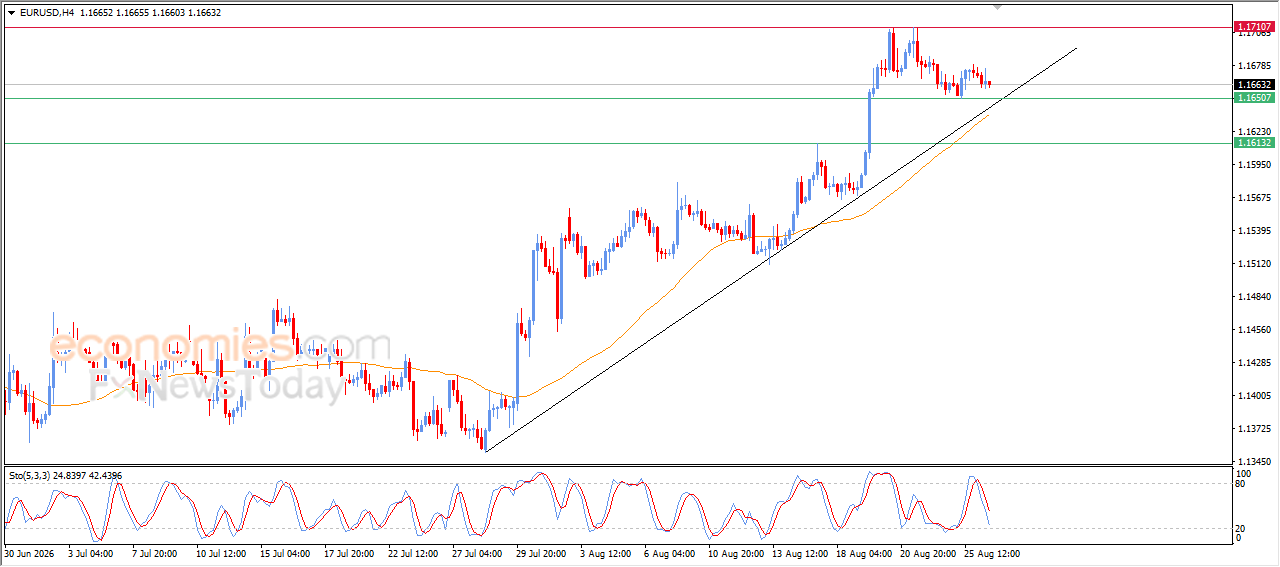
The EURUSD pair declined during its latest intraday trading, attempting to gain bullish momentum that might help it to recover and rise again, and it managed in offloading its overbought conditions on the relative strength indicators, increasing the chances of its near term recovery, especially with the continuation of the positive pressure due to its trading above EMA50, reinforcing the stability and dominance of the main bullish trend on the short-term basis, with its trading alongside supportive trend line for this path.
The platinum price was forced into mixed sideways trading, continuing to hover near $1865.00, as it remains confined between the resistance barrier at $1905.00 and the important support level at $1780.00.
We note that renewed positive momentum from the main indicators would increase the chances of the price resuming its bullish attempts. Accordingly, we expect it to retest the resistance barrier, where surpassing it will open the way for resuming the bullish move, targeting $1955.00 and $1990.00.
The expected trading range for today is between $1485.00 and $1910.00
Trend forecast: Sideways
Silver Price Forecast: XAG/USD Reclaims 100-Day SMA, Analysts Eye $70
Silver (XAG/USD) has reclaimed its 100-day simple moving average (SMA), a key technical level that signals a potential shift in momentum, with market participants now setting their sights on the $70 per ounce mark.
The move above the 100-day SMA, a widely watched indicator by traders and analysts, suggests that the recent pullback in silver prices may be losing steam. As of the latest trading session, silver is holding above this level, which previously acted as resistance during the recent decline. This reclaim often attracts technical buyers and can lead to further upside momentum.
The 100-day SMA is a critical gauge of the medium-term trend. A sustained move above it could open the door for a test of the $70 psychological level, a price point not seen in recent history. However, traders should note that a failure to hold this level could lead to a retest of lower support zones.
Several fundamental factors are underpinning silver’s strength. A softer US dollar, as reflected in the DXY index, has historically been supportive for precious metals, as it makes them cheaper for holders of other currencies. Additionally, expectations that the Federal Reserve may pivot towards a more accommodative monetary policy in the coming months have boosted the appeal of non-yielding assets like silver.
Industrial demand also plays a crucial role. Silver’s extensive use in solar panels, electronics, and electric vehicles continues to provide a solid demand floor. As global green energy initiatives accelerate, silver’s industrial consumption is projected to remain robust, adding a supportive backdrop to its price action.
The $70 level is not just a round number; it represents a significant technical and psychological barrier. A move to this price would represent a substantial gain from current levels and could trigger a new wave of investment interest. However, it is essential to approach such targets with caution, as markets can be volatile and unforeseen macroeconomic events can derail even the most bullish technical setups.
For investors, the reclaim of the 100-day SMA offers a potential entry point, but prudent risk management remains paramount. Monitoring the dollar’s trajectory, upcoming Fed statements, and global industrial production data will be key to gauging whether silver can sustain its upward path.
Silver’s reclaim of the 100-day SMA is a bullish technical signal, and the path towards $70 is now a focal point for market watchers. While the outlook appears constructive, driven by a softer dollar and robust industrial demand, investors should remain vigilant about potential headwinds, including shifts in monetary policy and broader economic data releases.
Q1: What is the 100-day simple moving average (SMA)?
The 100-day SMA is a technical indicator that calculates the average closing price of silver over the last 100 days. It is used by traders to assess the medium-term trend. A price above the SMA often indicates bullish momentum, while a price below suggests bearish sentiment.
Q2: Why is the $70 level significant for silver?
The $70 level is a major psychological and technical resistance point. It represents a price target that could attract significant buying interest if reached, but it also may trigger profit-taking. Such round numbers often act as magnets for price action.
Q3: What are the main factors that could push silver to $70?
A continued weaker US dollar, expectations of a less hawkish Federal Reserve, and strong industrial demand, particularly from the green energy sector, are the primary factors that could drive silver towards $70. Additionally, sustained technical buying above the 100-day SMA could add momentum.
This post Silver Price Forecast: XAG/USD Reclaims 100-Day SMA, Analysts Eye $70 first appeared on BitcoinWorld.
Welcome, my fellow traders! I have prepared a price forecast for the USCrude, XAUUSD, and EURUSD using a combination of the margin zones method and technical analysis. Based on the market analysis, I suggest entry signals for intraday traders.
The oil price is approaching support A of 83.32–82.92.
The article covers the following subjects:
Oil is approaching support A of 83.32–82.92. Once this zone is tested, consider long trades, with the first target at 85.14 and the second one around 87.36.
If the price breaks below the support A today, the correction will extend toward support B of 81.30–80.70, the trend boundary. Long trades can be considered near this zone.
Buy near support A of 83.32–82.92. TakeProfit: 85.14, 87.36. StopLoss: 81.86.
Yesterday, the gold price hit the Target Zone 3 of 4,698–4,677 within a short-term uptrend. However, the metal failed to break through this zone. Consequently, the price began to decline today, approaching support A of 4,594–4,583. Once this zone is tested, long trades can be considered, with the first target at 4,640 and the second one around 4,696.
The trend boundary is shifting to 4,542–4,527.
Buy near support A of 4,594–4,583. TakeProfit: 4,640, 4,696. StopLoss: 4,558.
The euro is correcting lower and nearing support A of 1.1627–1.1619. Once this zone is tested, long trades can be considered, with the first target at 1.1665 and the second at 1.1711.
If the price exceeds the 1.1711 level, the rally may continue toward the Target Zone 2 of 1.1761–1.1744. If the asset breaks below the support A, the correction may extend toward support B of 1.1585–1.1572.
Buy near support A of 1.1627–1.1619. TakeProfit: 1.1665, 1.1711. StopLoss: 1.1597.
Would you like to learn more about technical analysis methods and principles? Explore our comprehensive guide.
P.S. Did you like my article? Share it in social networks: it will be the best “thank you” 🙂
Useful links:
The content of this article reflects the author’s opinion and does not necessarily reflect the official position of LiteFinance broker. The material published on this page is provided for informational purposes only and should not be considered as the provision of investment advice for the purposes of Directive 2014/65/EU.
According to copyright law, this article is considered intellectual property, which includes a prohibition on copying and distributing it without consent.