The main tag of Gold Price Articles.
You can use the search box below to find what you need.
[wd_asp id=1]
The main tag of Gold Price Articles.
You can use the search box below to find what you need.
[wd_asp id=1]
Spot Gold trades with a modest downward bias for the fifth consecutive day, hovering at around $2,645 a troy ounce after the United States (US) opening. The XAU/USD pair has been shedding some ground in the last few days, albeit still far from suggesting an interim top at the record high of $2,685.45 posted in September.
Despite the recent US Dollar upsurge, the bright metal continues to attract investors, as they face multiple different fronts. On the one hand, the USD benefits from solid US macroeconomic data and reduced bets for a Federal Reserve (Fed) massive interest rate cut. On the other hand, speculative interest weighs in mounting tensions in the Middle East. Finally, stocks turned north at the beginning of the week, with losses in the tech sector dragging all major indexes and maintaining afloat the safe-haven metal.
Data-wise, the calendar had offered little of relevance this week, with the focus on upcoming US data. The Federal Open Market Committee (FOMC) will unveil the Minutes of its September meeting on Wednesday. The document may miss the surprise factor after comments from Fed officials flooded the news post-meeting and following an outstanding Nonfarm Payrolls (NFP) report.
On Thursday, the country will release the September Consumer Price Index (CPI), which may gain relevance after solid employment-related data. Inflation in the US has retreated sharply after peaking at record highs in 2022 but remains above the Fed’s goal of around 2%. Nevertheless, officials have said they remain confident they will soon achieve such a goal. Should CPI figures come in higher than anticipated, investors may reduce bets for a November rate cut and, hence, provide the USD with an unexpected boost.
From a technical perspective, XAU/USD is in a consolidative phase, still developing above all its moving averages in the daily chart. Even further, the 20 Simple Moving Average (SMA) maintains a sharp upward slope far above the longer ones while providing dynamic support at around $2,620. At the same time, the Momentum indicator is flat well above its 100 line, while the Relative Strength Index (RSI) indicator aims marginally lower at around 61, none of them enough to support a steeper decline.
Technical readings in the 4-hour chart offer a neutral-to-bearish stance. XAU/USD pressures its intraday lows, while a mildly bearish 20 SMA contains intraday advances. At the same time, a still bullish 100 SMA provides support. Finally, technical indicators turned south within negative levels, maintaining the downward slope. A steeper near-term decline could be expected on a break below $2,624.50, the immediate support area.
Support levels: 2,624.50 2,616.00 2,603.90
Resistance levels: 2,649.45 2,663.00 2,673.20
Gold price maintains its corrective decline early Tuesday, looking to threaten the lower boundary of the recent range at $2,630. The focus now remains on the Middle East tensions, additional Chinese stimulus rollout and speeches from US Federal Reserve (Fed) policymakers for fresh directives.
Gold price is struggling to find a foothold, as sellers remain in control amid the re-emergence of worries surrounding China’s economic prospects, as Chinese traders return after a week-long holiday break.
Even though Chinese stocks re-opened with a bang, no announcements on further stimulus so far and the National Development and Reform Commission’s (NDRC) gloomy outlook on China’s economy intensified risk aversion across Asia.
China’s state planner, the NDRC, said in its press conference that “the downward pressure on China’s economy is increasing.” Gold price, therefore, remains undermined, as China is the world’s top Gold consumer.
The Gold price correction, however, appears cushioned by a broad pullback in the US Dollar (USD) alongside the US Treasury bond yields, following the dovish remarks from St. Louis Fed President Alberto Musalem. Musalem said late Monday that “further gradual reductions in the policy rate will likely be appropriate over time,” adding that “I will not prejudge the size or timing of future adjustments to policy.”
His comments fuelled a fresh leg down in the USD, despite markets ruling out a 50 basis points (bps) Fed rate cut next month. Markets are currently pricing in about an 86% chance that the Fed will opt for a 25 bps rate cut at its next meeting, the CME Group’s FedWatch Tool shows.
Looking ahead, speeches from Atlanta Fed President Raphael Bostic and Fed Vice Chairman Philip Jefferson will be closely scrutinized in the absence of any top-tier economic data releases from the US later on Tuesday.
Traders will also pay attention to the escalating conflict between Israel and Iran, especially after the Iran-backed militant group, Hezbollah, fired dozens of rockets at Israel’s third-largest city, Haifa. Meanwhile, the Israeli military has described its recent ground operation in Lebanon as “localized, limited and targeted,” but it has steadily increased in scale beginning last week.
Following a gradual decline over the last four days, Gold buyers are seen challenging the key static support of $2,630.
The 14-day Relative Strength Index (RSI), however, stays well above the midline, currently near 62, suggesting that any decline in Gold price could be likely bought into.
Gold price needs a daily candlestick closing above the strong resistance near $2,670 to negate the near-term downside pressure.
The next resistance is aligned at the record high of $2,686. Further up, buyers will target the $2,700 round level.
On the flip side, Gold sellers must crack the intermittent low of $2,630 on a daily closing basis to unleash further correction toward the $2,600 threshold.
Ahead of that level, the 21-day Simple Moving Average (SMA) at $2,614 could offer a temporary relief to buyers.
Gold has played a key role in human’s history as it has been widely used as a store of value and medium of exchange. Currently, apart from its shine and usage for jewelry, the precious metal is widely seen as a safe-haven asset, meaning that it is considered a good investment during turbulent times. Gold is also widely seen as a hedge against inflation and against depreciating currencies as it doesn’t rely on any specific issuer or government.
Central banks are the biggest Gold holders. In their aim to support their currencies in turbulent times, central banks tend to diversify their reserves and buy Gold to improve the perceived strength of the economy and the currency. High Gold reserves can be a source of trust for a country’s solvency. Central banks added 1,136 tonnes of Gold worth around $70 billion to their reserves in 2022, according to data from the World Gold Council. This is the highest yearly purchase since records began. Central banks from emerging economies such as China, India and Turkey are quickly increasing their Gold reserves.
Gold has an inverse correlation with the US Dollar and US Treasuries, which are both major reserve and safe-haven assets. When the Dollar depreciates, Gold tends to rise, enabling investors and central banks to diversify their assets in turbulent times. Gold is also inversely correlated with risk assets. A rally in the stock market tends to weaken Gold price, while sell-offs in riskier markets tend to favor the precious metal.
The price can move due to a wide range of factors. Geopolitical instability or fears of a deep recession can quickly make Gold price escalate due to its safe-haven status. As a yield-less asset, Gold tends to rise with lower interest rates, while higher cost of money usually weighs down on the yellow metal. Still, most moves depend on how the US Dollar (USD) behaves as the asset is priced in dollars (XAU/USD). A strong Dollar tends to keep the price of Gold controlled, whereas a weaker Dollar is likely to push Gold prices up.
Please refer to the Important Notice at the end of this article1
Copper has shaped human history and civilisation for millennia. In the 20th century, the story of copper was inextricably linked to the rise of electricity demand. As we harnessed electrical power, copper became an indispensable material, crucial to our energy systems and modern technology.
Through the 21st century, we expect copper to remain an essential building block to modern life as the world seeks to improve living standards for billions of people, transitions towards a net zero greenhouse gas (GHG) emissions economy, and further digitalises its industries and societies.
In this article, we discuss:
Total global copper demand has grown at a 3.1% compound annual growth rate (CAGR) over the last 75 years – but this growth rate has been slowing. It was only 1.9% over the 15 years to 2021. Looking to 2035, however, we expect this growth rate to jump back to 2.6% annually.
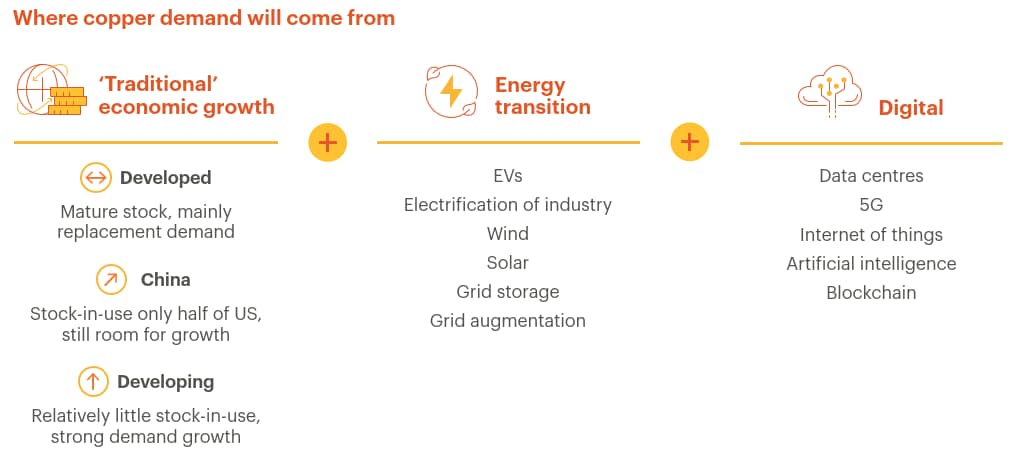
We believe this reversal will come from a combination of three key themes: ‘Traditional’ economic growth, and the newer themes of the ‘Energy Transition’ and ‘Digital’ (primarily data centres).
‘Traditional’ demand refers to the basic relationship between economic growth, electricity consumption and copper. Through the 20th century and into the 21st, as countries developed, electricity became accessible to industry and homes and led to the creation of products that lifted living standards: lighting, washing machines, refrigerators, air conditioners, radio and television, computers and smartphones. It is not only these products that need copper; so do the factories and supply chains that produce and deliver them, and the power infrastructure keeping them all running. Copper’s broad application across multiple end-uses has made it resilient and less-exposed to single point failures of demand.
Traditional demand in the developed world is expected to remain strong and as living standards rise globally, the demand for copper is expected to follow suit. Developing economies, which have nearly five times the population of high-income economies, will increasingly strive to achieve the same high standard of living. This transition will lead to a greater need for copper.
Take China for example, despite its enormous appetite for copper over the past two decades, it still only has half of the copper accumulated stock-in-use per capita (e.g. buildings, machinery, vehicles) compared to a developed economy, at around 100 kilograms per capita. India, the other major economy with over one billion people, also has a compelling copper story. India’s electricity consumption per capita currently stands at around one-seventh of Japan’s and one-fifth of China’s, and we expect its copper demand to grow five-fold over its pre-Covid volumes in the coming decades as electricity is made more accessible.
This traditional demand provides a solid foundation, but it does not account for the rapid acceleration of growth expected in the decades to come. That will be driven by the ‘Energy Transition’ and ‘Digital’ trends.
Since the Industrial Revolution, the use of fossil fuels has helped the world unlock greater levels of productivity. As the world seeks to rein in the use of these fuels (and their related carbon emissions), it will need more electricity (mainly from renewable sources) to keep everything running. Most energy modellers agree that electrification will be a major enabler of the decarbonisation of transport, buildings and large parts of industry. Under our base case, we see electricity demand roughly doubling from today to 2050, as electricity’s share of total energy consumption also doubles to around 40% by 2050.2
‘Energy Transition’ copper demand refers to the additional copper required to achieve that level of electrification. As the most conductive industrial metal, copper is a key enabler of low GHG emissions energy sources, such as wind, solar, and hydro, as well as electric vehicles (EV) and batteries. An EV, for example, uses around three times more copper than typical internal combustion engines (ICE). As the energy transition unfolds, we anticipate the roll-out of EVs to lift the transport sector’s share of total copper demand from around 11% in 2021, to over 20% by 2040.3 Copper is also needed for energy efficiency and conservation measures, such as smart grids, LED lighting, and heat pumps. On top of this, the generation and transmission of low GHG emissions electricity is expected to require more copper than conventional fossil fuel power generation.4
‘Digital’ demand refers to the growth from the expected ramp-up in demand for digital infrastructure, as the world creates and consumes massive amounts of data, enabled by copper-hungry data centres. Artificial Intelligence (AI)-enabled technology requires vast amounts of data and processing capability, which in turn needs larger and faster computers consuming more electricity. We expect global electricity consumption for data centres to rise from around 2% of global demand today, to 9% by 2050, with copper demand in data centres increasing six-fold by 2050.5
Today, we estimate that the Traditional vs Energy Transition vs Digital split of global copper demand is around 92%/7%/1%. By 2050, we predict the split to have evolved to 71%/23%/6%.6
What is unique about the next 25 years is the way copper demand from electrification, decarbonisation and digitisation will cut across high, middle and lower-income economies alike. Unlike the 20th century, where the adoption of cars, electricity, consumer electronics and white goods occurred at different times across various regions, we expect to see more-or-less concurrent adoption of the copper-intensive technologies of EVs, renewables and data centres around the world.
There will be some balancing factors for this significant growth in copper demand, such as from substitution and thrifting, which have been a feature of the copper industry throughout its history.
When it comes to copper-to-aluminium substitution, many have long held to the ‘three to one’ rule of thumb: when the copper price is more than three times the price of aluminium, you will start to get increased levels of substitution. More recently, some estimates have adjusted this ratio higher, to around 3.5 times.
However, the copper-to-aluminium ratio7 has been in excess of 3.5 for much of the past five years, supporting our belief that the price ratio needs to be higher still, at around 3.5 to 4 times, before you see greater levels of substitution.
It is not just about cost either. Substitution and thrifting require design alteration, product line modification and investment in new equipment, and worker retraining. And uptake relies on customers believing the product works as well or better than what they can access today. None of these things happen quickly, especially in the well-established ‘traditional’ end-uses. The sectors that are most exposed to substitution and thrifting are those driving demand in the Energy Transition segment. These new technologies are still undergoing evolution and development, and each iteration presents a new opportunity to reduce copper use – up to a certain limit.
We also believe copper has some unique advantages that make it difficult to substitute or thrift in many end-uses, such as its conductivity, durability, recyclability and antimicrobial properties. This is why it remains widely used, despite potentially cheaper options being available. Copper also has a smaller GHG emissions intensity8 footprint than aluminium, which may be a relevant factor when choosing materials in the future.
While we expect substitution and thrifting will rise from current levels, this should be a gradual process, as has been observed over the past century.
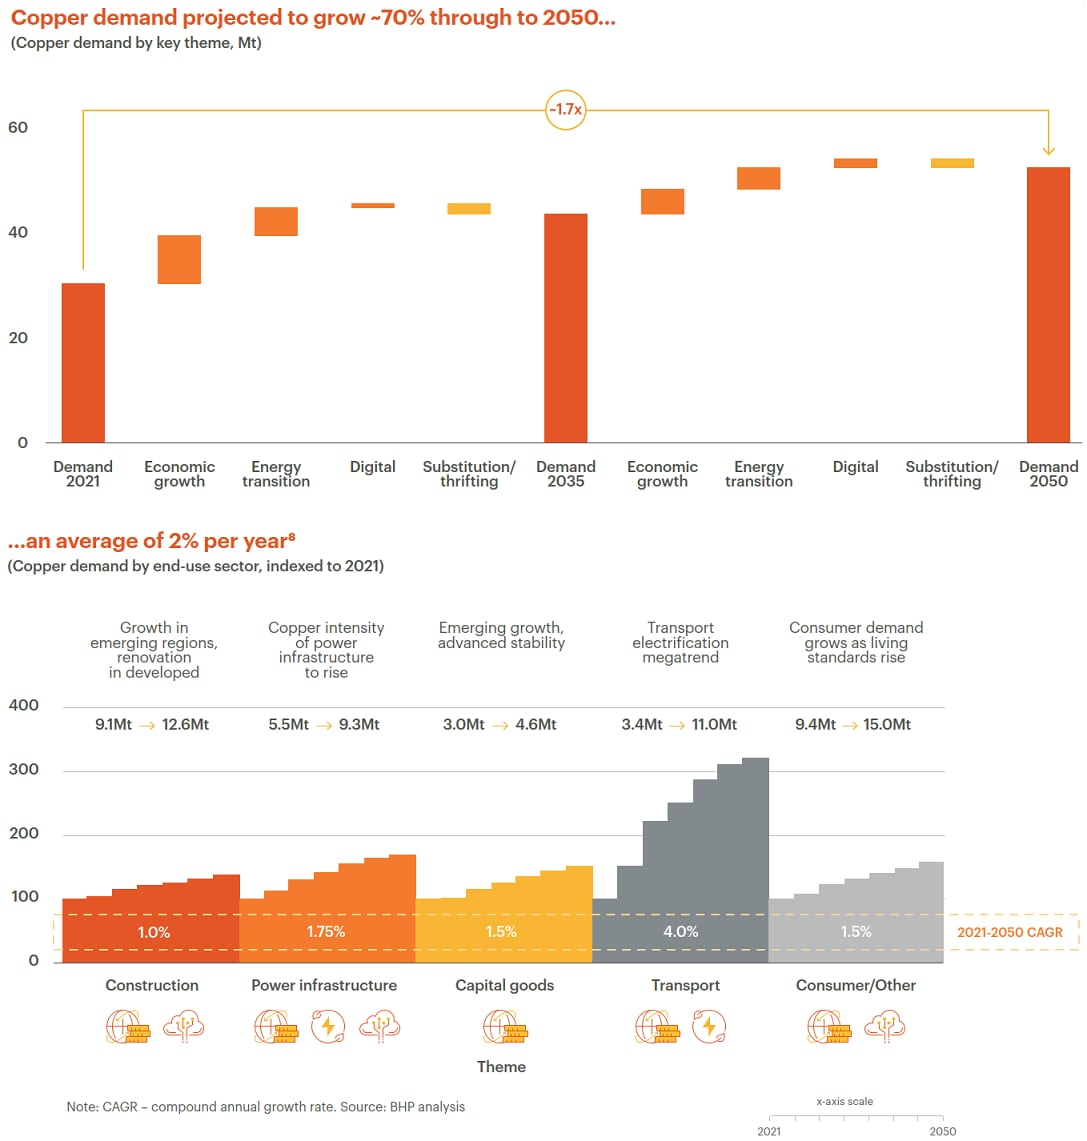
Putting all these levers together, we project global copper demand to grow by around 70% to over 50 Mt per annum by 2050 – an average growth rate of 2% per year.
Due to the concurrent adoption of new copper-intensive technologies, as well as support from the broad-based ‘traditional’ development across end-uses in emerging economies, we anticipate a re-acceleration of copper demand to 2035 of 2.6% CAGR, versus a 1.9% CAGR over the past 15 years. In absolute terms, this is roughly 1 Mt copper demand growth per year, every year, until 2035 ‒ double the 0.5 Mt annual growth volume of the past 15 years.
As with demand, there are different drivers of copper supply. First and foremost, primary supply comes from mines and processing facilities such as those that BHP operates.
But secondary, or scrap, copper is also an important source of supply. Copper can be recycled from end-of-life products (‘old scrap’) or from waste generated in the manufacturing process (‘new scrap’), reducing the need for primary copper from mining.9
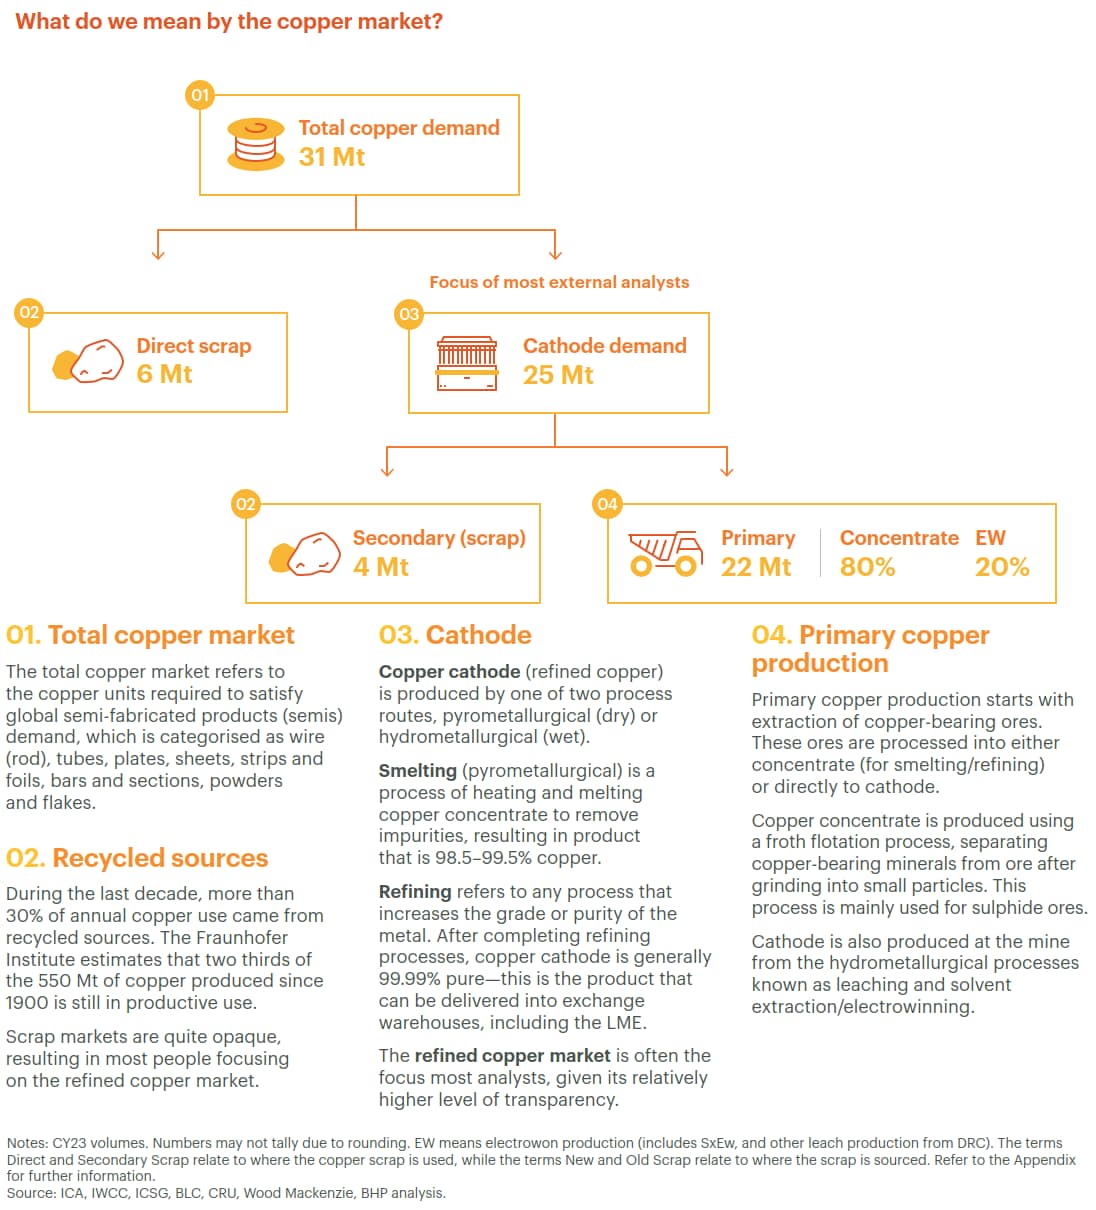
Recycled copper is expected to be an important source of supply to meet the large copper demand growth over the next 30 years. The main barrier to recycled copper supply is the availability of scrap.
The pool of ‘old scrap’10 is principally determined by the average lifetime of an end-use product. These lifetimes can range from weeks or months for some consumer products (e.g. from batteries, headphones, charging cables) up to several decades (e.g. from construction and infrastructure). We assess the average life of copper in-use to be around 20 years.
Much of this ‘old scrap’ is also not recovered. We estimate that in 2021 only 43% of available ‘old scrap’ was collected and recovered for re-use, falling to 40% in 2023 as lower prices, slowing economic activity and regulatory changes acted as headwinds. Rising ‘scrap nationalism’ to preserve the local use of secondary material and restrictions in cross-regional waste trade have also acted as a drag on growth for global scrap collection and recovery11 (and may affect the availability of scrap in developing countries who have not yet built up their own substantial pool of copper in-use).
Nevertheless, we expect the increased focus on copper as a critical or strategic raw material will lift copper scrap collection and recovery rates from their current levels to 56% by 2035 and even higher longer term.12
With the growing scrap pool, we estimate that scrap supply will increase from around one third of global copper today to around 40% by 2035, and reach around a half of total copper consumption by 2050.
But even with this increasing use of copper scrap, we still expect more primary, or mined, copper will still be required when you add grade decline and mine depletions on top of this.
We estimate that the world will need about 10 Mtpa new mined copper supply13 in the next 10 years.
Where will it come from?
Copper reserves and production are concentrated in Latin America, Australia and Africa. The last 30 years has seen impressive supply growth globally, with production doubling to around 22 Mtpa today, primarily due to increases from Latin America (particularly Chile), the Asia Pacific region and Africa (over the last 10 years). This has been achieved through significant investment in greenfield projects and the wide-spread adoption of the leach-solvent extraction-electrowinning (SxEw) process from the mid-1980s, which unlocked previously uneconomic copper supply low grade oxide ores. This process now accounts for 20% of mine supply.
The industry’s current challenge is to repeat this substantial volume growth in less than half the time.
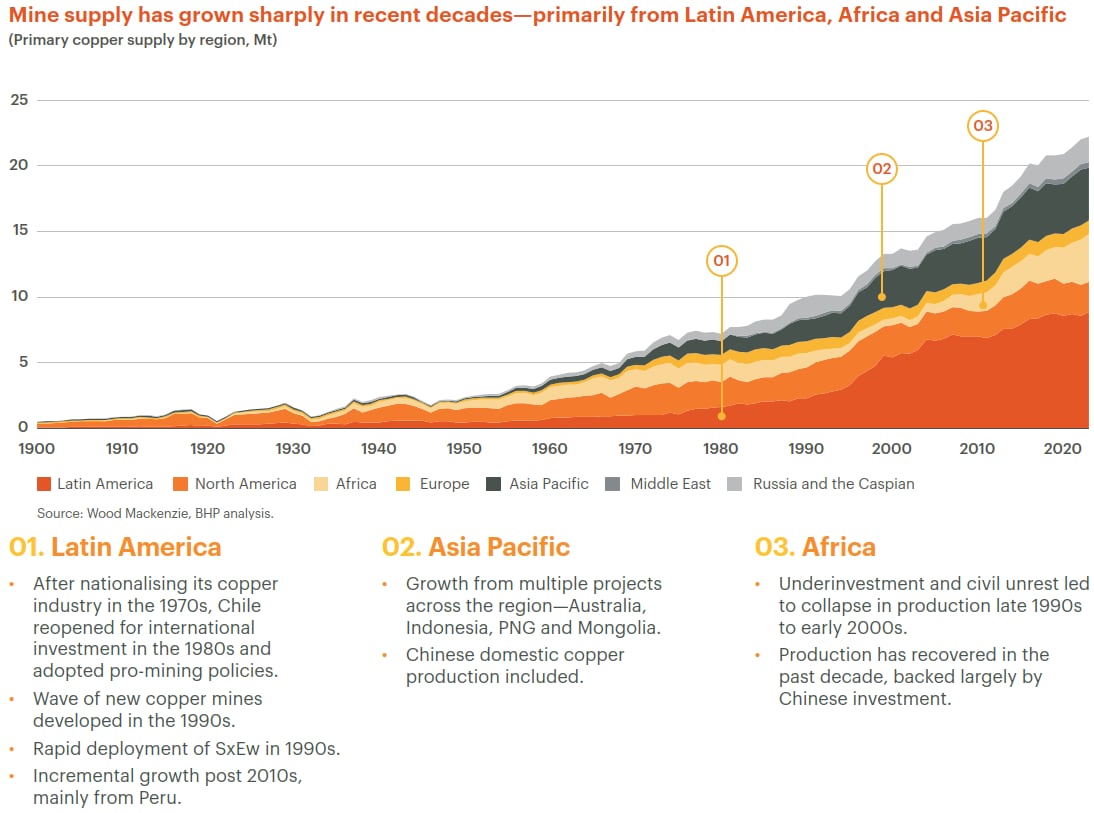
We expect supply growth over the next 10 years to be dominated by the same regions – Latin America Africa and Asia Pacific – with Africa having the highest growth rate (albeit off a much lower base than Latin America), and Latin America continuing to make the most significant contribution in absolute terms.
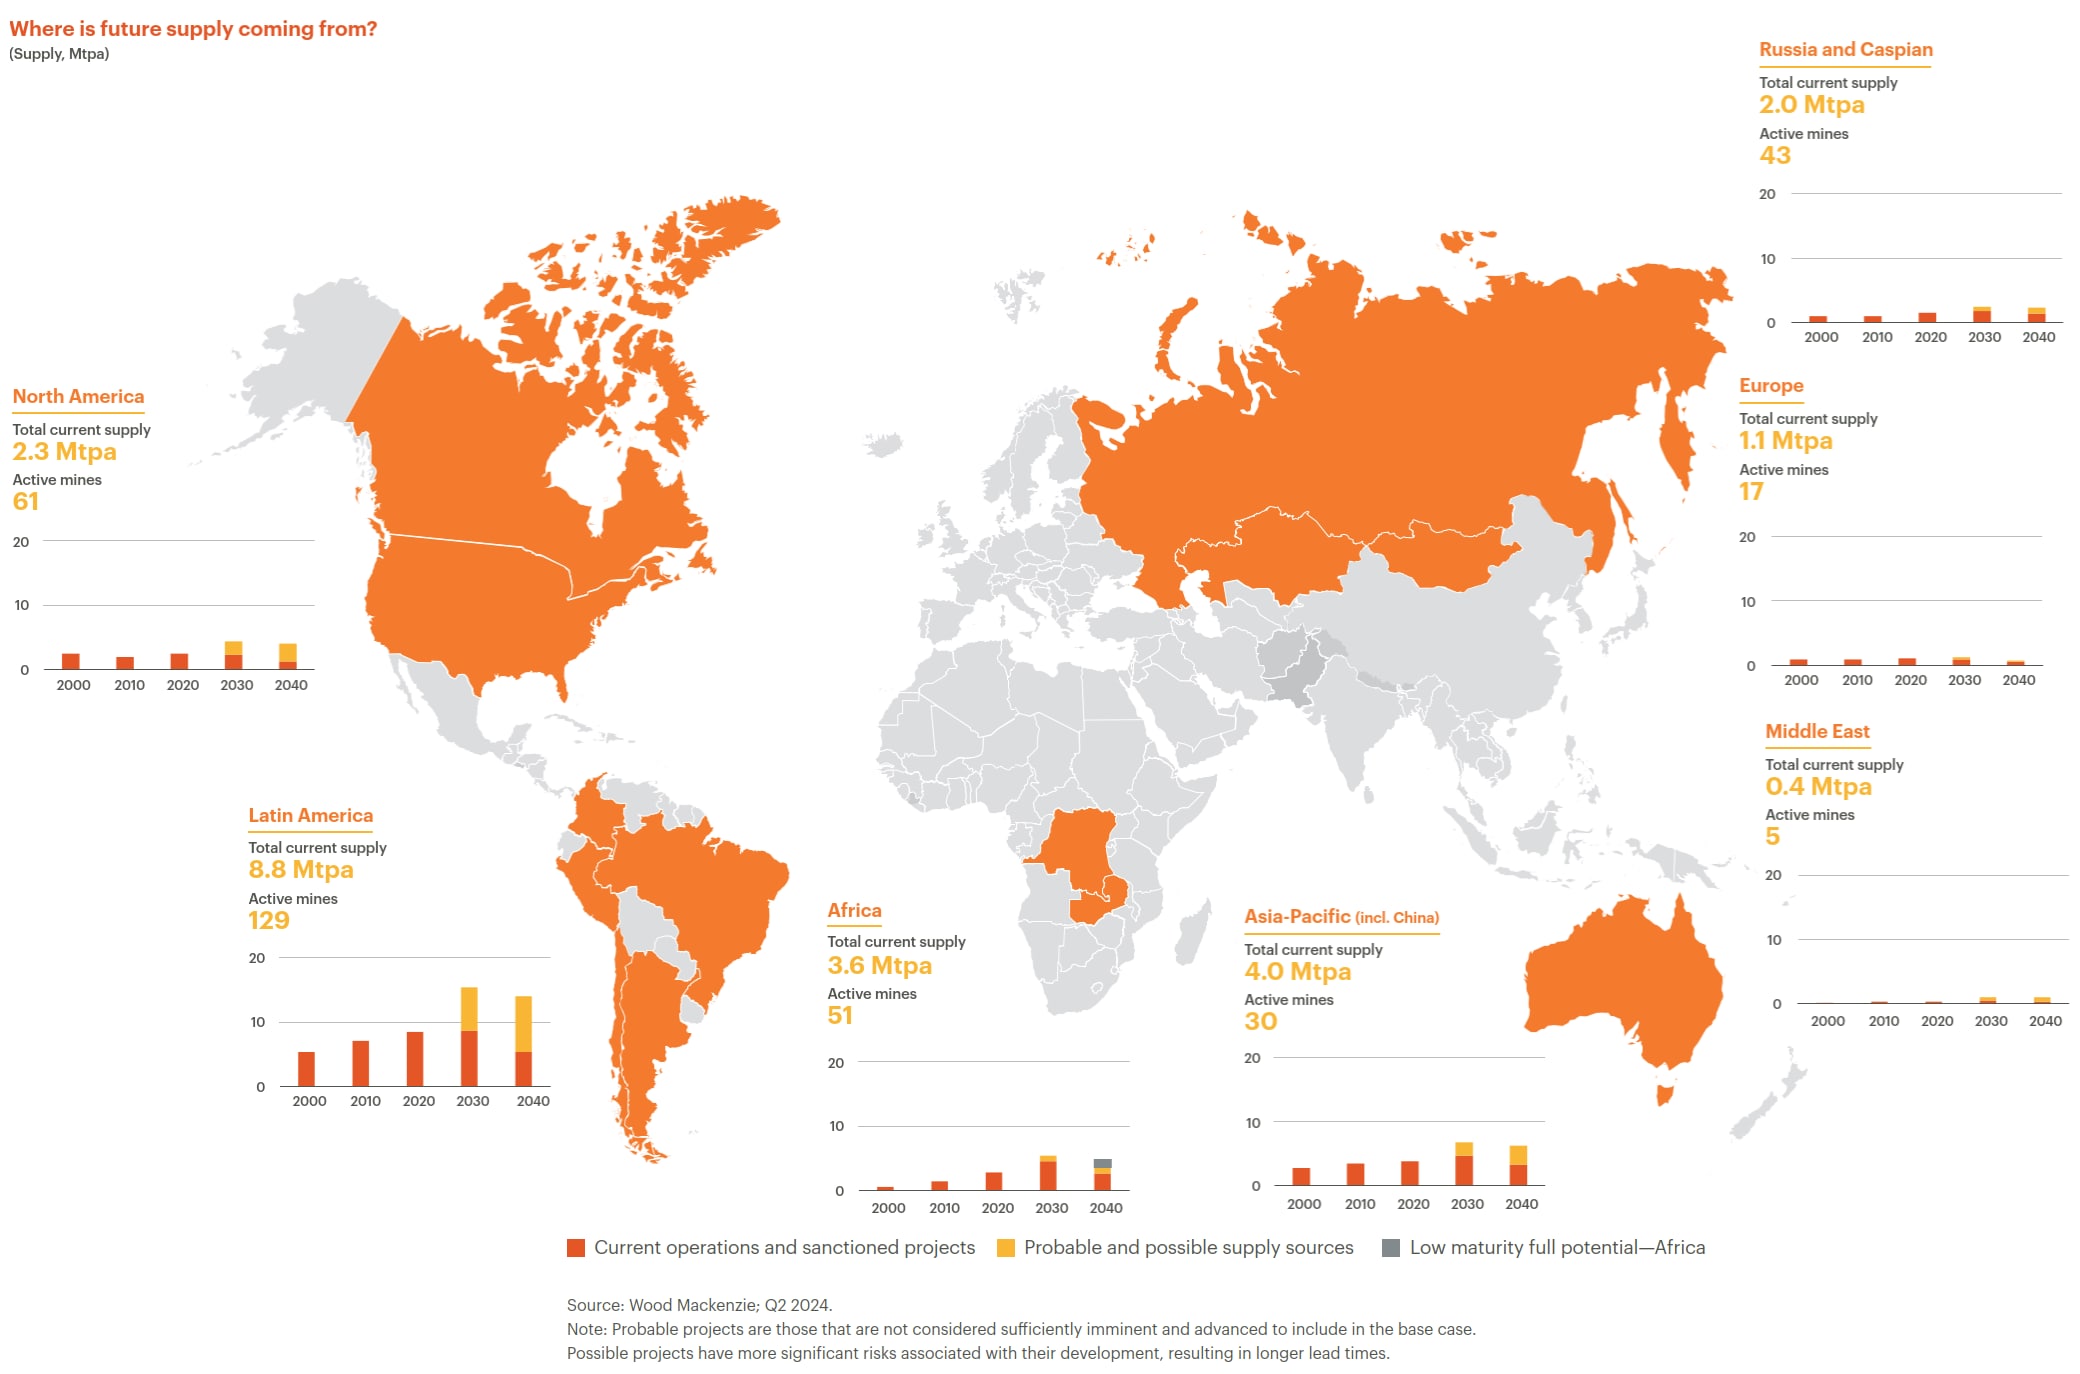
View the full size map here.
Against optimistic supply forecasts, which include the development of all probable copper projects, a significant gap to expected demand in 2035 is evident, even with our positive view on copper scrap supply.
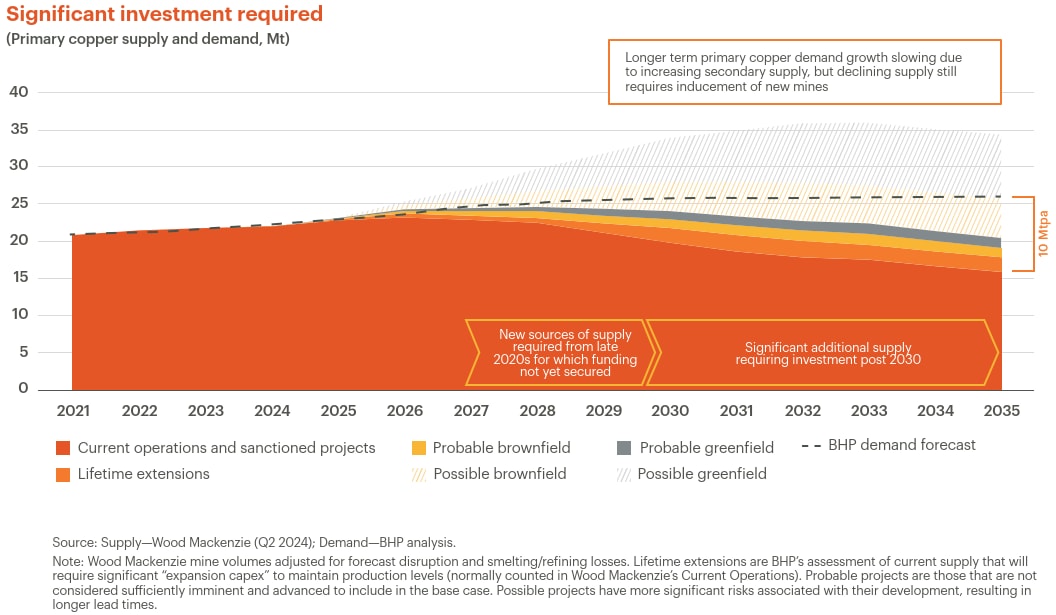
Currently operating copper mines are expected to provide more than half of the copper required to meet future global demand over the next decade. Even so, we estimate existing mines to be producing around 15% less copper in 2035 than they do today.14
These mines are already mature and are likely to need additional capital investment to replace or upgrade aging infrastructure or processing facilities. Alternatively, they may take advantage of new technologies that can improve their efficiency or recovery (e.g. converting oxide leaching plants to sulphide leaching, or recovering copper from waste). They are also likely to need to comply with new and higher standards when renewing or extending permits and licences to meet the evolving expectations of communities, customers and regulators.
Existing copper mines also typically face declining grades, as higher grades are usually mined first, and lower grades are left for later. We estimate the average grade of copper mines has declined by around 40% since 1991. This is partly explained by processing advances, such as SxEw, which have improved the economics of lower-grade deposits and brought them into production. Declining grades also means that more ore needs to be mined, processed and transported to produce the same amount of copper. Without technological advancements, grade decline is likely to further increase production costs on a unit of output basis.
This trend may also increase potential environmental and social impacts, due to increased material movement if throughput is increased to maintain production levels.
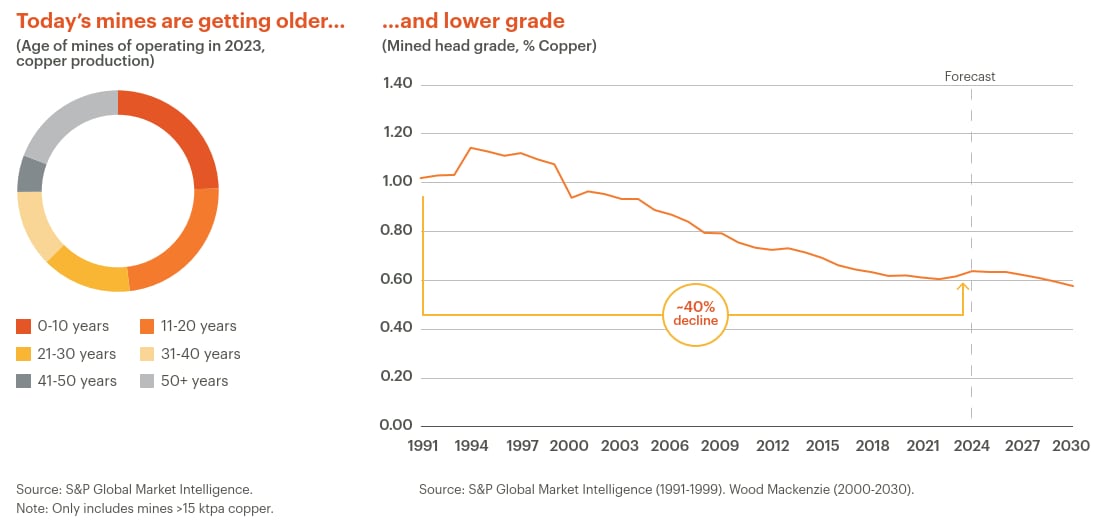
We expect between one-third and one-half of global copper supply to face grade decline and ageing challenges over the next decade, which will drive increased unit costs and the requirement for capital reinvestment. While an incredible orebody can make a big difference, many older operations move up the cost curve as they progress through their life cycle. Given the strong demand signals, however, we expect the industry to vigorously pursue options to extend the life of these copper mines.
One way of overcoming these challenges is with technology. We see examples of incremental productivity improvements from AI-enabled insights in processing, the repurposing or reinvigorating of older facilities with latent capacity, and adoption of new technologies to improve leaching. But it will be difficult to see the impact of these technologies becoming widespread until at least the mid-2030s. Research and development of innovative sulphide leaching technologies is continuing and we expect to see test work and pilot projects improve understanding of their potential. This will allow the industry to evaluate their true capital requirements, and address permitting uncertainty. But in our view, adoption of any primary sulphide leaching technologies into existing operations will need to complement existing processing infrastructure in most life extension and brownfield options, and the economic trade-offs remain unclear at an industry level. For it to be a truly disruptive technology longer term (post 2035), we would also need to see significant advances in scalability, but adoption efforts to date suggest that leaching processes will need to be tailored to individual ore bodies.
For current operations with significant resources remaining, brownfield developments will be an attractive response to the challenges outlined above. Based on our project-by-project global review, we expect new brownfield supply to contribute up to 30% of total copper supply by 2035. Today’s pipeline of brownfield projects is healthy, and we see many high-quality options, particularly in Chile.
Brownfield life extensions and expansions benefit from existing infrastructure, facilities, workforce and knowledge, and usually face lower technical risk and uncertainty. However, they are not immune to changing regulatory and community expectations and standards. This can lead to increasing capital intensities, permitting delays and complexities where existing permits do not cover the full life of the project.
Our recent review of global project capital intensities shows a steady increase in brownfield capital intensity since 2010. When we look at the region with the strongest pipeline of brownfield projects – Latin America – average brownfield capital intensities for the projects sampled show a ~65% increase during that period (in 2024 real dollars), and since 2020, they have approached similar levels to greenfield projects.15
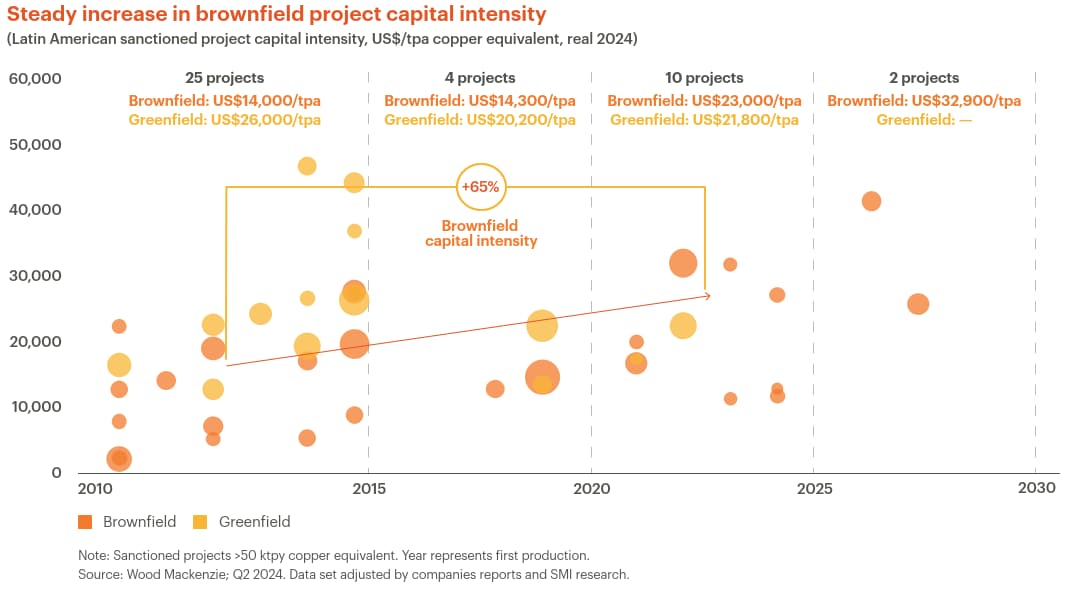
Our view is that while this increase has been driven by a number of factors, including higher costs for and availability of inputs (e.g. material and labour cost increases, supply chain constraints, skilled labour shortages, and Covid-19 effects), a major factor is that copper producers are, in general, simply building ‘better’ mines (e.g. incorporating newer technologies and addressing higher standards for health, safety and environmental performance).
Despite these cost challenges, we expect high-quality brownfield projects to be prized in the industry in the face of growing copper demand. While their historic cost advantages over greenfield projects are less guaranteed today than in the past, the experience, technical capability developed through years of production and detailed ore body knowledge remain as major advantages, particularly when it comes to more complex projects.
Greenfield projects continue to attract significant excitement and interest from developers and investors. They can avoid the challenges of aging facilities and grade decline and can unlock large and higher-grade copper deposits, develop new frontiers, and allow for the application of technology advances without the challenge of retrofitting.
But they also have potentially even greater challenges to brownfield developments, such as long lead times with environmental and social concerns needing to be navigated for the first time, and uncertainties associated with new jurisdictions or regions. And not all problems can be solved with money. For some projects, it is not a question of investability, but of executability.
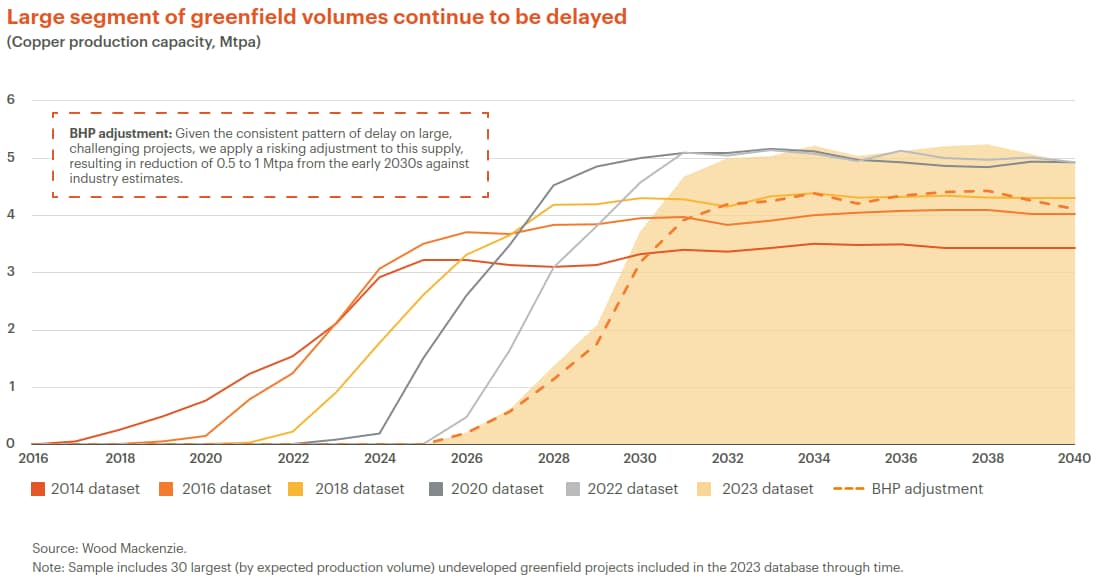
The current pipeline of ‘all possible’ greenfield deposits are generally at the higher-difficulty end of the spectrum – and many are experiencing delays. When we investigated a selection of today’s 30 largest (by expected production volume) undeveloped greenfield projects, we found that analysts (ourselves included) had continually moved the forecast supply stack out in time. We expect these projects to contribute around 5 Mtpa of copper by 2035, or 14% of total possible supply.
Start dates for more than 20 of these projects have shown a consistent pattern of delay since 2014, and all have been delayed in forecasts made from 2020 onwards. In 2014, the majority of these projects were forecast to be in operation by now. Given this trend, we now apply a risking adjustment to these projects, which removes between 0.5 to 1 Mtpa from our copper production forecast from 2030 onwards.
Those that have managed to eventually come online have still seen significant challenges on the journey. Copper mega projects (i.e. those with a capital cost more than US$5 billion) have experienced significant delays and cost overruns (e.g. QB2 and Oyu Tolgoi).
African greenfield projects, backed largely by Chinese investment, have been the exception to this global trend, delivering a 90% increase in copper production over the last decade at highly competitive capital intensities and execution rates. African deposits also make up eight out of the 10 highest grade deposits discovered since 1990. But in contrast to the porphyry-style deposits common in Latin America, in which mineralisation decreases gradually, African deposits tend to be ‘sediment hosted’, meaning mineralisation is more concentrated with sharp boundaries. This difference drives a more pronounced depletion in our African forecast. However, given recent trends in both discovery and development, we have revised upward our forecasts of expected volumes from the African region, including volumes related to projects or deposits that might, in other regions, be considered immature or insufficiently progressed to include in the forecast.
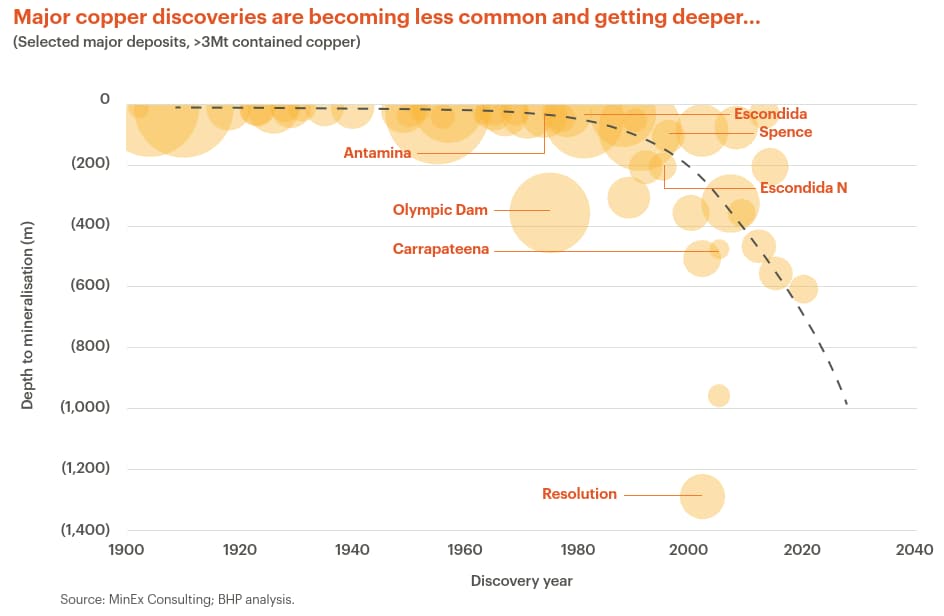
Despite the potential contribution from African copper, on balance, new greenfield supply globally will struggle to enter the market quickly and cheaply. This is exacerbated by a slowing rate of discoveries and the relatively long average time from discovery to production (17 years in 2023), which is making it less likely that greenfield developments will be able to respond to the strong demand signals.
According to S&P Global Market Intelligence’s most recent annual copper discovery report, there were:
…239 copper deposits discovered between 1990 and 2023… we have recorded only four discoveries from the past five years (2019–2023), totalling 4.2 Mt of copper… Discoveries from the past decade account for just 14 of the 239 deposits included in the analysis.16
Capital availability is the other hurdle for copper developers. While challenging to model, given the project-specific nature, we estimate the total bill for all expansion capex from 2025-2034 to be around a quarter of a trillion US dollars (in 2024 real dollars). This represents a significant increase from the previous 10 years, where the total spend on copper projects was approximately US$150 billion.
In the 1990s and 2000s we saw the impact of Japanese and western investments into copper around the globe, and we have seen significant Chinese investment into African copper projects in the past decade. Political support has often accompanied such investments (in various forms), and sovereign interest in copper from other regions is growing, most notably from the Middle East and with renewed interest from the United States. Given copper’s essential role in economic growth, the energy transition and digital transformation, we would expect sovereign interest and investment to continue to play a role in future copper projects.
Taking all of these supply factors into account, we expect currently operating mines will need to work harder for longer, and both brownfield and greenfield projects will face cost and schedule headwinds, arising from skilled labour shortages, project complexity and higher ESG standards. Companies that can best navigate and adapt to these challenges, are experienced in managing more complex projects, and have solid social value credentials and a strong balance sheet will win.
The copper price is driven by many factors, such as economic growth, investor sentiment, industrial activity, inventory levels, production costs, exchange rates, interest rates and geopolitical events. In the short term, the price is sensitive to changes in demand and supply, as well as to market sentiment and speculation, which can create price spikes or slumps.17
However, in the long term, the copper price is more determined by the fundamental supply and demand trends and drivers of the market, such as those we have set out in this blog. To narrow in on potential long-term pricing ranges, we prefer the long-run marginal cost (LRMC)-based inducement model, which seeks to identify the marginal unit of supply that will meet demand in the future, and what it will cost. It assumes new supply will be induced by a price signal that provides a sufficient return for the project. It uses a queue of projects that are ranked by their competitiveness and brings them on until future demand is met. It is the most reliable and consistent method for projecting the trend price of copper over long time periods, based on the fundamentals of demand and supply.18
The bullish drivers of demand (balanced by the forces of scrap, substitution and thrifting) present a huge task for copper miners. There is a shortage of ‘easy’ projects to replace existing supply and meet this growing copper demand. The projects that are available face new and increasing challenges that we believe will be reflected in their costs, and consequently, in the price required to incentivise their development. We think the price setting marginal tonne will come from either a lower-grade brownfield expansion in a mature jurisdiction, or a higher-grade greenfield in a higher risk and/or emerging jurisdiction. None of these sources of metal is likely to come cheaply, easily, or unfortunately— promptly.
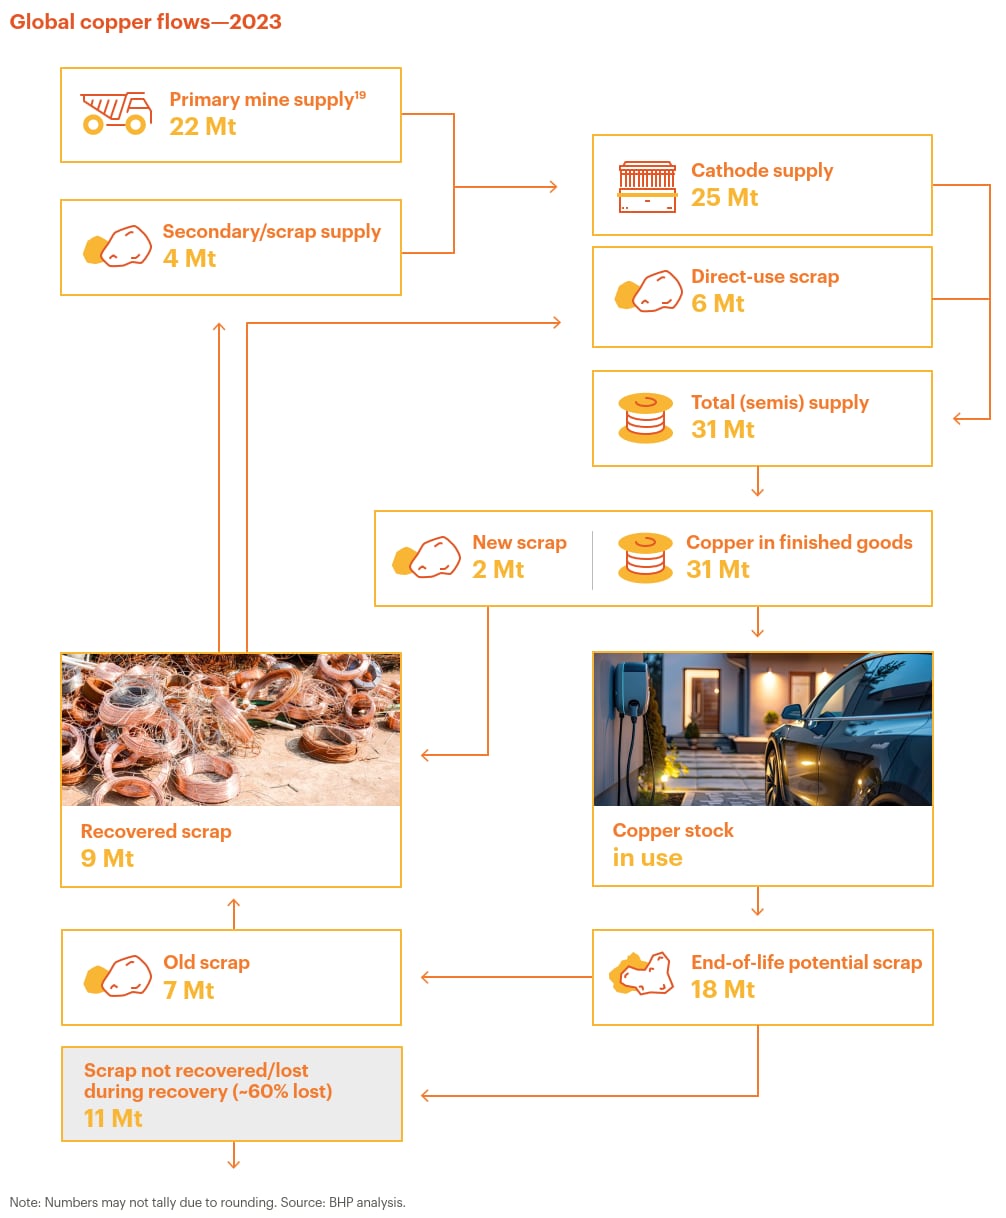
The chart below summarises the flow of copper units from mine through end-of-life capital stock.
This article contains forward–looking statements, which involve risks and uncertainties. Forward-looking statements include all statements other than statements of historical or present facts, including: statements regarding: trends in commodity prices and currency exchange rates; demand for commodities; global market conditions; guidance; reserves and resources and production forecasts; expectations, plans, strategies and objectives of management; our expectations, commitments, targets, goals and objectives with respect to social value or sustainability; climate scenarios; approval of certain projects and consummation of certain transactions; closure, divestment, acquisition or integration of certain assets, operations or facilities (including associated costs or benefits); anticipated production or construction commencement dates; capital expenditure or costs and scheduling; operating costs, and supply of materials and skilled employees; anticipated productive lives of projects, mines and facilities; the availability, implementation and adoption of new technologies; provisions and contingent liabilities; and tax, legal and other regulatory developments.
Forward–looking statements may be identified by the use of terminology, including, but not limited to, ‘intend’, ‘aim’, ‘ambition’, ‘aspiration’, ‘goal’, ‘target’, ‘prospect’, ‘project’, ‘plan’, ‘pathway’, ‘objective’, ‘see’, ‘anticipate’, ‘estimate’, ‘believe’, ‘expect’, ‘commit’, ‘ensure’, ‘may’, ‘should’, ‘intend’, ‘need’, ‘must’, ‘will’, ‘would’, ‘continue’, ‘forecast’, ‘guidance’, ‘outlook’, ‘trend’ or similar words.
These statements discuss future expectations or performance, or provide other forward-looking information and are based on the information available as at the date of this article and/or the date of BHP’s scenario analysis processes. BHP cautions against reliance on any forward–looking statements or guidance.
Additionally, forward–looking statements in this article do not represent guarantees or predictions of future financial or operational performance, and involve known and unknown risks, uncertainties, and other factors, many of which are beyond our control, and which may cause actual results to differ materially from those expressed in the statements contained in this article.
There are inherent limitations with scenario analysis, and it is difficult to predict which, if any, of the scenarios might eventuate. Scenarios do not constitute definitive outcomes for us. Scenario analysis relies on assumptions that may or may not be, or prove to be, correct and may or may not eventuate, and scenarios may be impacted by additional factors to the assumptions disclosed.
Except as required by applicable regulations or by law, BHP does not undertake to publicly update or review any forward–looking statements, whether as a result of new information or future events. Past performance cannot be relied on as a guide to future performance.
Nothing in this article should be construed as either an offer or a solicitation of an offer to buy or sell BHP securities, or a solicitation of any vote or approval, in any jurisdiction, or be treated or relied upon as a recommendation or advice by BHP. No offer of securities shall be made in the United States absent registration under the U.S. Securities Act of 1933, as amended, or pursuant to an exemption from, or in a transaction not subject to, such registration requirements.
The views expressed in this article contain information that has been derived from publicly available sources that have not been independently verified. No representation or warranty is made as to the accuracy, completeness, or reliability of the information. This article should not be relied upon as a recommendation or forecast by BHP.
In this article, the terms ‘BHP’, the ‘Company’, the ‘Group’, ‘BHP Group’, ‘our business’, ‘organisation’, ‘we’, ‘us’ and ‘our’ refer to BHP Group Limited and, except where the context otherwise requires, our subsidiaries. Refer to the ‘Subsidiaries’ note to the Financial Statements in the BHP Annual Report for a list of our significant subsidiaries. Those terms do not include non–operated assets.
1 Data and events referenced in this article are current as of September 2024.
2 Some aggressive decarbonisation scenarios come in 10 to 15 percentage points higher in terms of end-use electrification than we are assuming in the base case. For a full list of deep decarbonisation scenarios that we track, see BHP’s Climate Transition Action Plan 2024 Additional information (page 62).
3 Forecast developed prior to the recent slowdown in EV adoption (ex-China). While the pace of adoption of EVs may underwhelm in the short term, the rationale for electrified transport remains compelling in the long run.
4 Offshore wind requires around 11 tonnes of copper per megawatt, or over 5 times as much as gas-fired power which uses around 2 tonnes per megawatt. Onshore wind and solar are also more copper-intensive, at around 1.7 and 1.4 times, respectively. In addition, the capacity factors of wind and solar power are generally lower than fossil power, which means you need to install more renewable power capacity to generate the same amount of electricity.
5 We estimate copper use in data centres (including those used for cryptocurrency and AI) to be around half a million tonnes of copper today, rising to around three million tonnes in 2050.
6 Note that Copper in power grids is counted under Traditional in the above splits.
7 Ratio of monthly average of LME Cash Settlement Price for Copper and Aluminium.
8 Global average CO2 footprint (CRU, 2021). Copper: ~4t CO2/t metal. Aluminium: ~13t CO2/t metal.
9 For more detail on the volumes of flows in the copper value chain, see the appendix
10 Please see the appendix for details of the copper cycle.
11 Examples of policies that, while potentially positive in the long run, we believe have hindered/are hindering scrap use in the short term: China’s Operation National Sword and recent review of tax and rebates (‘Fair Competition Review’), EU’s Regulation on Waste Shipments and Critical Raw Materials Act.
12 This assumption is underpinned by EV battery recycling targets, but also requires broader improvement in collection/recovery rates across end uses. This will necessitate changes in consumer behaviour (many consumer goods end up in landfill), as well as improvements in scrap processing and metal recovery. Recycling in many cases is labour and/or opex intensive. Current recycling rates are arguably a reflection of what is economic at current prices, so ‘carrot and stick’ policies will likely be required to alter behaviour and lift these rates.
13 The 10 Mtpa requirement considers: growth in primary copper demand, as well as reductions in current mine supply due to grade decline and resource depletion, and additional consideration for supply disruptions and metallurgical losses. The figure also includes mine life extensions for some currently operating mines.
14 This assumes mine life extensions and probable brownfield projects.
15 Wood Mackenzie; Q2 2024. Data set adjusted by companies reports and BHP analysis, inclusive of sanctioned projects >50 ktpa copper equivalent.
16 https://www.spglobal.com/marketintelligence/en/news-insights/research/new-major-copper-discoveries-sparse-amid-shift-away-from-early-stage-exploration
17 Refer to our 2024 Economic and Commodity Outlook for more details.
18 We recognise that LRMC has some limitations, such as being less helpful for the short and medium term, as it does not capture the cyclical and structural factors that can affect the price. This method is also sensitive to the exogenous assumptions that are imposed, such as the macroeconomic and financial variables, the return thresholds for projects, and the discrete decisions on project inducement. We also recognise that this method does not account for the possibility of price disconnecting from the cost curve, due to extreme tightness or scarcity in the market. Therefore, we also use other methods and models, such as cost-plus, historical average, substitution, probabilistic, and econometric, to complement and cross-check our price forecasts, and to generate alternative price scenarios and ranges to reflect the uncertainty and variability of the market.
Silver price (XAG/USD) extends its downside below $32.00 in Monday’s European session. The white metal weakens as the US bond yields rise further, given that the likelihood of the Federal Reserve (Fed) delivering another larger-than-usual 50 basis points (bps) interest rate cut in November has gone off the table.
10-year US Treasury yields jump slightly above 4%. Higher yields on interest-bearing assets reduce the opportunity cost of holding an investment in non-yielding assets, such as Silver. The US Dollar Index (DXY), which tracks the Greenback’s value against six major currencies, clings to gains near 102.50.
However, the Silver is unlikely to turn extremely bearish amid growing tensions between Iran and Israel. Historically, geopolitical tensions improve demand for precious metals as a safe haven.
Market speculation for Fed large rate cuts waned after the United States (US) employment report for September showed strong labor demand and robust wage growth. Traders are pricing a Fed 25 bps interest rate cut in November, according to the CME FedWatch tool.
Upbeat labor market data has diminished fears of an economic slowdown, which forced traders to be bet for a second consecutive 50 bps interest rate cut in September.
Going forward, the next move in the Silver price will be influenced by the US Consumer Price Index (CPI) data for September, which will be published on Thursday. Economists expect the core CPI – which excludes volatile food and energy prices – to have grown steadily by 3.2%.
Silver price continues to face pressure near the horizontal resistance plotted from the May 20 high of $32.50 on a daily timeframe. The white metal strives for more upside as the outlook is upbeat due to upward-sloping 20 and 50-day Exponential Moving Averages (EMAs), which trade around $31.00 and $30.00, respectively.
The 14-day Relative Strength Index (RSI) remains in the bullish range of 60.00-80.00, suggesting more upside ahead.
Silver is a precious metal highly traded among investors. It has been historically used as a store of value and a medium of exchange. Although less popular than Gold, traders may turn to Silver to diversify their investment portfolio, for its intrinsic value or as a potential hedge during high-inflation periods. Investors can buy physical Silver, in coins or in bars, or trade it through vehicles such as Exchange Traded Funds, which track its price on international markets.
Silver prices can move due to a wide range of factors. Geopolitical instability or fears of a deep recession can make Silver price escalate due to its safe-haven status, although to a lesser extent than Gold’s. As a yieldless asset, Silver tends to rise with lower interest rates. Its moves also depend on how the US Dollar (USD) behaves as the asset is priced in dollars (XAG/USD). A strong Dollar tends to keep the price of Silver at bay, whereas a weaker Dollar is likely to propel prices up. Other factors such as investment demand, mining supply – Silver is much more abundant than Gold – and recycling rates can also affect prices.
Silver is widely used in industry, particularly in sectors such as electronics or solar energy, as it has one of the highest electric conductivity of all metals – more than Copper and Gold. A surge in demand can increase prices, while a decline tends to lower them. Dynamics in the US, Chinese and Indian economies can also contribute to price swings: for the US and particularly China, their big industrial sectors use Silver in various processes; in India, consumers’ demand for the precious metal for jewellery also plays a key role in setting prices.
Silver prices tend to follow Gold’s moves. When Gold prices rise, Silver typically follows suit, as their status as safe-haven assets is similar. The Gold/Silver ratio, which shows the number of ounces of Silver needed to equal the value of one ounce of Gold, may help to determine the relative valuation between both metals. Some investors may consider a high ratio as an indicator that Silver is undervalued, or Gold is overvalued. On the contrary, a low ratio might suggest that Gold is undervalued relative to Silver.
Spot Gold’s consolidative phase continued throughout the first half of Monday after the noisy United States (US) Nonfarm Payrolls (NFP) report released last Friday. XAU/USD found near-term demand at the beginning of the week as Middle East tensions undermined the market’s mood. Nevertheless, the bright metal turned south early in the American session, as the US Dollar benefits from solid US data supporting the case for a slow pace of interest rate cuts.
The Federal Reserve (Fed) kick-started its monetary loosening cycle with a 50 basis points (bps) interest rate cut in September, prompting bets of similar moves coming in the near term. However, stronger-than-anticipated employment-related data cooled such concerns. The US Dollar recovered its poise and lost its bearish way, as investors no longer fear a recession, not even a soft landing in the foreseeable future.
The macroeconomic calendar had nothing relevant to offer at the beginning of the week, but it will feature the US Consumer Price Index (CPI) and the Federal Open Market Committee (FOMC) Meeting Minutes. Inflation has cooled enough to push the Fed into monetary loosening, and unless the figures bring an unexpected surprise, the US central bank is expected to keep tightening at a slow yet constant pace. As for FOMC Minutes, the document will likely have a limited impact on financial markets, as all has been said and done in the September Fed’s announcement and the Summary of Economic Projections (SEP) released alongside.
The daily chart for XAU/USD shows the pair is pressuring the base of a near-term wedge but holding within the figure. The pair is also developing above all its moving averages, with the 20 Simple Moving Average (SMA) heading firmly north at around $2,616. The 100 and 200 SMAs maintain their bullish slopes, yet roughly $200 below the shorter one. Finally, the Momentum indicator turned flat within positive levels, while the Relative Strength Index (RSI) indicator aims lower at around 63, correcting overbought conditions and far from supporting another leg south.
The near-term picture is neutral-to-bearish, although a slide below the $2,638 region is required to confirm a continued slide. A mildly bearish 20 SMA provides intraday resistance at around $2,652, while technical indicators develop within negative levels, although lacking clear directional strength. On a positive note, the 100 and 200 SMAs maintain their upward slopes below the current level, suggesting buyers have paused but not yet given up.
Support levels: 2,638.10 2,624.50 2,616.00
Resistance levels: 2,652.10 2,663.00 2,673.20
Access proprietary mining insights, investment research, and third-party news sources from Dow Jones Newswires, and Nikkei News. Our comprehensive, real-time global mining news integrates financial and industry-specific data in our articles so you can easily turn information into actionable insights. Our mining news is accessible on web and mobile platforms, news feeds, and email alerts. Our topics range from operations and strategy, mergers and acquisitions, capital markets, ESG, and project developments in the mining industry.
Platinum price seasonality has outspoken cycles and dynamics. These 5 platinum seasonality charts learn that March/April as well as December are consistently strong months. Will 2024 show a year-end really consistent with previous years? There is one concern in 2024…
RELATED – A Platinum Price Prediction For 2025
By analyzing historical data and recent performance, one can identify key months for potential gains and periods where caution is warranted.
In this article, we analyze the seasonality of platinum prices using several charts that cover different time frames, from the long-term 50-year trends to the recent years.
Additionally, we compare platinum’s seasonality with silver to provide a broader context for precious metals investors.
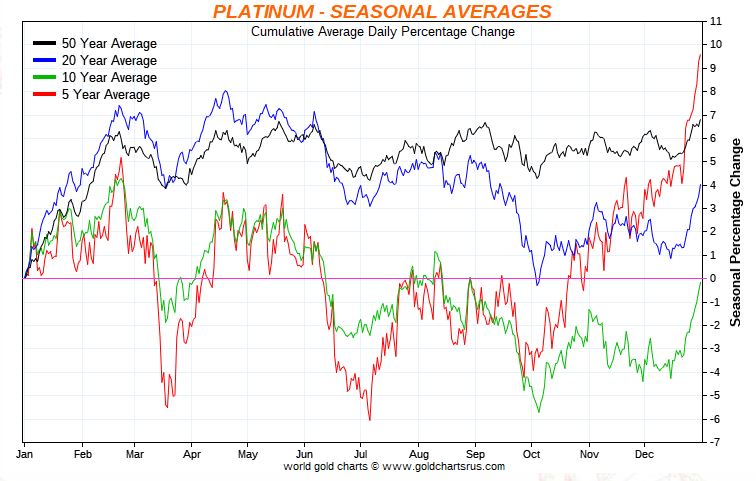
The 50-year platinum price seasonality chart provides an extensive historical perspective, highlighting average price trends throughout the year.
Revealed insights: The long-term seasonality suggests two main periods for potential gains—early in the year (January to March) and later in the year (July to September). The mid-year period often indicates caution or consolidation.
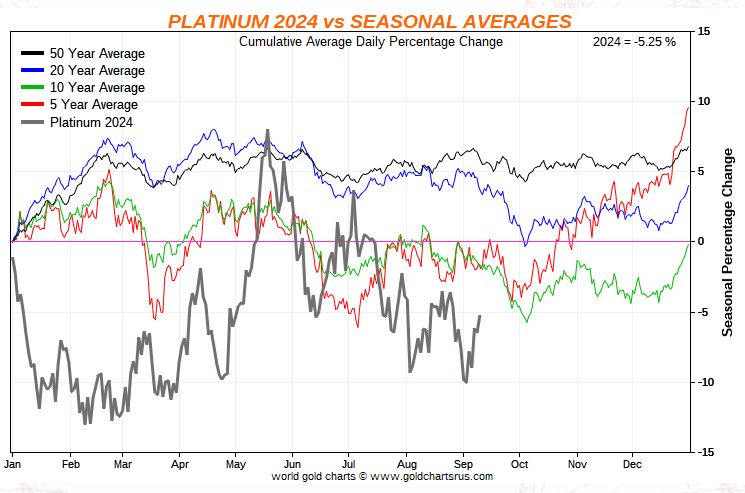
This chart compares the 50-year average seasonality with the specific performance of platinum in 2024.
Revealed Insights: The sharp divergence early in 2024 highlights potential market-specific factors affecting platinum prices, diverging from historical trends. This requires investors to be cautious about relying solely on seasonality for early 2025 predictions.
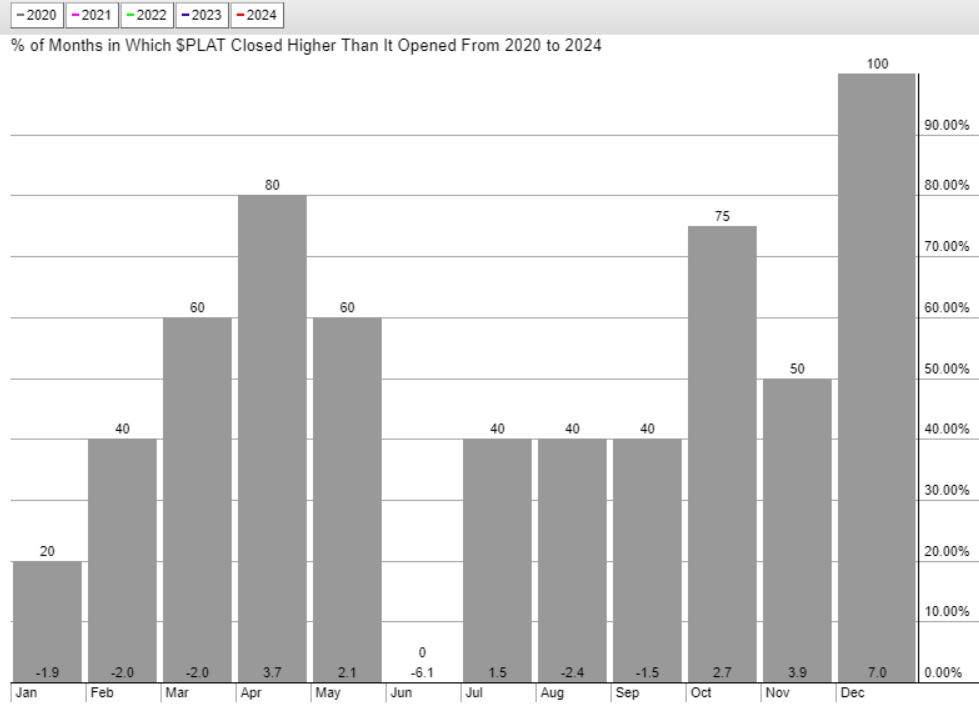
This chart illustrates platinum’s monthly performance from 2020 to 2024, showing the percentage of months when platinum closed higher than it opened.
Revealed insights: The recent 4-year period confirms strong performance in March/April and December. These months could present reliable opportunities for gains, aligning partially with the long-term trends and highlighting their importance for traders.
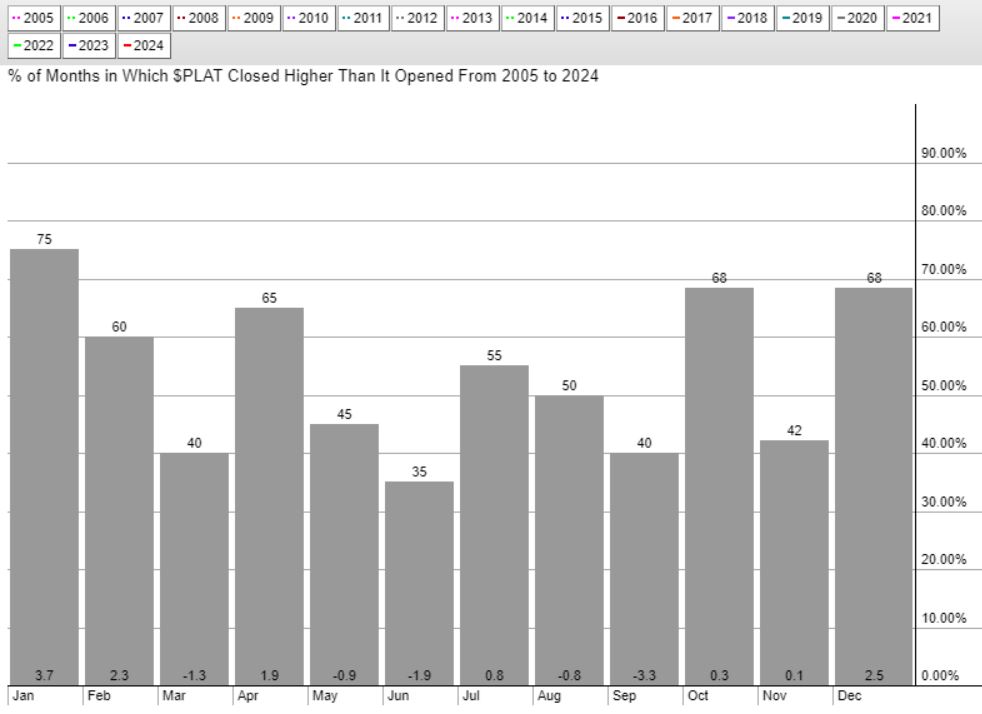
Covering the 19-year period from 2005 to 2024, this chart provides a longer-term perspective on platinum’s seasonality.
Revealed Insights: The extended period from 2005 to 2024 aligns with some of the 50-year trends but shows more variability. This underlines the importance of focusing on strong months (January, April, October, December) for potential gains while being cautious during mid-year months.
In this section, we compare the insights we derived from our silver price seasonality with the ones in this article related to platinum price seasonality.
Early and late-year strength: Both platinum and silver show strong seasonality early (January to March for platinum, January to February for silver) and late in the year (September to December). These similarities suggest both metals may be influenced by common seasonal demand factors.
Mid-year weakness: Both metals exhibit weakness mid-year (June to July for platinum, June for silver), indicating a consistent seasonal pattern.
Divergence in recent years: Platinum’s early-year weakness in 2024 contrasts with silver, which did not show a sharp divergence. This could imply that platinum is currently more sensitive to specific market conditions or economic factors compared to silver.
There are 3 conclusions that we take away from the platinum seasonality charts:
By understanding these seasonality conclusions, platinum investors can better handle the platinum market.
Gold price is in the red at the start of a new week on Monday but stays within a familiar range at around $2,650. Amidst the persistent Middle East geopolitical escalation, Gold price now shifts its attention to speeches from US Federal Reserve (Fed) policymakers on Monday, anticipating the critical US Consumer Price Index (CPI) data later in the week.
Gold price fails to benefit from a US Dollar (USD) pullback from seven-week highs against its major rivals. Risk flows remain in vogue on expectations of more stimulus coming through from China, as traders return after a week-long holiday break. The extended risk appetite into Asia weighs on the safe-haven assets such as the Gold price, the US Dollar, US government bonds etc.
Softer US Treasury bond yields also add to the weight on the Greenback, unable to motivate Gold buyers, as the People’s Bank of China (PBOC), the Chinese central bank, reported no Gold reserves purchases for the fifth straight month in September on Monday. China is the world’s top Gold consumer.
The main catalyst behind the softer undertone in Gold price so far this month is the fading expectations of a 50 basis points (bps) interest rate cut by the Fed next month. This less dovish turn in sentiment surrounding the Fed was accentuated after Friday’s blockbuster Nonfarm Payrolls data, which totally ruled out an outsized Fed rate cut probability for November.
Data published by the US Bureau of Labor Statistics (BLS) on Friday showed that Nonfarm Payrolls rose by 254,000 in September after gaining 159,000 (revised from 142,000) in August. The reading outpaced the market expectation of 140,000 by a wide margin. The annual wage inflation, as measured by the change in Average Hourly Earnings, edged a tad higher to 4% from 3.9% in August.
Markets are currently pricing in about a 94% chance that the Fed will opt for a 25 bps rate cut at its next meeting, the CME Group’s FedWatch Tool shows, with a 6% probability of a no rate change decision.
However, Gold price has managed to keep its corrective downside restricted, thanks to the persistent geopolitical risks emanating from the escalating conflict between Israel and Iran. On Sunday evening, the Israel Defense Forces (IDF) said it struck multiple Hezbollah targets in Beirut, including Hezbollah’s intelligence headquarters. In retaliation, Hezbollah said it also launched a barrage of rockets at northern Israel Sunday night.
Mounting fears of the Israel-Iran conflict turning into a wider regional war in the Middle East remain a cause for concern for global markets. Gold traders, therefore, look forward to upcoming Fedspeak for further trading impetus in the lead-up to the main event risk for this week – the US consumer inflation data for September.
Despite the sluggish Gold price action recently, buyers refuse to give up as long as the static support of $2,630 holds the fort.
The 14-day Relative Strength Index (RSI) also stays well above the midline, currently near 64, backing the bullish potential.
Gold price, however, needs a daily candlestick closing above the strong resistance near $2,670 to revive the uptrend.
The next resistance is aligned at the record high of $2,686. Further up, buyers will target the $2,700 round level.
On the flip side, acceptance below the intermittent low near $2,630 is critical to unleashing further downside toward the $2,600 threshold.
Ahead of that level, the 21-day Simple Moving Average (SMA) at $2,609 will test bullish commitments.
Gold has played a key role in human’s history as it has been widely used as a store of value and medium of exchange. Currently, apart from its shine and usage for jewelry, the precious metal is widely seen as a safe-haven asset, meaning that it is considered a good investment during turbulent times. Gold is also widely seen as a hedge against inflation and against depreciating currencies as it doesn’t rely on any specific issuer or government.
Central banks are the biggest Gold holders. In their aim to support their currencies in turbulent times, central banks tend to diversify their reserves and buy Gold to improve the perceived strength of the economy and the currency. High Gold reserves can be a source of trust for a country’s solvency. Central banks added 1,136 tonnes of Gold worth around $70 billion to their reserves in 2022, according to data from the World Gold Council. This is the highest yearly purchase since records began. Central banks from emerging economies such as China, India and Turkey are quickly increasing their Gold reserves.
Gold has an inverse correlation with the US Dollar and US Treasuries, which are both major reserve and safe-haven assets. When the Dollar depreciates, Gold tends to rise, enabling investors and central banks to diversify their assets in turbulent times. Gold is also inversely correlated with risk assets. A rally in the stock market tends to weaken Gold price, while sell-offs in riskier markets tend to favor the precious metal.
The price can move due to a wide range of factors. Geopolitical instability or fears of a deep recession can quickly make Gold price escalate due to its safe-haven status. As a yield-less asset, Gold tends to rise with lower interest rates, while higher cost of money usually weighs down on the yellow metal. Still, most moves depend on how the US Dollar (USD) behaves as the asset is priced in dollars (XAU/USD). A strong Dollar tends to keep the price of Gold controlled, whereas a weaker Dollar is likely to push Gold prices up.
Gold (XAU/USD) struggled to make a decisive move in either direction this week as the broad-based US Dollar (USD) strength offset the increasing safe-haven demand for the precious metal. Developments surrounding the conflict in the Middle East and US inflation data could drive XAU/USD’s action next week.
Gold started the new week under bearish pressure and lost nearly 1% on Monday. While speaking at the National Association for Business Economics Annual Meeting, Federal Reserve (Fed) Chairman Jerome Powell refrained from providing any fresh hints regarding the next policy step. Powell reiterated that risks are two-sided and that they will take policy decisions on a meeting-by-meeting basis. “The Fed is not in a hurry to cut rates quickly, will be guided by data,” he added. These comments allowed the USD to hold its ground and forced XAU/USD to stay on the back foot.
Although the USD preserved its strength on Tuesday after the US Bureau of Labor Statistics (BLS) reported that the JOLTS Job Openings rose to 8.04 million in August from 7.71 million in July, Gold benefited from escalating geopolitical tensions and gained over 1% to erase all of Monday’s losses. Reports of the Israeli army mounting a ground invasion of Lebanon revived fears over a deepening and widening conflict in the Middle East.
Early Wednesday, news of Iran firing about 200 ballistic missiles on Israel and Israel vowing to retaliate against the attack helped Gold find demand. Israel’s Prime Minister Benjamin Netanyahu said that Iran had made a “big mistake” and “will pay,” further escalating tensions. As the USD recovery picked up steam in the second half of the day, however, XAU/USD struggled to gather bullish momentum and closed the day little changed. The Automatic Data Processing (ADP) reported that employment in the private sector rose by 143,000 in September, surpassing the market expectation of 120,000 and supporting the USD.
The data published by the Institute for Supply Management (ISM) showed on Thursday that the business activity in the service sector continued to expand at an accelerating pace in September, with the ISM Services Purchasing Managers Index (PMI) improving to 54.9 from 51.5 in August. The USD capitalized on this report and made it difficult for Gold to rebound.
On Friday, the BLS announced that Nonfarm Payrolls (NFP) rose by 254,000 in September, surpassing the market expectation of 140,000 by a wide margin. Additionally, August’s NFP growth of 142,000 was revised higher to 159,000. Other details of the employment report showed that the Unemployment Rate edged lower to 4.1%, while the annual wage inflation, as measured by the change in the Average Hourly Earnings, ticked up to 4% from 3.9% in August. Gold failed to stage a rebound after upbeat US labor market data.
The US economic calendar will not offer any high-tier macroeconomic data releases in the first half of next week. On Wednesday, The Fed will release the minutes of the September policy meeting.
Investors will scrutinize the discussions surrounding the decision to lower the policy rate by 50 basis points (bps). In case the publication reveals that policymakers preferred a large reduction in the interest rate as a first step to a gradual policy-easing, rather than as a response to growing signs of cooling conditions in the labor market, the immediate reaction could boost the USD. The CME Group FedWatch Tool shows that markets are still pricing in a more than 30% probability that the Fed will opt for one more 50 bps cut at the next policy meeting in November, suggesting that the USD has more room on the upside if investors lean toward a 25 bps cut.
On the flip side, the USD could come under pressure and allow Gold to turn north if the minutes reflect that policymakers will keep an open mind about additional big rate cuts in case data points to an economic downturn or a worsening labor market outlook.
On Thursday, the BLS will release the Consumer Price Index (CPI) data for September. The monthly core CPI reading, which excludes prices of volatile items and is not distorted by base effect, could trigger a reaction in Gold. Markets expect the core CPI to rise 0.2% in September, following the 0.3% increase recorded in August. A reading of 0.2%, or smaller, could weigh on the USD. While an increase of 0.5% or more could cause investors to doubt the disinflation process and lift the USD, causing XAU/USD to turn south.
Market participants will also pay close attention to headlines coming out of the Middle East. If the crisis deepens with Israel retaliating against Iran and Iran not taking a step back, Gold could continue to take advantage of the safe-haven demand.
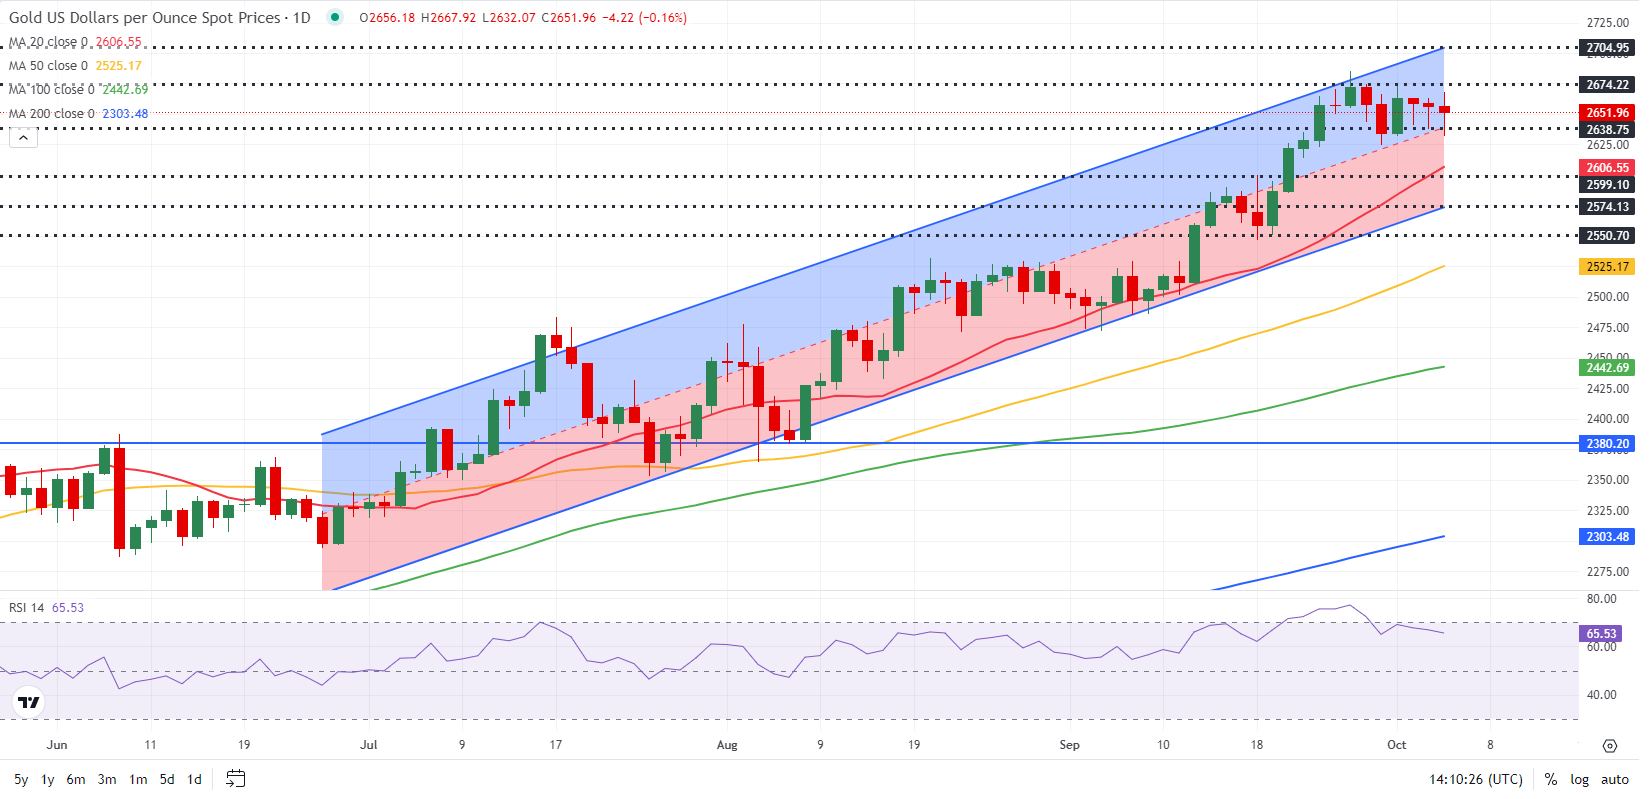
The Relative Strength Index (RSI) indicator on the daily chart retreated slightly below 70, reflecting sellers’ reluctance to bet on an extended decline. On the downside, the mid-point of the ascending regression channel coming from late June forms first support at $2,640. In case this level fails, the next support could be seen at $2,605-$2,600 (20-day Simple Moving Average (SMA), static level) before $2,575 (lower limit of the ascending channel).
Looking north, interim resistance seems to have formed at $2,675 (static level) ahead of $2,700-$2,705 (round level, upper limit of the ascending channel).
Gold has played a key role in human’s history as it has been widely used as a store of value and medium of exchange. Currently, apart from its shine and usage for jewelry, the precious metal is widely seen as a safe-haven asset, meaning that it is considered a good investment during turbulent times. Gold is also widely seen as a hedge against inflation and against depreciating currencies as it doesn’t rely on any specific issuer or government.
Central banks are the biggest Gold holders. In their aim to support their currencies in turbulent times, central banks tend to diversify their reserves and buy Gold to improve the perceived strength of the economy and the currency. High Gold reserves can be a source of trust for a country’s solvency. Central banks added 1,136 tonnes of Gold worth around $70 billion to their reserves in 2022, according to data from the World Gold Council. This is the highest yearly purchase since records began. Central banks from emerging economies such as China, India and Turkey are quickly increasing their Gold reserves.
Gold has an inverse correlation with the US Dollar and US Treasuries, which are both major reserve and safe-haven assets. When the Dollar depreciates, Gold tends to rise, enabling investors and central banks to diversify their assets in turbulent times. Gold is also inversely correlated with risk assets. A rally in the stock market tends to weaken Gold price, while sell-offs in riskier markets tend to favor the precious metal.
The price can move due to a wide range of factors. Geopolitical instability or fears of a deep recession can quickly make Gold price escalate due to its safe-haven status. As a yield-less asset, Gold tends to rise with lower interest rates, while higher cost of money usually weighs down on the yellow metal. Still, most moves depend on how the US Dollar (USD) behaves as the asset is priced in dollars (XAU/USD). A strong Dollar tends to keep the price of Gold controlled, whereas a weaker Dollar is likely to push Gold prices up.
Silver price declined marginally on Friday, going down by 0.5 to trade at $31.87 at the time of writing on the heels of upbeat US labour market data. The greyish metal got rejected at $32.30 in its most recent ascent, but it will likely attempt another go at it as the geopolitical situation in the Middle East provides tailwinds.
US Non-Farm Payrolls numbers beat forecasts in September, coming in at 254k against the median forecast figure of 147k. Meanwhile, the August reading was revised upward from 142k to 159k, signaling a robust jobs situation. In addition, unemployment rate fell to 4.1 percent from August’s 4.2 percent which analysts had forecast to remain unchanged.
Solid jobs growth in the United States eases pressure on the Federal Reserve to cut interest rates by a deeper margin and puts pressure on dollar-denominated silver. With inflation subsiding significantly in recent months, the Fed will likely pay greater attention to the jobs market in its interest rate decision making.
That said, continued escalation of war in the Middle East and the fear sentiment surrounding it will provide safe haven demand for silver as investors seek to diversify their portfolio. Israel had sworn to retalliate Iran’s missile attack, and markets willl be on the edge as investors wait to see the direction the conflict takes. That could provide support for silver price in the near-term.
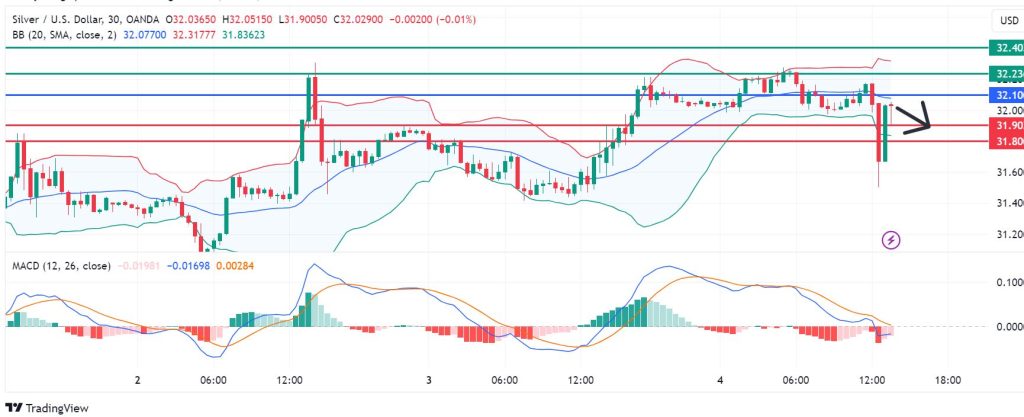
The momentum on silver price calls for further downside, with the MACD indicator line below the signal line. The pivot will likely be at 32.10, with the first support coming at 31.90. However, a stronger bearish momentum could breach that mark and send the price to test 31.80.
Alternatively, moving above 32.10 will favour the buyers, who could advance further to the first resistance at 31.90. However, if they manage to break above that mark, the downside narrative will be invalid, and the momentum could see the price move to the next barrier established at 31.80.