The main tag of Gold Price Articles.
You can use the search box below to find what you need.
[wd_asp id=1]
The main tag of Gold Price Articles.
You can use the search box below to find what you need.
[wd_asp id=1]
December arabica coffee (KCZ24) today is down -1.85 (-0.70%), and November ICE robusta coffee (RMX24) is down -72 (-1.35%).
Coffee prices are moving lower today as forecasts for rain in Brazil sparked long liquidation coffee futures. Today’s two-week Global Forecast System model showed rain is expected for Brazil’s coffee-growing regions next week during the all-important flowering period for Brazil’s coffee trees.
The downside in coffee prices is limited today after Conab, Brazil’s crop forecasting agency, cut its 2024 Brazil coffee production forecast to 54.8 million bags from 58.8 million bags forecast in May.
Strength in the Brazilian real (^USDBRL) is bullish for arabica coffee prices as the real rallied to a 1-month high against the dollar today, discouraging export selling from Brazil’s coffee producers.
On Monday, Dec arabica and Nov robusta posted contract highs, while nearest-futures (U24) robusta posted a new all-time high. Coffee prices have rallied sharply over the past week as adverse global weather events threaten coffee production. Brazil has been facing the driest weather since 1981, according to the natural disaster monitoring center Cemaden. Rainfall in Brazil has consistently been below normal since April, damaging coffee trees during the all-important flowering stage and reducing the prospects for Brazil’s 2025/26 arabica coffee crop. Somar Meteorologia reported Monday that Brazil’s Minas Gerais region received no rain over the past week. Minas Gerais accounts for about 30% of Brazil’s arabica crop. Also, robusta coffee has support after heavy rain from typhoon Yagi may have damaged Vietnam’s robusta coffee fields.
Robusta coffee prices are underpinned by fears that excessive dryness in Vietnam will damage coffee crops and curb future global robusta production. Vietnam’s agriculture department said on March 26 that Vietnam’s coffee production in the 2023/24 crop year dropped by -20% to 1.472 MMT, the smallest crop in four years, due to drought. The USDA FAS on May 31 projected that Vietnam’s robusta coffee production in the new marketing year of 2024/25 will dip slightly to 27.9 million bags from 28 million bags in the 2023/24 season. Last Wednesday, the General Department of Vietnam Customs reported that Vietnam’s August coffee exports fell -9.9% y/y to 76,214 MT and that Vietnam’s Jan-Aug coffee exports fell -12.1% y/y to 1.06 MMT.
Last Tuesday, Cecafe reported that Brazil’s Aug green coffee exports rose +1.4% y/y to 3.41 million bags. The rise in Brazil’s green coffee exports was consistent with other recent news showing higher exports. The Brazilian Trade Ministry reported on August 7 that Brazil’s July coffee exports rose +44% y/y to 202,000 MT. Also, Cecafe reported on July 11 that Brazil’s 2023/24 coffee exports rose +33% y/y to a record 47.3 million bags. On a global basis, the International Coffee Organization (ICO) reported on September 6 that global coffee exports rose +12.2% y/y in July to 11.29 million bags and that global exports during Oct-July rose +10.5% y/y to 115.01 million bags.
A rebound in ICE coffee inventories from historically low levels is negative for prices. Last Thursday, ICE-monitored arabica coffee inventories rose to a 1-1/2 year high of 858,474 bags, up from the 24-year low of 224,066 bags posted in November 2023. Also, ICE-monitored robusta coffee inventories on July 25 rose to a 1-year high of 6,521 lots, up from the record low of 1,958 lots posted in February 2024.
In a bearish factor, the International Coffee Organization (ICO) said on May 3 that 2023/24 global coffee production climbed +5.8% y/y to 178 million bags due to an exceptional off-biennial crop year. ICO also said global 2023/24 coffee consumption rose +2.2% y/y to 177 million bags, resulting in a 1 million bag coffee surplus.
The USDA’s bi-annual report on June 20 was bearish for coffee prices. The USDA’s Foreign Agriculture Service (FAS) projected that world coffee production in 2024/25 will increase +4.2% y/y to 176.235 million bags, with a +4.4% increase in arabica production to 99.855 million bags and a +3.9% increase in robusta production to 76.38 million bags. The USDA’s FAS forecasts that 2024/25 ending stocks will climb by +7.7% to 25.78 million bags from 23.93 million bags in 2023/24. The USDA’s FAS projects that Brazil’s 2024/25 arabica production would climb +7.3% y/y to 48.2 mln bags due to higher yields and increased planted acreage. The USDA’s FAS also forecasts that 2024/54 coffee production in Colombia, the world’s second-largest arabica producer, will climb +1.6% y/y to 12.4 mln bags.
More Coffee News from Barchart
On the date of publication,
did not have (either directly or indirectly) positions in any of the securities mentioned in this article. All information and data in this article is solely for informational purposes. For more information please view the Barchart Disclosure Policy
here.
The views and opinions expressed herein are the views and opinions of the author and do not necessarily reflect those of Nasdaq, Inc.
“Traders are looking for a clearer direction, and all eyes are on the upcoming US employment report, which could serve as the next major catalyst for gold prices,” stated Mark Ashford, senior market analyst at Global Commodities. “The dollar’s strength has been a major headwind for gold.”
The US dollar has been gaining ground, nearing a one-month high, as recent economic indicators paint a picture of a stable labor market. According to the US Department of Labor, unemployment claims rose slightly to 225,000 for the week ending September 28, up from 218,000 in the prior week.
Meanwhile, private-sector employment saw an unexpected increase in job openings for August, reinforcing the strength of the US labor market.
Additionally, the Institute for Supply Management (ISM) reported that its Non-Manufacturing PMI rose to 54.9 in September, its highest reading since February 2023.
The robust labor market data has tempered expectations for significant Fed rate cuts, further supporting the US dollar and creating headwinds for non-yielding assets like gold.
While gold’s safe-haven appeal is being reinforced by the uncertain geopolitical landscape, this has not yet been enough to push prices higher. Hezbollah’s recent launch of 230 projectiles from Lebanon into Israel and retaliatory Israeli airstrikes have heightened the risk of a broader regional conflict.
Silver price (XAG/USD) oscillates in a tight range near the crucial resistance of $32.00 in Friday’s European session. The white metal stays firm due to widening conflicts in the Middle East region between Israel and Iran-backed Hezbollah. Historically, the safe-haven appeal of precious metals improves amid geopolitical uncertainty.
In today’s session, the major trigger for the Silver price will be the United States (US) Nonfarm Payrolls (NFP) data for September, which will be published at 12:30 GMT. The official employment data will significantly influence market expectations for the Federal Reserve’s (Fed) interest rate outlook.
On September 18, the Fed pivoted to policy normalization with a larger-than-usual interest rate cut of 50 basis points (bps). After the Fed’s decision of jumbo rate cut, comments from Fed Chair Jerome Powell and his teammates have indicated that the central bank was more focused on reviving job growth amid confidence that price pressures are on track to return to the bank’s target of 2%.
The US NFP report is expected to show that 140K fresh payrolls were added, similar to 142K in August. The Unemployment Rate is seen steady at 4.2%. Investors will also focus on Average Hourly Earnings data, a key measure to wage growth, which is expected to have grown by 3.8% steadily year-on-year.
Meanwhile, the US Dollar Index (DXY), which tracks the Greenback’s value against six major currencies, edges lower but trades close to its two-week high around 102.00.
Silver price trades close to near the horizontal resistance plotted from May 20 high of $32.50 on a daily timeframe. The white metal strives for more upside as the outlook is upbeat due to upward-sloping 20 and 50-day Exponential Moving Averages (EMAs), which trade around $31.00 and $30.00, respectively.
The 14-day Relative Strength Index (RSI) remains in the bullish range of 60.00-80.00, suggesting more upside ahead.
Silver is a precious metal highly traded among investors. It has been historically used as a store of value and a medium of exchange. Although less popular than Gold, traders may turn to Silver to diversify their investment portfolio, for its intrinsic value or as a potential hedge during high-inflation periods. Investors can buy physical Silver, in coins or in bars, or trade it through vehicles such as Exchange Traded Funds, which track its price on international markets.
Silver prices can move due to a wide range of factors. Geopolitical instability or fears of a deep recession can make Silver price escalate due to its safe-haven status, although to a lesser extent than Gold’s. As a yieldless asset, Silver tends to rise with lower interest rates. Its moves also depend on how the US Dollar (USD) behaves as the asset is priced in dollars (XAG/USD). A strong Dollar tends to keep the price of Silver at bay, whereas a weaker Dollar is likely to propel prices up. Other factors such as investment demand, mining supply – Silver is much more abundant than Gold – and recycling rates can also affect prices.
Silver is widely used in industry, particularly in sectors such as electronics or solar energy, as it has one of the highest electric conductivity of all metals – more than Copper and Gold. A surge in demand can increase prices, while a decline tends to lower them. Dynamics in the US, Chinese and Indian economies can also contribute to price swings: for the US and particularly China, their big industrial sectors use Silver in various processes; in India, consumers’ demand for the precious metal for jewellery also plays a key role in setting prices.
Silver prices tend to follow Gold’s moves. When Gold prices rise, Silver typically follows suit, as their status as safe-haven assets is similar. The Gold/Silver ratio, which shows the number of ounces of Silver needed to equal the value of one ounce of Gold, may help to determine the relative valuation between both metals. Some investors may consider a high ratio as an indicator that Silver is undervalued, or Gold is overvalued. On the contrary, a low ratio might suggest that Gold is undervalued relative to Silver.
U.S. crude oil prices rose about 5% on Thursday, posting a third consecutive session of gains on fears that Israel could strike Iran’s oil industry in retaliation for Tehran’s ballistic missile attack this week.
President Joe Biden was asked by reporters Thursday morning whether the U.S. would support an Israeli strike on Iranian oil facilities. Biden said: “We’re discussing that. I think that would be a little – anyway.” The president added that “there’s nothing going to happen today.”
CNBC has reached out to the White House for comment.
Biden’s comments were the catalyst that moved prices higher, said Daniel Ghali, senior commodity strategist at TD Securities. “Geopolitical risks in the Middle East are probably at their highest levels since the Gulf War,” Ghali told CNBC.
The U.S. benchmark surged 5.5% earlier in the session to an intraday high of $73.99 per barrel. West Texas Intermediate is ahead about 8% this week, on pace for its best weekly gain since March 2023.
Here are Thursday’s closing energy prices:
The risk of oil supply disruptions increases as fighting in the Middle East intensifies, but OPEC+ is sitting on a large amount of spare crude that could step into the breach, according to Claudio Galimberti, chief economist at Rystad Energy.
“This spare capacity is for now preventing runaway prices amid one of the deepest and most pervasive crises in the Middle East in the past four decades,” Galimberti told clients in a Thursday note.
OPEC+ spare capacity would be sufficient to cover a disruption to Iran’s exports if Israel strikes the Islamic Republic’s oil infrastructure as retaliation for Tehran’s ballistic missile attack, said Bjarne Schieldrop, chief commodities analyst at the Swedish bank SEB.
The problem, however, is that the world’s spare oil capacity is heavily concentrated in the Middle East, particularly the Gulf states, and could also be at risk if a wider war breaks out, according to Ghali with TD Securities.
If Israel hits Iran’s oil industry, traders would begin to worry about supply disruptions in the Strait of Hormuz, Schieldrop said. “That would add a significant risk premium to oil,” he told CNBC’s “Street Signs Europe.” The strait is one of the most important trade arteries for oil in the world.
As a consequence, oil prices could surge to $200 per barrel if Israel hits Iran’s oil infrastructure, Schieldrop said.
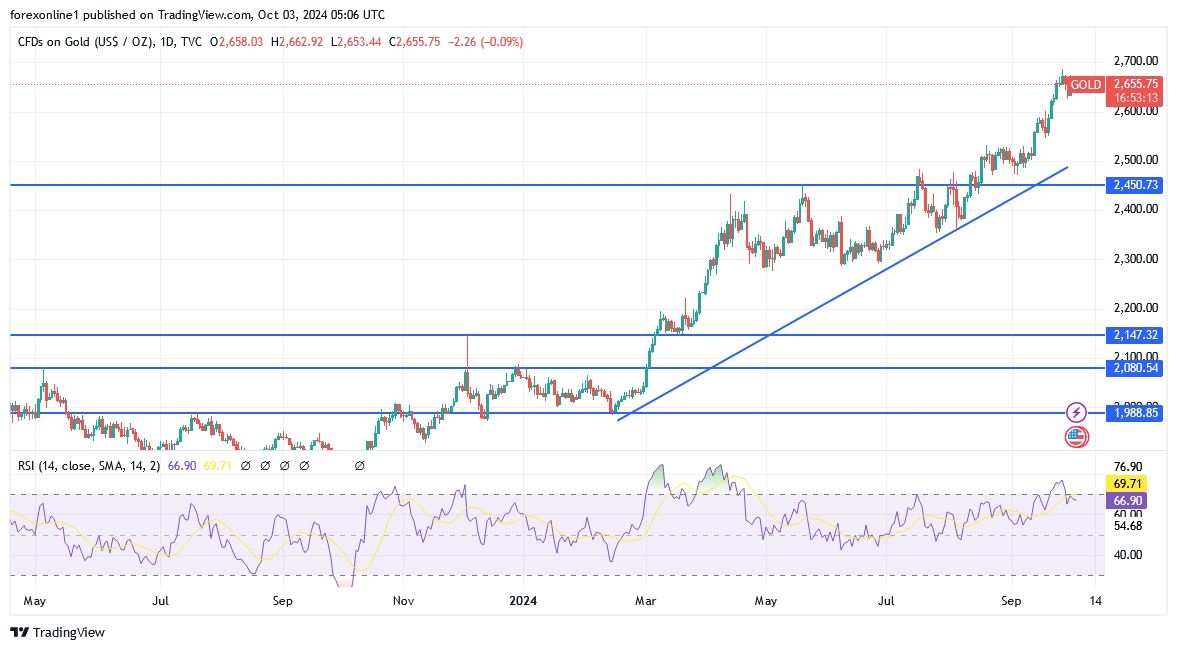
Gold price is extending its consolidative phase below the key $2,670 static resistance for the third straight day. Gold traders look forward to the high-impact US Nonfarm Payrolls (NFP). data for the next push higher, as the Middle East geopolitical escalation persists.
Heading into the US NFP showdown, traders are resorting to position readjustment by way of profit-taking on the recent US Dollar (USD) rally, injecting fresh signs of life in Gold price. The Greenback retreats early Friday after hitting six-week highs against its major rivals on Thursday, courtesy of the recent strong US employment and ISM Services PMI data. Encouraging US economic data have eased bets for a 50 basis points interest rate cut by the Federal Reserve (Fed) in November.
Data on Wednesday showed that US ADP private sector employment increased by 143,000 jobs for September, accelerating from the upwardly revised 103,000 in August and better than the 120,000 estimate. Meanwhile, US ISM Services PMI jumped from 51.5 to 54.9 in September, above the forecast of 51.7 while marking the highest reading since February 2023.
Markets are currently pricing in about a 34% chance that the Fed will opt for a big rate cut at its next meeting, compared with almost 60% last week, CME Group’s FedWatch Tool shows. The non-interest-bearing Gold price struggles amid reduced bets for aggressive Fed easing. However, the Gold price downside remains cushioned due to the intensifying geopolitical tensions between Iran and Israel.
Following Iran’s missile attacks on Israel to avenge the killings of of leaders of the Tehran-back militant group Hezbollah last week, Israel responded by striking an apartment in central Beirut, which killed nine people. The Lebanese Army returned Israeli fire for the first time in nearly a year of fighting between Israel and Hezbollah. Mounting risks of the Israel-Iran conflict turning into a wider regional war in the Middle East continue to lend support to the traditional safe-haven Gold price.
The next direction in Gold price, however, will be determined by the upcoming US payrolls data, which is expected to show that the economy added 140K jobs in September, against August’s 142K gain. The Unemployment Rate is set to hold steady at 4.2% in the same period while the annual Average Hourly Earnings are likely to grow by 3.8% in September, at the same pace seen in August.
An upside surprise to the headline NFP figure and the wage inflation data could bolster bets for a 25 bps Fed rate cut in November, adding extra legs to the US Dollar recovery at the expense of Gold price. In contrast, a big disappointment could revive expectations that the Fed would opt for an outsized rate reduction at its next meeting, smashing the USD across the board. In such a case, Gold price could jump back toward the record high of $2,686.
The US labor market report will the hold key for the Gold price action while traders will also closely eye a speech from New York Fed President John Williams for fresh policy cues.
The short-term technical outlook for Gold price remains more or less the same, with buyers motivated so long as the 14-day Relative Strength Index (RSI) holds within the bullish zone. The leading indicator is currently trading near 68.
Gold price needs to yield a daily candlestick closing above the static resistance near $2,670 for a fresh upside. The next resistance is aligned at the record high of $2,686.
Further up, buyers will target the $2,700 round level, followed by the rising trendline resistance, now at $2,752.
On the flip side, acceptance below the September 24 low of $2,623 is critical to unleashing further downside toward the $2,600 threshold, where the 21-day Simple Moving Average (SMA) coincides.
Gold sellers could then challenge the September 20 low of $2,585.
The Nonfarm Payrolls release presents the number of new jobs created in the US during the previous month in all non-agricultural businesses; it is released by the US Bureau of Labor Statistics (BLS). The monthly changes in payrolls can be extremely volatile. The number is also subject to strong reviews, which can also trigger volatility in the Forex board. Generally speaking, a high reading is seen as bullish for the US Dollar (USD), while a low reading is seen as bearish, although previous months’ reviews and the Unemployment Rate are as relevant as the headline figure. The market’s reaction, therefore, depends on how the market assesses all the data contained in the BLS report as a whole.
On the downside, failure to breach resistance could trigger renewed selling pressure. If downward momentum picks up, traders may look for support around $2.825. A break below this point could lead to sharper declines, with potential pivot points at $2.702, $2.653, and $2.601, all possible downside targets.
Traders are positioning themselves ahead of the EIA report, which is expected to show a smaller-than-average injection into natural gas storage. According to industry estimates, the consensus points to a build of +56 billion cubic feet (Bcf), well below the five-year average of +98 Bcf for this time of year. The market has been supported by warmer-than-normal temperatures across the U.S., particularly in Texas, which has boosted cooling demand. In addition, lower wind energy generation last week has contributed to increased natural gas usage, adding to the bullish sentiment.
NatGasWeather, a prominent industry forecaster, suggests that today’s storage report could surprise to the upside, with some estimates as low as +53 Bcf. A smaller-than-expected build would further shrink the storage surplus and support higher prices.
Looking at the weather forecast for the upcoming week, much of the U.S. is expected to experience mild temperatures, with highs ranging from the 60s to 80s across most regions. However, hotter conditions persist in California, the Southwest, and parts of Texas, where temperatures are reaching into the 90s and 100s. Despite the regional heat, overall natural gas demand is expected to be low over the next seven days, which could temper the market’s bullish momentum.
The natural gas market appears cautiously bullish in the short term. A smaller-than-expected storage build would support prices, especially if the market breaks through key resistance at $3.00. However, failure to overcome these resistance levels could lead to downside risks, with potential testing of support at $2.825 and lower pivot levels. Traders should remain watchful of today’s EIA report, as it could be a decisive factor in determining the market’s next move.
However, recent strong US jobs data has limited gold’s upward momentum by reducing the need for the Federal Reserve to adopt a more accommodative monetary policy. According to economic data, ADP data indicated that more US private sector jobs were created in September than expected, reinforcing the positive results from the JOLTS report and suggesting that the US Labor market is in better shape than previously thought at the beginning of the third quarter. Now, Financial markets see a 66% chance that the Federal Reserve will opt for a modest 25-basis point interest rate cut in November. Decisively, low interest rates reduce the opportunity cost of holding non-interest-bearing bullion assets.

According to licensed trading platforms, demand for the US dollar as a safe haven has increased after Iran launched a ballistic missile attack on Israel and the United States threatened severe consequences for the attack. Demand for gold, oil, and the dollar increased after news reports that the United States warned Israel late on Tuesday that Iran was preparing to launch a ballistic missile attack on Israel.
The intelligence information was accurate, as between 180 and 200 Iranian missiles were launched overnight, with Israel pledging to retaliate against Iran as a result. As a result, global stock markets declined amid growing investor anxiety. In the foreign exchange market, the pound sterling fell 0.66% against the dollar on Tuesday to 1.3284. The euro/dollar pair fell 0.6% to close at 1.1067.
The strength of the US dollar extended into the mid-week session; however, the selling had eased at the time of writing on Wednesday.
For the markets, there are two scenarios to consider:
Financial markets reverse losses and the US dollar gives up gains as tensions in the Middle East tend not to have a lasting impact on the market. In this regard, Jasper Faerestad, senior analyst at Danske Bank, says: “The Iranian missile attack on Israel has increased demand for safe-haven assets, boosting the US dollar and driving up oil and gold prices. This move has largely faded at the end of the session as the reported damage was apparently limited.”
This time is different as this is a major direct attack by Iran on a key US ally.
In the second scenario, the US dollar could extend its recent recovery.
According to today’s gold analysts’ forecasts. The gold index is still in a strong upward trend and its recent gains were enough to push all technical indicators towards strong overbought levels, but with the increase and continuation of global geopolitical tensions and the abandonment of tightening by global central banks, the factors for gold gains will remain. Strong and expected profit-taking will not occur without investors’ appetite for risk, calming of wars in the Middle East region and recovery of the US dollar price. Currently, the closest resistance levels for gold are $2670, $2685 and $2700 per ounce, and I do not recommend buying gold from record highs.
Ready to trade our Gold monthly forecast? Here’s a list of some of the best XAU/USD brokers to check out.
Europe’s coffee lovers are bracing themselves for higher prices as natural disasters hit the world’s top two coffee-producing countries.
Droughts in Brazil, the world’s largest coffee producer, and severe typhoons in Vietnam, the second-largest, have significantly disrupted global coffee supply chains, driving up production costs that are bubbling their way through to consumers.
As one of the world’s largest coffee-drinking regions, Europe’s coffee lovers will find price hikes particularly hard to swallow. Europeans consume approximately 3.2 million metric tons of coffee a year, accounting for almost 33% of the world’s total coffee consumption, according to German consumer data company Statista.
Brazil, responsible for around 40% of the world’s coffee production, has been grappling with one of its worst droughts in decades. The dry conditions have severely affected its arabica coffee-growing regions and reduced yields.
The 2023-2024 crop cycle has already seen a steep drop in production, some estimates suggest output could fall by as much as one-fifth (20%).
The impact is being felt most acutely in Minas Gerais, Brazil’s largest coffee-producing state and the home of the high quality arabica bean, which has experienced months of below-average rainfall.
While Brazil dominates the arabica market, Vietnam is the world’s leading producer of the cheaper robusta bean – used in instant coffee. Earlier this month, the country’s key coffee-growing regions in the Central Highlands were decimated by Typhoon Yagi, which killed at least 60 people and left hundreds injured.
Early assessments suggest thousands of hectares of coffee plantations were affected, with significant losses to both the current harvest and future production potential, as damaged trees will take years to recover.
The combined effects of Brazil’s drought and Vietnam’s typhoon have triggered a sharp increase in global coffee prices. The International Coffee Organization (ICO), the intergovernmental body made up of coffee exporting and importing countries, reported that prices surged by nearly 20% in the third quarter of 2024, reaching their highest levels in almost a decade.
Katharina Erfort, from international supply chain management company Inverto is gloomy about the prospect of a return to normal prices any time soon. Speaking to Euronews Business she said: “A quick recovery for the coffee sector is unlikely, even with potential improvements in supply.
“The ongoing effects of climate change make a swift return to stability difficult. The sector remains vulnerable to extreme weather patterns that can continue to disrupt future harvests. Additionally, rising global demand, particularly in emerging markets like Asia, may continue to put upward pressure on prices, further slowing recovery efforts.”
Arabica coffee futures, traded on the Intercontinental Exchange (ICE), have risen dramatically, with prices now hovering above $2.50 (€2.25) per pound – up from $1.80 (€1.62) earlier in the year. Robusta prices have followed a similar trajectory, climbing by around 25% to reach more than $2,000 (€1,796) per metric ton.
The sharp price increases have sent shockwaves through the global coffee market. Coffee traders are facing heightened volatility, with concerns growing that continued weather-related disruptions and the cost of rebuilding after the natural disasters could push prices even higher.
Agri-commodities analyst at Rabobank, Carlos Mera told Bloomberg that this crisis is compounded by logistical challenges, such as port congestion and a global shortage of shipping containers, which are hampering the movement of coffee worldwide.
The effects of rising costs are particularly pronounced in Europe. In Germany, Europe’s largest coffee market, retail prices for ground coffee and coffee beans have risen by an average of 10% since 2022, according to Statista.
A survey by the Brussels based European Coffee Federation (ECF) found that nearly 65% of cafes in Europe have raised their prices by between 5% and 15% since the start of 2023. Researchers noted that increases were likely to be driven by a range of factors beyond the cost of coffee beans, as inflation had driven up the price of other essentials such as milk, sugar, and disposable cups.
 ADVERTISEMENT
As the world’s big two coffee producers struggle to recover from their respective crises, the outlook for the global coffee market remains uncertain.
Climate change is reducing the availability of land on which coffee crops can thrive, and extreme weather events are increasing, creating a perfect storm of challenges for the sector and Europe’s coffee lovers.
Gold price is trading listlessly in a narrow range under the key $2,670 static resistance, lacking a clear directional impetus so far this Thursday. The focus now shifts toward a fresh batch of US economic statistics and speeches from Federal Reserve (Fed) policymakers for fresh directives amid the escalating geopolitical conflict between Israel and Iran.
Several media outlets reported that Israel delivered a harsh response to the recent Iranian attack by bombing central Beirut in the early hours of Thursday. Lebanese security officials said that three missiles also struck the southern suburb of Dahiyeh, the place of Hezbollah leader Hassan Nasrallah’s killing. Lebanese health officials also reported that multiple people were injured following Israel’s strike in Beirut.
Iranian forces on Tuesday used hypersonic Fattah missiles for the first time and 90% of its missiles successfully hit their targets in Israel. Tehran said this attack was in response to Israeli killings of militant leaders and aggression in Lebanon against the Iran-backed armed movement Hezbollah and in Gaza.
Despite the increasing risks of the Israel-Iran conflict turning into a wider regional war in the Middle East, Gold price is struggling to capitalize on the risk-off flows, as diminishing odds of a 50 basis points (bps) interest rate cut by the Fed in November keep the sentiment around the US Dollar underpinned at the expense of the non-interest-bearing Gold price.
Data on Wednesday showed that US ADP private sector employment increased by 143,000 jobs for September, accelerating from the upwardly revised 103,000 in August and better than the 120,000 estimate. Strong ADP jobs report eased concerns about the health of the US labor market, supporting the expectations for Friday’s Nonfarm Payrolls data.
Markets are currently pricing in about a 34% chance that the Fed will opt for a big rate cut at its next meeting, compared with almost 60% last week, CME Group’s FedWatch Tool shows.
Next of note for Gold traders remain the US ISM Services PMI and the weekly Jobless Claims data for fresh signals on the state of the economy and the Fed’s next interest rate move. Also, Fedspeak will be closely scrutinized and will likely have a significant impact on the US Dollar valuation, eventually influencing the Gold price action.
The daily technical setup for Gold price remains constructive so long as the 14-day Relative Strength Index (RSI) remains in the bullish territory. The leading indicator is currently trading near 66.50.
Gold price needs to yield a daily candlestick closing above the static resistance near $2,670 for a renewed upside. The next resistance is aligned at the record high of $2,686.
Furrther up, buyers will target the $2,700 round level, followed by the rising trendline resistance at $2,740.
Alternatively, if Gold sellers flex their muscles, acceptance below the September 24 low of $2,623 is critical to unleashing further downside toward the $2,600 threshold.
Gold sellers could then challenge the September 20 low of $2,585, where the 21-day Simple Moving Average (SMA) hangs around.
The Institute for Supply Management (ISM) Services Purchasing Managers Index (PMI), released on a monthly basis, is a leading indicator gauging business activity in the US services sector, which makes up most of the economy. The indicator is obtained from a survey of supply executives across the US based on information they have collected within their respective organizations. Survey responses reflect the change, if any, in the current month compared to the previous month. A reading above 50 indicates that the services economy is generally expanding, a bullish sign for the US Dollar (USD). A reading below 50 signals that services sector activity is generally declining, which is seen as bearish for USD.
Important DisclaimersThe content provided on the website includes general news and publications, our personal analysis and opinions, and contents provided by third parties, which are intended for educational and research purposes only. It does not constitute, and should not be read as, any recommendation or advice to take any action whatsoever, including to make any investment or buy any product. When making any financial decision, you should perform your own due diligence checks, apply your own discretion and consult your competent advisors. The content of the website is not personally directed to you, and we does not take into account your financial situation or needs.The information contained in this website is not necessarily provided in real-time nor is it necessarily accurate. Prices provided herein may be provided by market makers and not by exchanges.Any trading or other financial decision you make shall be at your full responsibility, and you must not rely on any information provided through the website. FX Empire does not provide any warranty regarding any of the information contained in the website, and shall bear no responsibility for any trading losses you might incur as a result of using any information contained in the website.The website may include advertisements and other promotional contents, and FX Empire may receive compensation from third parties in connection with the content. FX Empire does not endorse any third party or recommends using any third party’s services, and does not assume responsibility for your use of any such third party’s website or services.FX Empire and its employees, officers, subsidiaries and associates, are not liable nor shall they be held liable for any loss or damage resulting from your use of the website or reliance on the information provided on this website.Risk DisclaimersThis website includes information about cryptocurrencies, contracts for difference (CFDs) and other financial instruments, and about brokers, exchanges and other entities trading in such instruments. Both cryptocurrencies and CFDs are complex instruments and come with a high risk of losing money. You should carefully consider whether you understand how these instruments work and whether you can afford to take the high risk of losing your money.FX Empire encourages you to perform your own research before making any investment decision, and to avoid investing in any financial instrument which you do not fully understand how it works and what are the risks involved.