The main tag of Gold Price Articles.
You can use the search box below to find what you need.
[wd_asp id=1]
The main tag of Gold Price Articles.
You can use the search box below to find what you need.
[wd_asp id=1]
Silver is extending one of the most dramatic bull runs in modern commodities history, with prices hovering near record territory on Monday, December 22, 2025. Around 1:38 p.m. ET, spot silver (XAG/USD) was trading roughly in the high-$68s per ounce, after pushing to fresh all-time highs earlier in the session. One widely followed retail spot quote showed $68.89/oz at 1:20 p.m. ET, up about 2.1% on the day. [1]
The bigger headline: silver has repeatedly printed new records in December and is now riding a powerful mix of rate-cut expectations, a softer U.S. dollar, safe-haven demand tied to geopolitical risk, and a still-tight physical market. Reuters reported spot silver touched a new all-time peak around $69.44/oz on Monday before easing back. [2]
Below is what’s moving the silver price today, how analysts are framing the rally, and what the latest forecasts and technical levels suggest for the days ahead.
Silver’s intraday action has been volatile but directionally bullish:
Silver’s 2025 move is also historically large. Reuters put silver’s year-to-date gain at roughly ~139%, dramatically outpacing gold on a percentage basis. [6]
The macro backdrop remains the core engine. Multiple reports describe investors positioning for looser U.S. monetary policy in 2026, a setup that tends to support non-yielding assets like precious metals.
Reuters said expectations of easier policy and a weaker dollar have been central to the late-year precious metals surge, with traders reacting to recent U.S. inflation and labor data that reinforced rate-cut bets. [7]
Business Insider similarly tied the record push in gold and silver to renewed market confidence that rates will trend lower into 2026, increasing the appeal of hard assets versus cash and bonds. [8]
Today’s rally isn’t only macro—it’s also risk hedging. Reuters highlighted rising safe-haven flows as U.S.-Venezuela tensions escalated following President Donald Trump’s announcement of a “blockade” targeting sanctioned oil tankers moving in and out of Venezuela. [9]
On top of that, FXStreet framed silver’s jump as part of a broader flight to safety amid renewed tension in the Middle East, noting Israel–Iran headlines as a catalyst during the Asian session. [10]
Silver is behaving like a hybrid: part safe haven, part industrial metal. Reuters has repeatedly emphasized the market’s focus on a persistent supply-demand deficit, while also pointing to investment flows. [11]
Business Insider added another layer: silver (along with copper) is being treated as an “AI and electrification” metal because of its role in data infrastructure and electrification, at a time when supply pressures remain a theme. [12]
A major reason silver’s move is commanding attention is that it’s arriving late in the year—when markets often get thin and profit-taking typically increases.
Reuters quoted analysts observing that investors have not treated the year-end period as a time to step away from the trade, with strong demand pushing prices to records anyway. [13]
That said, several analysts are also warning that silver’s volatility cuts both ways. Reuters has flagged the risk of steep corrections even in a structurally bullish market, simply because silver historically moves faster than gold in both directions. [14]
A key metric confirming silver’s outperformance is the gold–silver ratio (how many ounces of silver it takes to buy one ounce of gold).
Reuters reported the ratio has narrowed to roughly 64, down sharply from about 105 in April, reflecting how aggressively silver has caught up—and, recently, outpaced. [15]
FXStreet also pegged the ratio near 64.06 on Monday. [16]
In plain terms: silver isn’t just rising because gold is rising—silver is rising faster.
Forecasts for silver are widening—bulls point to structural deficits and macro tailwinds, while cautious houses warn that the pace of gains looks unsustainable in a straight line.
In Reuters’ Dec. 22 coverage, Macquarie strategists said drivers behind silver’s recent highs include the persistent deficit and stronger import demand in India during the festive period—and they expect silver to average $57 per ounce in 2026. [17]
That forecast matters because it implies meaningful downside from today’s near-$69–$70 neighborhood, even while acknowledging supportive fundamentals.
CBS News cited Capital Economics projecting gold could fall to $3,500 by the end of next year, arguing that a cooling in gold’s speculative boom would likely spill into silver as well. [18]
CBS also quoted Global X ETFs’ Trevor Yates describing the latest leg of the rally as being driven by a 2026 outlook featuring lower rates and a potentially softer dollar, adding that the firm remains constructive on both gold and silver (while acknowledging the path won’t be smooth). [19]
Bottom line on forecasts today: even among bullish narratives, there’s a growing emphasis on volatility and the risk that silver can overshoot before it mean-reverts.
Technical analysts are largely aligned that the trend remains bullish—but momentum indicators are stretched.
FXStreet’s technical forecast described silver as extending a well-established uptrend and printing fresh records around the $69.45 area during the Asian session. It also highlighted that last week’s breakout through $66.40–$66.50 was an important trigger level, while warning that overbought RSI readings argue for caution when chasing breakouts. [20]
A separate market write-up echoed that bullish bias, pointing to silver holding above its 100-hour moving average and showing strengthening momentum signals. [21]
What this means in practice:
The rally is not just a U.S. dollar story. In India, Times of India reported silver futures surged to a record ₹2,14,534 per kilogram on MCX as the global rally spilled over into domestic markets. [22]
This matters because India can be a major swing factor in physical demand—especially during periods of strong seasonal buying.
Silver is now trading in a zone where headlines can move price quickly, because positioning is heavy and liquidity can be thinner near year-end. The market’s next moves are likely to hinge on:
As of early afternoon on December 22, 2025, silver remains near record levels, supported by a powerful combination of macro tailwinds, geopolitical risk hedging, and tightness themes in the physical market. [27]
But today’s coverage also makes one point increasingly clear: the higher silver goes, the more the market is bracing for sharp swings—especially with technical signals stretched and forecasts for 2026 diverging widely. [28]
1. www.bullion.com, 2. www.reuters.com, 3. www.bullion.com, 4. www.reuters.com, 5. www.investing.com, 6. www.reuters.com, 7. www.reuters.com, 8. www.businessinsider.com, 9. www.reuters.com, 10. www.fxstreet.com, 11. www.reuters.com, 12. www.businessinsider.com, 13. www.reuters.com, 14. www.reuters.com, 15. www.reuters.com, 16. www.fxstreet.com, 17. www.reuters.com, 18. www.cbsnews.com, 19. www.cbsnews.com, 20. www.fxstreet.com, 21. uk.investing.com, 22. timesofindia.indiatimes.com, 23. www.reuters.com, 24. www.reuters.com, 25. www.reuters.com, 26. www.reuters.com, 27. www.reuters.com, 28. www.fxstreet.com
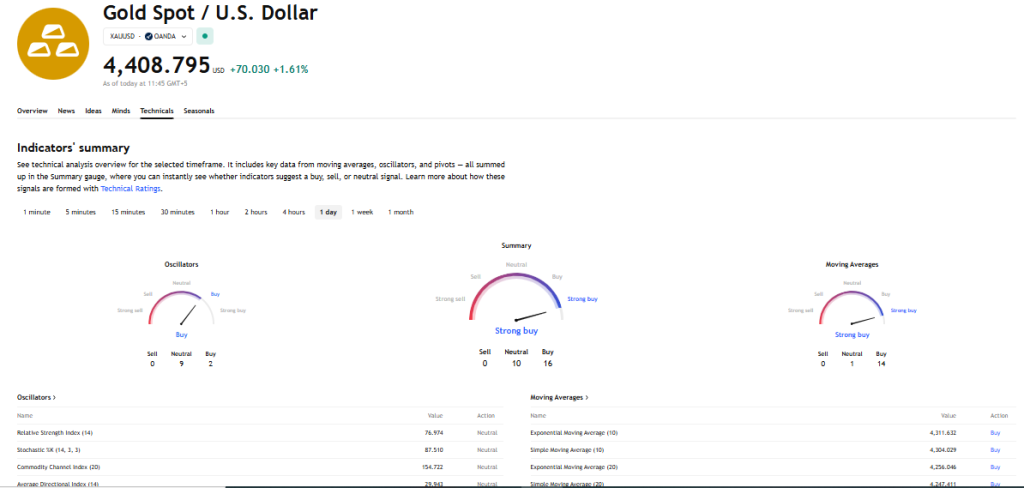
At 11:14 GMT, XAUUSD is trading $4408.58, up $69.81 or +1.61%.
Gold’s advance shows conviction rather than late-stage exhaustion. The metal is now up nearly 70% year-to-date, marking its strongest annual performance since 1979. Central bank accumulation, sustained portfolio hedging, and persistent geopolitical risk continue to absorb supply, keeping pauses brief and shallow.
The former resistance at $4381.44 has been decisively cleared. What capped price last week is now accepted above, reinforcing confidence that higher levels are being built on participation, not thin volume spikes.
A key signal today is gold’s resilience in the face of rising Treasury yields. The U.S. 10-year yield is ticking higher, yet gold shows no sensitivity. When gold rallies alongside firmer yields, it typically reflects urgency to secure exposure rather than rate-driven positioning, reinforcing the strength of current demand.
This behavior suggests positioning is being driven by capital preservation and risk hedging rather than tactical rate trades.
Expectations for lower U.S. interest rates remain a core tailwind. Federal Reserve Governor Stephen Miran reiterated that easing inflation supports rate cuts to offset labor market risks. Gold continues to benefit from lower real-rate expectations even as nominal yields firm.
Updated: December 22, 2025 — 10:23
Natural gas markets are starting the holiday-shortened week with a familiar tug-of-war: weather forecasts that lean warmer (near term) and sturdy supply are keeping prices contained, while LNG logistics, storage trends, and geopolitics continue to inject volatility into regional benchmarks.
Across the major hubs on Dec. 22, Europe’s TTF has edged lower in thin trade, Asia’s spot LNG is sitting near a 20‑month low, and the U.S. market is again revolving around the “big three” drivers—production, demand forecasts, and LNG feedgas flows. [1]
In early Monday trading, Dutch and British wholesale gas prices dipped as ample Norwegian supply and LNG availability counterbalanced expectations for colder weather later across parts of the continent. The Dutch front‑month TTF contract was reported lower around €27.95/MWh (about $9.61/mmBtu) in the morning, with markets quiet ahead of Christmas. [2]
A broader price reference also shows TTF around the high‑€27s on the day—consistent with the idea that Europe is entering late December with prices restrained, not tight, even as winter risk remains. [3]
In Asia, spot LNG continues to feel heavy. Industry pricing cited for February delivery into Northeast Asia put the JKM region around $9.50/mmBtu, down from $10/mmBtu the week prior—marking the lowest level since April 2024. Analysts attribute the softness to muted heating demand, ample Pacific supply, and pipeline gas availability (notably supporting China’s balance), keeping spot buying cautious and price-sensitive. [4]
A key detail for traders: multiple assessments highlighted Europe’s LNG pricing versus TTF and pointed to ongoing competition for cargoes as winter deepens—even though Asia is currently the “softer” side of the global LNG equation. [5]
In the U.S., market commentary today is dominated by near‑record production, milder weather expectations into early January, and strong feedgas demand from LNG export terminals. One widely circulated market summary (citing LSEG and storage data) describes U.S. Lower‑48 output around 109.6 bcfd and forecasts demand (including exports) falling from roughly 144.6 bcfd this week to about 127.5 bcfd over the next two weeks as warmth trims heating needs. [6]
At the same time, LNG remains a stabilizer: feedgas flows to major U.S. LNG terminals have been cited around 18.5 bcfd this month—above November’s record in that same commentary—helping cushion bearish weather shifts. [7]
The near-term setup remains broadly milder than normal, reducing the call on gas for space heating in the U.S. and easing immediate price pressure. [8]
In Europe, traders are balancing that same “now vs. later” weather dynamic: current fundamentals read bearish, but the market remains alert to risk factors that could flip sentiment quickly—especially if cold snaps arrive while storage is already lower than recent years. [9]
Europe’s storage is a centerpiece today: the latest figure cited puts EU gas storage at about 67.24% full—a level that’s not alarming on its own, but lower than recent years entering the heart of winter, raising the chance Europe must compete harder for LNG cargoes in January and February if temperatures turn colder. [10]
In the U.S., storage data referenced in today’s market write-up showed utilities withdrew 167 bcf for the week ended Dec. 12, leaving inventories around 3,579 bcf—described as slightly above the five‑year average (but below year‑ago levels). [11]
One of the most consequential natural gas policy headlines today is out of Australia: the government confirmed a plan that will require east‑coast LNG exporters to reserve a minimum share of gas for domestic use, with a proposed range of 15% to 25%, starting in 2027 (and applying to new contracts). [12]
The move is designed to reduce the risk of price spikes and help address a forecast supply gap on the east coast—an unusual dynamic for a country that is also one of the world’s largest LNG exporters. Reactions are mixed: manufacturers tend to welcome the prospect of more domestic supply, while exporters warn about investment signals and market intervention. [13]
Why it matters globally: Australia is a top-tier LNG supplier into Asia, so any rule that changes how much gas can be exported (even at the margin) is something LNG traders will model into forward balances—especially if winter demand or shipping constraints tighten. [14]
Reuters reporting today says Russia’s pipeline gas exports to China via Power of Siberia are expected up about 25% in 2025, reaching roughly 38.6–38.7 bcm, slightly above the pipeline’s planned annual capacity. [15]
But the same reporting underscores a central structural reality: greater flows to China do not fully replace the value (and scale) of the lost European market, and pricing remains a major hurdle for future Russian pipeline ambitions such as Power of Siberia 2. [16]
This matters for gas pricing because pipeline flows shape LNG demand indirectly: the more China can secure through pipeline gas at acceptable prices, the more selective it can be in spot LNG markets—one reason Asia’s spot buying has stayed cautious even as winter approaches. [17]
Another major headline today: a tanker named Kunpeng loaded LNG from Russia’s Portovaya LNG terminal, which is under Western sanctions, based on ship-tracking data cited by Reuters (Kpler and LSEG). The vessel reportedly arrived Dec. 18 and departed with cargo on Dec. 21—described as the first time this tanker has lifted LNG from a designated project. [18]
Market significance: even relatively small sanctioned volumes can matter at the margin in winter—especially in Europe, where LNG is now a core balancing mechanism. The broader issue is whether enforcement tightens, stays stable, or weakens in practice via transfers and “creative” routing. [19]
On the corporate side, the U.S. LNG growth story is facing a reality check. Reuters reports that Energy Transfer has suspended development of its Lake Charles LNG export project in Louisiana, citing cost pressures, market conditions, and a preference to focus on pipeline projects. The planned project capacity was reported around 16.45 million tonnes per annum. [20]
The company’s own announcement echoed that strategic pivot—suspending development to prioritize a backlog of pipeline investments, while remaining open to discussions with third parties. [21]
Why it matters today: LNG markets price long-term capacity expectations years ahead. Any meaningful delay, cancellation, or de‑risking of U.S. export growth can tighten future balances—especially if demand surprises higher (AI-driven power demand, industrial recovery, or faster coal-to-gas switching). [22]
Europe’s setup is straightforward but unstable: prices are currently subdued by supply, yet storage is lower than recent winters and the market is explicitly watching whether colder weather in early 2026 forces incremental LNG procurement. [23]
In the U.S., the next big directional catalyst remains weather model shifts. The current posture—warmer near-term, lower demand projections—keeps the market sensitive to any change that turns the outlook colder, because production is high but LNG demand has also been running strong. [24]
One notable forward view comes from Goldman Sachs (reported by Reuters): the bank forecasts European TTF averaging roughly €29/MWh in 2026 and €20/MWh in 2027, while expecting U.S. gas prices that “incentivize” production growth at around $4.60/mmBtu in 2026 and $3.80/mmBtu in 2027. [25]
That framing is important: the market is effectively searching for a level that keeps enough supply coming (especially from the U.S.) without crushing demand—an equilibrium that is increasingly shaped by LNG export capacity decisions, like the Lake Charles pause, and by policy choices, like Australia’s domestic reservation plan. [26]
As of Dec. 22, 2025 (10:23), the natural gas story is not a single narrative—it’s a set of interlocking ones:
1. www.tradingview.com, 2. www.tradingview.com, 3. tradingeconomics.com, 4. www.hellenicshippingnews.com, 5. www.hellenicshippingnews.com, 6. in.investing.com, 7. in.investing.com, 8. in.investing.com, 9. www.tradingview.com, 10. www.tradingview.com, 11. in.investing.com, 12. minister.dcceew.gov.au, 13. www.theguardian.com, 14. www.reuters.com, 15. www.reuters.com, 16. www.reuters.com, 17. www.reuters.com, 18. www.reuters.com, 19. www.reuters.com, 20. www.reuters.com, 21. www.businesswire.com, 22. www.reuters.com, 23. www.tradingview.com, 24. in.investing.com, 25. www.reuters.com, 26. www.reuters.com, 27. in.investing.com, 28. www.hellenicshippingnews.com, 29. www.tradingview.com, 30. www.reuters.com, 31. www.tradingview.com, 32. www.hellenicshippingnews.com, 33. in.investing.com, 34. minister.dcceew.gov.au
Silver (XAG/USD) prolongs its recent well-established uptrend and climbs to a fresh record high, around the $69.45 area, during the Asian session. Moreover, the broader technical setup seems tilted firmly in favor of bullish traders and suggests that the path of least resistance for the white metal remains to the upside.
Against the backdrop of repeated rebounds from the 100-hour Simple Moving Average (SMA) over the past two weeks or so, last week’s breakout through the $66.40-$66.50 horizontal resistance was seen as a key trigger for the XAG/USD bulls. A subsequent strength beyond the $67.20-$67.25 region last Friday validates the near-term positive outlook. The white metal currently trades around the $69.25 area, up 3% for the day.
Meanwhile, the Relative Strength Index (RSI) on hourly/daily charts sits above the 70 mark, signaling stretched conditions that could prompt a pause. The 100-hour SMA climbs to $65.57, with price holding well above it, keeping the near-term trend biased upward. Moreover, the Moving Average Convergence Divergence (MACD) stands at 0.19 in positive territory and continues to rise, suggesting strengthening bullish momentum.
Buyers would retain control while XAG/USD remains above the rising 100-period SMA, and a pullback toward $65.57 would meet dynamic support. The MACD staying positive supports the bullish tone, while an overbought RSI suggests consolidation could precede further gains. A decisive continuation above intraday highs could extend the advance, whereas failure to hold above the average would open room for a deeper retracement.
(The technical analysis of this story was written with the help of an AI tool)
(This story was corrected on December 22 at 07:36 GMT to say in the second bullet point that the overbought RSI, not overnight, on hourly/daily charts warrants caution before placing fresh bullish bets.)
Silver is a precious metal highly traded among investors. It has been historically used as a store of value and a medium of exchange. Although less popular than Gold, traders may turn to Silver to diversify their investment portfolio, for its intrinsic value or as a potential hedge during high-inflation periods. Investors can buy physical Silver, in coins or in bars, or trade it through vehicles such as Exchange Traded Funds, which track its price on international markets.
Silver prices can move due to a wide range of factors. Geopolitical instability or fears of a deep recession can make Silver price escalate due to its safe-haven status, although to a lesser extent than Gold’s. As a yieldless asset, Silver tends to rise with lower interest rates. Its moves also depend on how the US Dollar (USD) behaves as the asset is priced in dollars (XAG/USD). A strong Dollar tends to keep the price of Silver at bay, whereas a weaker Dollar is likely to propel prices up. Other factors such as investment demand, mining supply – Silver is much more abundant than Gold – and recycling rates can also affect prices.
Silver is widely used in industry, particularly in sectors such as electronics or solar energy, as it has one of the highest electric conductivity of all metals – more than Copper and Gold. A surge in demand can increase prices, while a decline tends to lower them. Dynamics in the US, Chinese and Indian economies can also contribute to price swings: for the US and particularly China, their big industrial sectors use Silver in various processes; in India, consumers’ demand for the precious metal for jewellery also plays a key role in setting prices.
Silver prices tend to follow Gold’s moves. When Gold prices rise, Silver typically follows suit, as their status as safe-haven assets is similar. The Gold/Silver ratio, which shows the number of ounces of Silver needed to equal the value of one ounce of Gold, may help to determine the relative valuation between both metals. Some investors may consider a high ratio as an indicator that Silver is undervalued, or Gold is overvalued. On the contrary, a low ratio might suggest that Gold is undervalued relative to Silver.
Robinhood Markets (HOOD) rose in its latest intraday trading, as the stock attempts to relieve part of its clear oversold condition on the RSI indicators, especially with the emergence of positive signals. However, negative pressure remains in place due to trading below its previous 50-day SMA, which reinforces the stability and dominance of the short-term descending corrective trend, particularly with price action moving alongside a supporting trendline.
High-risk warning: HOOD belongs to a group of stocks commonly known as “meme stocks,” which are characterized by heavy speculative activity. As a result, the stock’s price movement often deviates from technical expectations or fundamental analysis, and can at times be sudden and unpredictable.
Therefore we expect the stock to decline in its upcoming trading, especially as long as it remains below the resistance level at $125.60, targeting the pivotal support level at $102.10.
Today’s price forecast: Bearish
Gold is back in focus as price hold near record territory. On December 22, 2025, XAU/USD was trading close to $4,350, a level that would have sounded unrealistic just a few years ago. Yet today, it feels almost normal. Global investors are no longer asking if gold belongs in portfolios. They are asking how much exposure makes sense.
Several forces are shaping this moment. Interest rate expectations are shifting. Inflation fears have not fully faded. Central banks are still buying gold at a steady pace. At the same time, long-term forecasts are turning bolder. Some analysts now see a path toward $5,000 gold by 2026.
This price action is not driven by panic. It reflects deeper changes in how gold is viewed. Not just as a hedge. But as a strategic asset. The current consolidation near $4,350 shows caution, not weakness. Markets are pausing. Watching data. Waiting for the next trigger. And gold is quietly holding its ground.
As of December 22, 2025, gold hit a record high above $4,383 per ounce, and briefly pushed past $4,400, driven by hopes for more U.S. interest rate cuts and strong demand for safe assets like bullion.
Gold has climbed sharply this year. Prices are up about 67% in 2025, making this one of the strongest annual gains in decades.Even at levels near $4,350, buyers remain active. This shows the market is waiting for strong signals before moving higher. A weaker U.S. dollar and expectations that the Federal Reserve will cut rates next year are adding to the pressure.

Instead of falling back, gold keeps finding support at these high prices. Traders see this as a sign that demand is real, not just short-term speculation. More data will soon show whether this trend continues into 2026 or cools off after a huge rally.
Gold’s role in markets has changed dramatically over the past year. In early 2025, the rally began on safe-haven flows. Now, broad macro trends are backing price strength. This includes investor demand, central bank buying, and fears linked to global instability.
Unlike past cycles where gold only moved during crises, the current environment shows structural drivers pushing prices higher. Central banks have been big buyers of gold for years, and they continue to add reserves. This demand adds a firm base under prices.
Economic uncertainty, persistent inflation fears, and ongoing geopolitical risks have made gold a core part of many portfolios. This has turned gold from a trading asset into a strategic hedge for 2025 and beyond.
Several major financial institutions now see gold rising toward or above $5,000 per ounce by 2026. Reports show that banks like Bank of America and Société Générale have forecasts in this range.
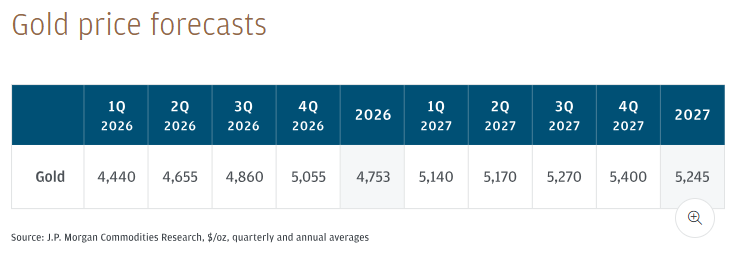
JP Morgan has forecast that gold could average over $5,000 per ounce by the fourth quarter of 2026, citing strong investor interest and central bank buying. Goldman Sachs projects a target near $4,900 by the end of 2026, backed by heavy official gold purchases.
These forecasts are not random guesses. They are based on models that assume continued demand, declining real yields, and broader geopolitical and economic risks remaining elevated. A path toward $5,000 is seen by some analysts as the natural next step if current trends persist.
Gold prices are highly sensitive to U.S. monetary policy expectations. When traders expect the Federal Reserve to cut interest rates, gold usually rises. This is because lower rates reduce the opportunity cost of holding non-yielding assets like gold.
In late 2025, markets priced in multiple rate-cut expectations for 2026. This has weakened the U.S. dollar and boosted gold. Even if rate cuts are gradual, a shift toward easier policy tends to support gold prices. The market is now watching incoming economic data closely for stronger clues on the Fed’s next moves.
Central banks around the world have been buying gold at a fast pace in recent years. This steady demand is not driven by short-term traders. It is structural. Countries diversify reserves to reduce reliance on the U.S. dollar, and gold becomes a key part of that strategy.
The pace of official gold purchases has stayed high through 2025, and projections suggest this trend will continue into 2026. Many banks now see this steady demand as a significant factor in pushing gold prices higher.
Three broad pressures are reinforcing gold’s appeal. First, inflation remains a concern globally, even as some inflation measures soften. Second, high public debt levels in major economies create uncertainty about future policy responses. Third, geopolitical risks continue to drive safe-haven buying.
When these pressures exist together, investors tend to seek assets that protect purchasing power and offer stability. Gold fits both roles. This mix of forces helps explain why prices are not falling back despite already high levels.
Technically, gold has been trading in a high range near $4,350. Analysts watch key support and resistance levels to judge whether the trend will extend or stall. Recent trading has shown gold holding above major support zones, signaling that buyers are active even after a big rally.
Short-term indicators show possible minor pullbacks, but the broader trend remains constructive unless critical levels break to the downside. Trading near these high levels is part of a normal consolidation after strong gains.
Simply calling gold “overvalued” at these levels misses the bigger picture. When adjusted for inflation and other factors, gold’s purchasing power remains strong. Historic comparisons show that current prices reflect long-term structural shifts rather than just short-term bubbles.
Even if price moves slow for a period, the fundamental drivers suggest that higher levels could still be justified over time.
Several risks could slow gold’s rise. A stronger-than-expected U.S. economy might delay rate cuts, boosting the dollar and pressuring gold. Geopolitical risks could ease, reducing safe-haven demand. Or central banks could slow their buying pace if prices rise too fast.
These risks do not make gold bearish. They simply show that the path to potential $5,000 levels is not guaranteed and depends on how key macro factors evolve.
Looking ahead, gold remains an important asset for diversification. Short-term moves may be volatile, but the broader trend shows strong support. Expert forecasts vary, but many see room for further gains. Central bank demand, monetary policy shifts, and ongoing uncertainty all feed into this outlook.
Even if gold does not hit exactly $5,000 in 2026, the trend toward higher ranges suggests it will remain a key part of global markets in the near future.
Many analysts see gold staying strong in 2026. Some forecasts put averages near $4,000-$4,900 per ounce by year‑end, backed by demand and macro trends.
Some major banks like Bank of America and HSBC say gold could hit or approach $5,000 in 2026 if rate cuts and safe‑haven flows persist.
Gold moves with factors like interest rates, U.S. dollar strength, central bank buying, and global risks, making it sensitive to macroeconomic shifts.
Disclaimer
The content shared by Meyka AI PTY LTD is solely for research and informational purposes. Meyka is not a financial advisory service, and the information provided should not be considered investment or trading advice.
Natural gas price failed by breaking the bullish channel’s support, affected by the continuation of the main indicators’ contradiction until this moment, which forces it to provide new sideways trading by its stability near $4.060.
The price confinement between the main support at $3.900 while $4.200 level is expected by forming strong barrier against the current trading, therefore, we recommend the neutrality for today, waiting for surpassing one of the main levels, to detect the expected trend in the near and medium period trading.
The expected trading range for today is between $3.900 and $4.200.
Trend forecast: Neutral
Platinum price did not get enough by its recent gains, activating with the main indicators positivity by forming strong bullish waves, to settle above the psychological barrier at $2000.00 level, recording extra historical gains by hitting $2071.00 level.
Which confirms the stability of the bullish scenario, and its stability above $2000.00 makes us expect to form new bullish waves, to attempt to reach $2085.00 and $2125.00.
The expected trading range for today is between $1970.00 and $2085.00.
Trend forecast: Bullish
Silver price (XAG/USD) trades 2.5% higher to near $69.00 during the Asian trading session on Monday, the highest level ever seen. The white metal strengthens as investors shift to a safe-haven fleet on renewed tensions between Israel and Iran.
According to a report from NBC News, Israeli officials have grown increasingly concerned that Iran is expanding production of its ballistic missile program and reconstituting its nuclear facilities, which were damaged by Israeli military strikes earlier this year, and are preparing to brief United States (US) President Donald Trump about options for attacking it again.
The scenario of geopolitical tensions increases demand for safe-haven assets, such as Silver.
On the Federal Reserve’s (Fed) monetary policy front, investors remain confident that the central bank will not reduce interest rates in the January policy meeting. Fed dovish expectations for the January meeting have not accelerated, despite the release of the soft US inflation data for November.
On Thursday, the US Consumer Price Index (CPI) data for November showed that the headline inflation cooled down to 2.7% year-on-year (YoY) from 3% in October. Economists expected the inflation data to come in higher at 3.1%. The so-called core reading, which strips out volatile food and energy items, dropped to 2.6% from estimates and the prior reading of 3%.
XAG/USD trades higher around $69.02 at the start of the week. The 20-period Exponential Moving Average at $61.14 rises firmly and sits well below the price. The wide positive spread underscores a strong uptrend but also stretched conditions.
The 14-day Relative Strength Index (RSI) at 77.44 is overbought, and a cooling phase could follow. A rising trend line from $49.96 underpins the bullish bias.
With price extended above the 20-EMA, pullbacks could find support at $61.14, preserving the advance. Momentum remains robust, yet the overbought RSI may cap near-term gains; a break below the trend line near $65 would weaken the bias and open the door for a deeper retracement toward the December 3 high near $59.00. Looking up, the psychological level of $60.00 would act as major barrier.
(The technical analysis of this story was written with the help of an AI tool.)
Silver is a precious metal highly traded among investors. It has been historically used as a store of value and a medium of exchange. Although less popular than Gold, traders may turn to Silver to diversify their investment portfolio, for its intrinsic value or as a potential hedge during high-inflation periods. Investors can buy physical Silver, in coins or in bars, or trade it through vehicles such as Exchange Traded Funds, which track its price on international markets.
Silver prices can move due to a wide range of factors. Geopolitical instability or fears of a deep recession can make Silver price escalate due to its safe-haven status, although to a lesser extent than Gold’s. As a yieldless asset, Silver tends to rise with lower interest rates. Its moves also depend on how the US Dollar (USD) behaves as the asset is priced in dollars (XAG/USD). A strong Dollar tends to keep the price of Silver at bay, whereas a weaker Dollar is likely to propel prices up. Other factors such as investment demand, mining supply – Silver is much more abundant than Gold – and recycling rates can also affect prices.
Silver is widely used in industry, particularly in sectors such as electronics or solar energy, as it has one of the highest electric conductivity of all metals – more than Copper and Gold. A surge in demand can increase prices, while a decline tends to lower them. Dynamics in the US, Chinese and Indian economies can also contribute to price swings: for the US and particularly China, their big industrial sectors use Silver in various processes; in India, consumers’ demand for the precious metal for jewellery also plays a key role in setting prices.
Silver prices tend to follow Gold’s moves. When Gold prices rise, Silver typically follows suit, as their status as safe-haven assets is similar. The Gold/Silver ratio, which shows the number of ounces of Silver needed to equal the value of one ounce of Gold, may help to determine the relative valuation between both metals. Some investors may consider a high ratio as an indicator that Silver is undervalued, or Gold is overvalued. On the contrary, a low ratio might suggest that Gold is undervalued relative to Silver.
Silver is closing out 2025 with the kind of momentum that forces both bulls and bears to pay attention. As of Sunday, December 21, 2025, the silver price (XAG/USD) is hovering around the $67-per-ounce area after a record-setting surge late last week—powered by a mix of investment flows, tight supply conditions, and an industrial demand narrative that keeps getting louder. [1]
But this is also the point in a parabolic move where markets tend to change character: liquidity thins into the holidays, positioning gets crowded, and even small headlines can trigger outsized swings. Several analysts publishing today warn that a “breather” week is possible, even if the broader trend remains bullish into 2026. [2]
Below is a complete, publication-ready roundup of today’s (21.12.2025) silver price news, forecasts, and analyses, plus the macro and technical signals traders are watching right now.
Because it’s a weekend, most “live” silver quotes are effectively tracking Friday’s U.S. session close and subsequent thin, OTC price discovery. Reuters reported that spot silver rose to about $67.14/oz on Friday (Dec. 19) after hitting a fresh record intraday high near $67.45/oz, capping a powerful weekly move. [3]
The bigger headline is the scale of the run: Reuters also noted silver has surged roughly triple-digit percentage points in 2025 (around the 120%–130% range depending on measurement), dramatically outperforming gold this year. [4]
Why this matters for today (Dec. 21):
The silver story right now is not one single catalyst—it’s a cluster of reinforcing forces.
Reuters explicitly framed the rally as heavily investment-driven, quoting market participants who emphasized that speculation is playing a major role even though fundamentals are supportive. [6]
On Friday, Reuters also pointed to ETF flows and retail speculation as a continuing theme in silver’s latest leg higher. [7]
Silver (like gold) is highly sensitive to the path of real yields and the U.S. dollar. Reuters highlighted that:
Reuters described silver’s persistent supply deficit and tightening conditions outside the U.S. as part of the bullish backdrop, adding that earlier tariff-related concerns helped pull metal toward the U.S., tightening liquidity in the London spot market. [9]
Silver’s unique twist versus gold is that it’s not just a hedge or store of value; it’s also an industrial input. Reuters cited demand prospects tied to AI data centers, solar cells, and electric vehicles as part of the “perfect storm.” [10]
One of the more interesting 2025 developments: Reuters reported that silver’s inclusion on the U.S. critical minerals list has supported prices. [11]
Here’s what the major silver-related commentary dated Sunday, December 21, 2025 is saying.
FXLeaders’ weekly outlook says silver closed at about $67.17 last Friday, framing it as a decisive post-breakout hold. Their technical roadmap is clear:
DailyForex’s weekly forecast (created Dec. 21) emphasizes the strength of the breakout while warning that moves are “messy” and volatility is elevated. The analyst’s stance: being long can still make sense, but with smaller position sizing because silver is leading the whole precious-metals complex and can whip around quickly. [13]
A PTI wire carried by The Week warns that gold and silver may take a breather next week due to year-end thin volumes, while traders focus on U.S. macro releases (GDP, housing data, durable goods, consumer confidence). [14]
It also notes that on India’s MCX:
Moneycontrol’s Dec. 21 commodities note (from Kotak Securities’ research head) presents a clean technical framework for MCX silver:
The Times of India also flags the same holiday dynamic: lower participation into Christmas and New Year can create higher sensitivity to economic releases, potentially producing sudden dips or sharp squeezes even if the longer-term trend remains constructive. [17]
With silver trading in “price discovery” territory after repeated all-time highs, forecasts are converging around a simple question:
Bull case (continuation):
Base case (pause / churn):
Bear case (profit-taking / air pocket):
Even among analysts warning about short-term volatility, the medium-term narrative remains bullish in much of today’s commentary—because the same forces that drove the 2025 surge aren’t clearly fading yet.
The important nuance: those upside projections don’t imply a smooth path. Silver is notorious for sharp corrections inside bull markets, and multiple analysts publishing this week have highlighted how quickly “stretched” conditions can unwind.
Silver’s appeal is also its danger: it often behaves like “gold with a turbocharger.” That’s great on the way up—until it isn’t.
One widely circulated warning in recent coverage: Barron’s highlighted research suggesting silver has reached historically extreme deviations versus major moving averages, conditions that in past cycles (like 2011 and 2020) were followed by steep pullbacks exceeding 20%. [25]
That doesn’t invalidate the bullish thesis—it simply reframes timing and risk. In practical terms, it means the next big move could be either:
Even in a holiday-shortened week, silver traders are watching a tight set of macro inputs because they feed directly into the dollar-rate-real-yield equation.
Across today’s Dec. 21 outlook pieces, the most-cited catalysts are:
And the most important market-structure point: because of the holidays, price action may be “subdued” at times—but paradoxically swings can be larger when participation is thin. That’s exactly why multiple analysts are warning about volatility even while staying constructive on trend. [30]
Silver is ending 2025 near record highs around $67/oz, backed by a narrative that blends Fed-cut expectations, strong industrial demand, and supply tightness with heavy investment flows. [31]
For the week ahead, the market is essentially split into two camps:
1. www.reuters.com, 2. www.theweek.in, 3. www.reuters.com, 4. www.reuters.com, 5. www.theweek.in, 6. www.reuters.com, 7. www.reuters.com, 8. www.reuters.com, 9. www.reuters.com, 10. www.reuters.com, 11. www.reuters.com, 12. www.fxleaders.com, 13. www.dailyforex.com, 14. www.theweek.in, 15. www.theweek.in, 16. www.moneycontrol.com, 17. timesofindia.indiatimes.com, 18. www.fxleaders.com, 19. www.theweek.in, 20. www.fxleaders.com, 21. www.marketpulse.com, 22. www.livemint.com, 23. www.reuters.com, 24. www.livemint.com, 25. www.barrons.com, 26. www.theweek.in, 27. www.fxleaders.com, 28. www.theweek.in, 29. www.moneycontrol.com, 30. www.theweek.in, 31. www.reuters.com, 32. www.fxleaders.com, 33. www.barrons.com

 Price Forecast: Gold Rally Accelerates After 81.44 Breakout")


