The main tag of Gold Price Articles.
You can use the search box below to find what you need.
[wd_asp id=1]
The main tag of Gold Price Articles.
You can use the search box below to find what you need.
[wd_asp id=1]
Despite the attempt of natural gas price to form some positive trades, its repeated positioning below the 55-period moving average, which acts as a strong barrier at 3.360$, supports the chances of the bearish path dominating the near-term trading.
Additionally, the Stochastic indicator’s exit from the overbought level will increase negative pressure on the current trades. Therefore, we maintain our bearish expectations, which may target the 2.920$ and 2.800$ levels respectively in the near term. As for activating a bullish attack, the price needs to form a strong positive surge and stabilize above the resistance level at 3.530$.
The expected trading range for today is between 2.920$ and 3.300$.
Trend forecast: Bearish
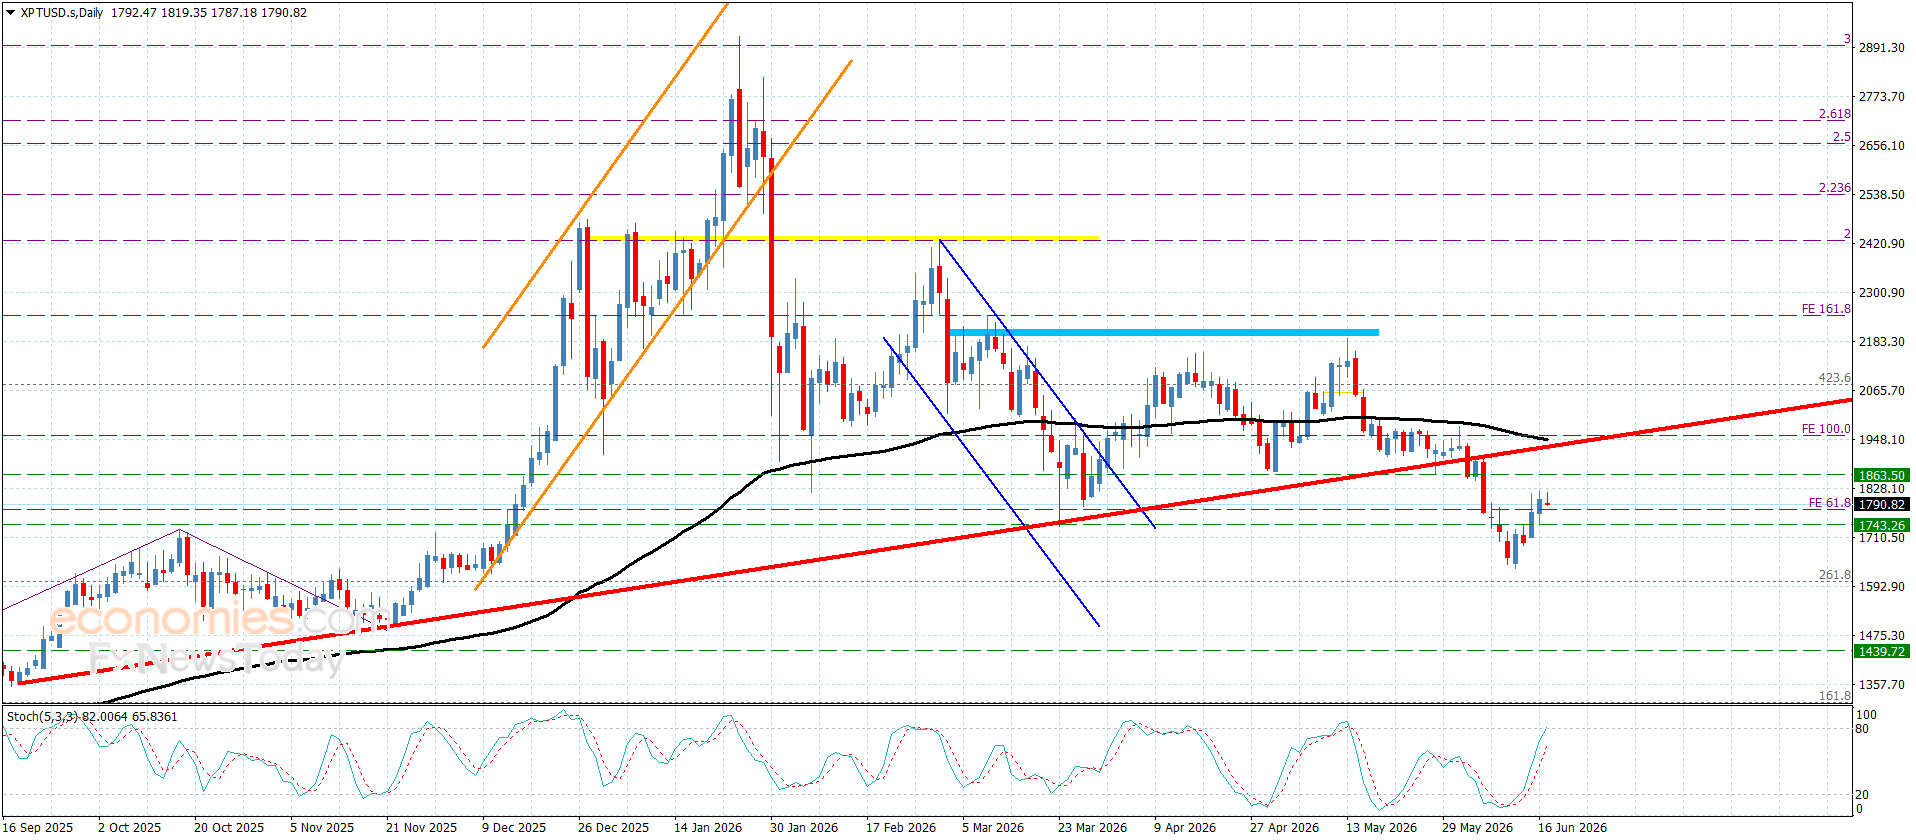
Platinum price remains affected by conflicting main indicators, forcing it to postpone negative attempts and deliver weak trading, stabilizing from yesterday near the $1800.00 level. We expect that with the barrier at $1865.00 remaining intact and the Stochastic indicator approaching the overbought level, the price will begin activating negative attempts, targeting the $1695.00 level soon, followed by the stable obstacle at $1640.00.
The risk of a trend reversal and the formation of a new path remains possible if the price successfully breaks the resistance extending toward $1925.00 and holds above it. This would enable it to achieve noticeable gains by advancing first toward $1990.00 and $2060.00 respectively.
The expected trading range for today is between $1700.00 and $1840.00.
Trend forecast: Bearish
Domestic coffee prices today
Coffee prices today in the domestic market did not record fluctuations compared to the previous session. The average coffee price reached 89,300 VND/kg.
In Dak Lak, coffee prices are recorded at 89,300 VND/kg. Gia Lai also has the same price of 89,300 VND/kg.
In Lam Dong, today’s coffee price reached 89,000 VND/kg, the lowest among the surveyed localities. Meanwhile, the old Dak Nong area was recorded at 8,900 VND/kg.
Thus, domestic coffee prices currently fluctuate in the range of 89,000-8,900 VND/kg. The highest price in the survey group is 8,900,000 VND/kg in Dak Lak, Gia Lai and the old Dak Nong area.
The USD/VND exchange rate according to Vietcombank was recorded at 26,083 VND/USD, an increase of 10 VND.
World coffee prices
On the London exchange, Robusta coffee futures for July 2026 reached 3,669 USD/ton, up 62 USD/ton, equivalent to 1.72%. September 2026 futures reached 3,598 USD/ton, up 69 USD/ton, equivalent to 1.96%.
Further terms also increased sharply. Robusta November 2026 term reached 3,545 USD/ton, up 79 USD/ton; January 2027 term reached 3,494 USD/ton, up 85 USD/ton; March 2027 term reached 3,459 USD/ton, up 84 USD/ton.
On the New York exchange, Arabica coffee prices increased very strongly. July 2026 futures reached 277.25 US cents/lb, up 14.30 cents/lb, equivalent to 5.44%. September 2026 futures reached 272.80 US cents/lb, up 13.60 cents/lb, equivalent to 5.25%.
For long-term terms, Arabica December 2026 reached 263.60 US cents/lb, up 11.85 cents/lb; March 2027 term reached 259.75 US cents/lb, up 10.60 cents/lb; May 2027 term reached 259.40 US cents/lb, up 10.30 cents/lb.
This development shows that world coffee prices are increasing more strongly than domestic coffee prices. In the session on June 17, Arabica was the group that increased more prominently than Robusta.
Coffee price assessment
World coffee prices rose sharply on Tuesday, both reaching their highest level in about 5 weeks. The main driver came from concerns that prolonged rain in Brazil could slow down coffee harvest progress.
Brazil’s weather is currently a factor closely monitored by the market. Rain during harvesting can disrupt harvesting and drying operations, while increasing the risk of affecting grain quality. This supports coffee prices in the short term, especially Arabica.
Coffee inventories on the ICE exchange decreasing in recent months also contributed to supporting prices. According to Barchart, Arabica inventories on the ICE fell to 396,957 bags on Tuesday, the lowest level in more than 6 months. Meanwhile, Robusta inventories fell to a 2-year low in May, although they increased again to 3,991 lots in the most recent session.
The El Niño factor continues to be mentioned as a risk to supply. If this phenomenon changes rainfall in Brazil during the coffee flowering period in September and October, the next crop prospects may be affected.
However, the upward momentum of coffee prices is still under pressure from the prospect of large supply. USDA/FAS forecasts that Brazil’s coffee production in the 2026/27 crop year may reach 71.9 million bags, an increase of about 14% over the same period. Rabobank also raised its global Arabica surplus forecast to 9.5 million bags, higher than the previous 7 million bags.
On the Robusta side, the increase in Vietnam’s coffee exports is a factor that can limit the price increase momentum. According to statistics from the Statistics Department (Ministry of Finance), Vietnam’s coffee exports in the first 5 months of 2026 reached 922,000 tons, an increase of 7.9% compared to the same period.
In general, coffee prices today in the world market increased sharply thanks to Brazil’s weather risks, low inventories and concerns about El Niño. However, domestic coffee prices remained flat, showing that the domestic market has not fully reflected the upward momentum of the two international exchanges.
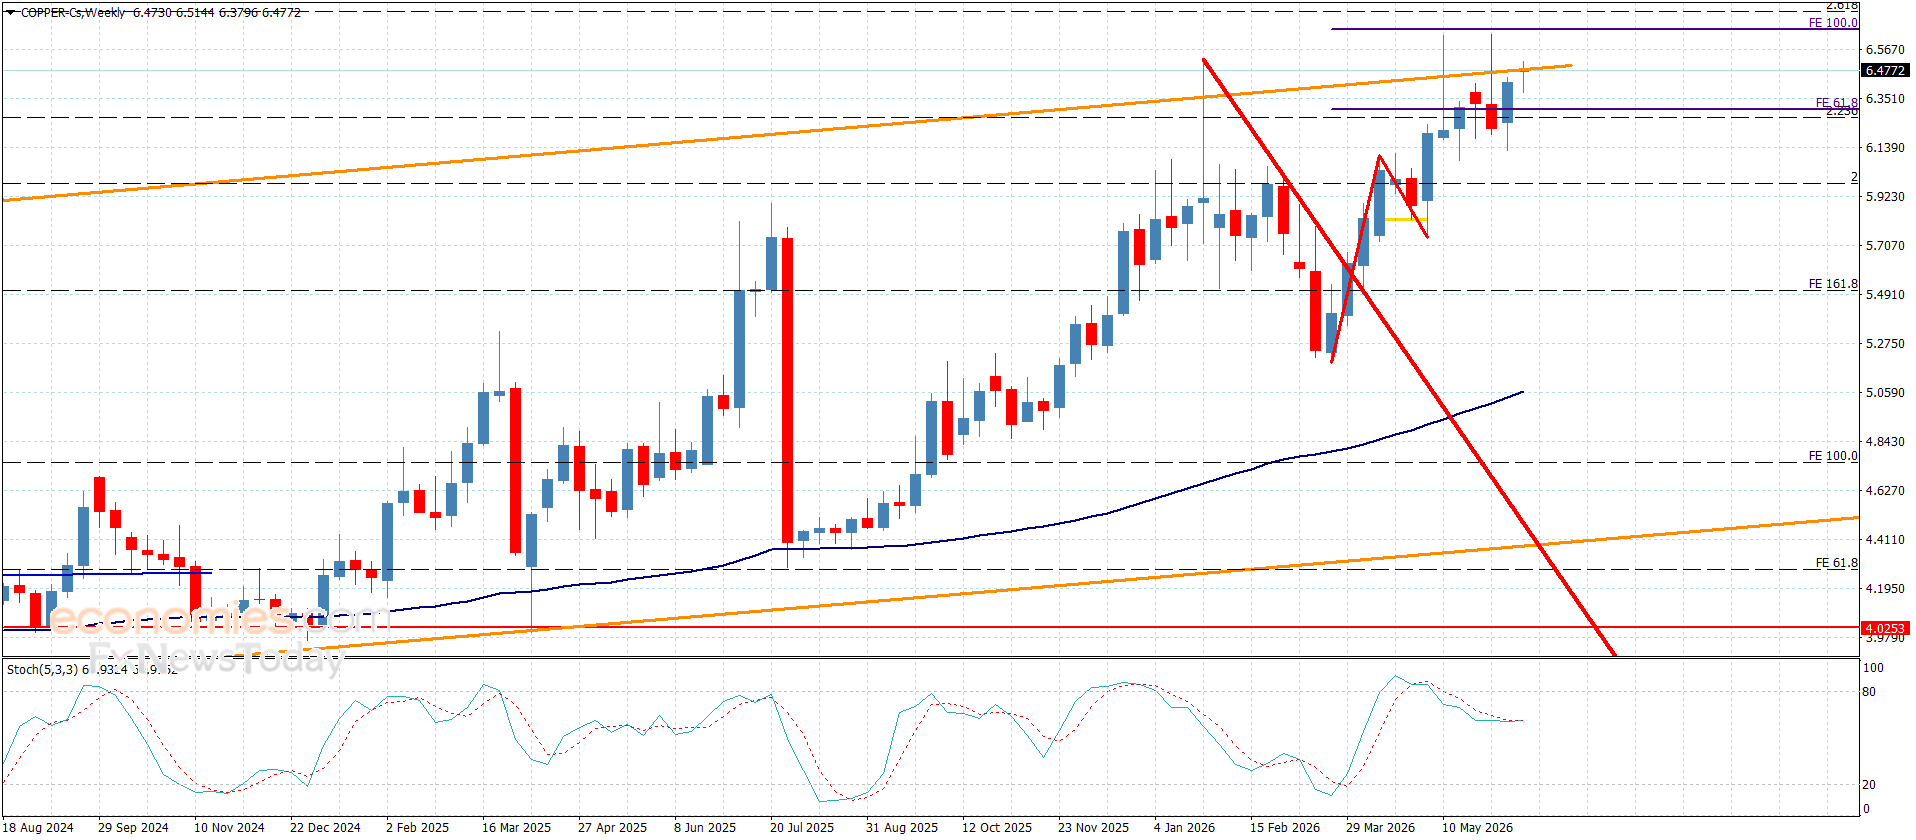
Copper price has continued to show mixed sideways trading, affected by its position below the stable resistance at $6.6000, which is limiting the chances of resuming bullish attempts, with repeated fluctuations forming near the $6.4500 level.
We expect that the Stochastic indicator’s attempt to provide negative momentum may lead the price to start forming downward corrective waves, through which it may pressure the $6.2500 level and then attempt to reach the additional support level at $6.1000.
The expected trading range for today is between $5.2500 and $6.6000
Trend forecast: Bearish
The S&P 500 Index SPY today is down -0.18%, the Dow Jones Industrial Average  DIA is up +0.69%, and the Nasdaq 100 Index
  QQQ is down -0.83%. June E-mini S&P futures (ESM26) are down -0.20%, and June E-mini Nasdaq futures (NQM26) are down -0.85%.
Stock indexes are mixed today, with the Dow Jones Industrials posting a new all-time high. The weakness in energy producers from the plunge in crude oil prices is weighing on the broader market. Also, weakness in software stocks is a drag on the overall market. In addition, today’s weaker-than-expected US housing starts and building permits reports are negative for stocks.
Join 200K+ Subscribers: Find out why the midday Barchart Brief newsletter is a must-read for thousands daily.
Stocks are supported as crude oil prices dropped another -3% today to a 3.25-month low, easing inflation expectations and supporting stocks and bonds. Stocks have carryover support from Monday’s surge after the US and Iran agreed to end their war and reopen the Strait of Hormuz, stoking risk-on sentiment in asset markets. The 10-year T-note yield is down -2 bp to 4.45%.
The market’s focus will turn to the 2-day FOMC meeting that begins today, the first under the leadership of new Fed Chair Kevin Warsh. While the Fed is expected to keep interest rates unchanged, the spotlight will be on how Mr. Warsh navigates the post-meeting press conference and the outlook for inflation.
US May housing starts fell -15.4% m/m to a 6-year low of 1.177 million, weaker than expectations of 1.430 million. May building permits, a proxy for future construction, fell -0.7% m/m to 1.413 million, weaker than expectations of 1.418 million.
The US May import price index ex-petroleum rose +0.8% m/m, stronger than expectations of +0.5% m/m.
WTI crude oil prices (CLN26) are down more than -3% today at a 3.25-month low due to the US-Iran deal to reopen the Strait of Hormuz, boosting expectations for a revival in oil supplies. Goldman Sachs today cut its price forecast on Brent crude to $80 a barrel in Q4 of this year, down from $90 a barrel, and said it expects Persian Gulf crude exports to return to pre-war levels by the end of July, one month earlier than previously expected.
The markets are discounting a 4% chance of a +25 bp rate hike at the conclusion of the Tue/Wed FOMC meeting.
Overseas stock markets are mixed today. The Euro Stoxx 50 is up +0.56%. China’s Shanghai Composite fell from a 1.5-week high and closed down -0.11%. Japan’s Nikkei-225 Stock Average rose to a new all-time high and closed up +0.13%.
Interest Rates
September 10-year T-notes (ZNU6) today are up +4.5 ticks, and the 10-year T-note yield is down -2.6 bp to 4.447%. Sep T-notes are moving higher today amid the fall in WTI crude oil to a 3.25-month low, which has reduced inflation expectations and is bullish for T-notes. Also, weaker-than-expected US May housing starts and building permits are supportive of T-notes. In addition, markets are hoping for a less hawkish FOMC meeting this week, given that oil prices should decline over time if the Strait of Hormuz reopens as expected.
European government bond yields are moving lower today. The 10-year German bund yield fell to an 8-week low of 2.920% and is down -1.6 bp to 2.938%. The 10-year UK gilt yield is down -0.8 bp to 4.804%.
Eurozone Q1 labor costs were revised downward to +3.2% y/y from the previously reported +3.4% y/y.
The German Jun ZEW survey expectations of economic growth rose +20.7 to a 4-month high of 10.5, stronger than expectations of -5.5.
Swaps are discounting a 17% chance of a +25 bp ECB rate hike at its next policy meeting on July 23.
US Stock Movers
Software stocks are falling today, a negative factor for the overall market. Atlassian Corp  TEAM and Palantir Technologies
  PLTR are down more than -3%, and ServiceNow
  NOW and Workday
  WDAY are down more than -2%. Also, Microsoft
  MSFT, Salesforce
  CRM, and Oracle
  ORCL are down more than -1%. In addition, Intuit
  INTU is down -0.90% and Datadog
  DDOG is down -0.50%.
Cybersecurity stocks are under pressure today, weighing on the broader market. Zscaler  ZS is down more than -3%, and Okta
  OKTA and Fortinet
  FTNT are down more than -2%. Also, CrowdStrike Holdings
  CRWD, Palo Alto Networks
  PANW, and Cloudflare
  NET are down more than -1%.
Energy stocks and service providers are moving lower today with WTI crude oil down more than -3% to a 3.25-month low. APA Corp  APA and Valero Energy
  VLO are down more than -2%. Also, Baker Hughes
  BKR, ConocoPhillips
  COP, Diamondback Energy
  FANG, Devon Energy
  DVN, Haliburton
  HAL, and Occidental Petroleum
  OXY are down more than -1%.
Airline stocks and cruise line operators are rallying today as the -3% decline in WTI crude oil prices lowers fuel costs and boosts the profitability prospects for the companies. American Airlines Group  AAL and Southwest Airlines
  LUV are up more than +4%, and Norwegian Cruise Line Holdings
  NCLH is up more than +2%. Also, Carnival CCCL, Alaska Air Group
  ALK, and Royal Caribbean Cruises
  RCL are up more than +1%.
Mining stocks are climbing today with rallies in gold, silver, and copper prices. Newmont Corp  NEM, Coeur Mining
  CDE, and Barrick Mining
  B are up more than +2%, and Anglogold Ashanti
  AU is up more than +1%. Also, Hecla Mining
  HL is up +0.54%, and Freeport McMoRan
  FCX is up 0.19%.
Space Exploration Technologies  SPCX is up more than +7%, adding to the +37% gain over the past two sessions on positive carryover from its record $75 billion initial public offering (IPO) late last week, which was more than four times oversubscribed, indicating strong demand for the stock.
Valmont Industries  VMI is up more than +5% after projecting a goal of $5.4 billion in organic net sales and an EPS target of $35 by the end of 2029.
Mobileye Global  MBLY is up by more than +3% after announcing plans to expand its robotaxi activities beyond self-driving technology into full ownership of an autonomous ride-hailing business.
Edwards Lifesciences  EW is up more than +3% after the US government published a coverage proposal for transcatheter aortic valve replacement, a positive development for the company.
Huntsman  HUN is down more than -20% after agreeing to merge with Olin in an all-stock merger of equals.
Huson Pacific Properties  HPP is down more than -4% after Bank of America Global Research downgraded the stock to underperform from neutral with a price target of $14.
Dave & Buster’s Entertainment  PLAY is down more than -2% after reporting Q1 revenue of $559.2 million, weaker than the consensus of $580.3 million.
Tractor Supply Co  TSCO is down more than -2% to lead losers in the S&P 500 after several analysts cut their price targets on the stock.
Earnings Reports(6/16/2026)
John Wiley & Sons Inc (WLY) and La-Z-Boy Inc (LZB).
On the date of publication, Rich Asplund did not have (either directly or indirectly) positions in any of the securities mentioned in this article. All information and data in this article is solely for informational purposes.For more information please view the Barchart Disclosure Policy here.
Silver prices edged lower on Tuesday as traders took profit after a sharp relief rally driven by the US-Iran peace framework and lower oil prices.
 XAGUSD traded near $69.85 in early European dealing, retreating from a weekly high as attention shifted from geopolitics to the Federal Reserve’s policy decision on Wednesday.
The pullback was measured rather than disorderly.
Lower energy prices have eased some inflation concerns, while the dollar remains near recent lows.
Even so, silver still faces a difficult technical setup, with momentum indicators showing that buyers have yet to regain control of the short-term trend.
Fed expectations keep silver supported
The biggest question for silver is whether the Fed sounds less worried about inflation after the fall in oil prices.
The US central bank is widely expected to hold rates in a 3.50% to 3.75% range this week, but the statement and Chair Kevin Warsh’s comments will matter more than the decision itself.
Silver, like gold, does not pay interest. That makes it sensitive to shifts in rate expectations and the dollar.
Traders have cut the probability of a December US rate hike to about 58%, from nearly 70% last week, according to CME FedWatch data.
Edward Meir, an analyst at Marex, told Reuters that a dovish signal from Warsh could weaken the dollar and trigger another rally in precious metals.
The same logic applies to silver, especially after Monday’s strong rebound.
Peace deal limits the downside
The US-Iran framework has also helped improve sentiment across commodities.
The proposed reopening of the Strait of Hormuz has pushed oil lower, easing fears that energy costs will keep inflation elevated for longer.
That has offered a cushion to silver, even as traders lock in gains. A lower oil price reduces pressure on central banks to tighten further, which is generally supportive for non-yielding assets.
Still, markets are not treating the deal as risk-free.
Details of the agreement remain limited, and investors are waiting to see whether shipping through Hormuz can return safely and predictably. Any setback in talks could bring back demand for havens, but it could also revive inflation fears if crude prices jump again.
Technical picture stays fragile
Silver’s chart still points to caution.
The metal remains below the Bollinger Bands’ 20-day simple moving average and the 100-day simple moving average, keeping the broader bias tilted lower.
The relative strength index is also below the midline, suggesting weak momentum rather than a clear bullish turn.
The first resistance sits near $72.25. A move above that level could open the way to $74.14, followed by the 100-day SMA near $78.55 and the upper Bollinger band around $80.72.
On the downside, $63.80 remains the main support area to watch. Until silver clears nearby resistance, rallies may continue to face selling pressure.
The S&P 500 Index SPY today is up +0.11%, the Dow Jones Industrial Average DIA is up +0.57%, and the Nasdaq 100 Index QQQ is down -0.18%. June E-mini S&P futures (ESM26) are up +0.09%, and June E-mini Nasdaq futures (NQM26) are down -0.14%.
Stock indexes are mixed today, with the Dow Jones Industrials posting a new all-time high. Stocks are supported as crude oil prices dropped another -3% today to a 3.25-month low, easing inflation expectations and supporting stocks and bonds. Stocks have carryover support from Monday’s surge after the US and Iran agreed to end their war and reopen the Strait of Hormuz, stoking risk-on sentiment in asset markets. The 10-year T-note yield is down -2 bp to 4.45%.
Join 200K+ Subscribers: Find out why the midday Barchart Brief newsletter is a must-read for thousands daily.
Gains in stocks are limited today amid weakness in energy producers from the plunge in crude oil prices and today’s weaker-than-expected US housing starts and building permits reports.
The market’s focus will turn to the 2-day FOMC meeting that begins today, which will be the first under the leadership of new Fed Chair Kevin Warsh. While the Fed is expected to keep interest rates unchanged, the spotlight will be on how Mr. Warsh navigates the post-meeting press conference and the outlook for inflation.
US May housing starts fell -15.4% m/m to a 6-year low of 1.177 million, weaker than expectations of 1.430 million. May building permits, a proxy for future construction, fell -0.7% m/m to 1.413 million, weaker than expectations of 1.418 million.
The US May import price index ex-petroleum rose +0.8% m/m, stronger than expectations of +0.5% m/m.
WTI crude oil prices (CLN26) are down more than -3% today at a 3.25-month low due to the US-Iran deal to reopen the Strait of Hormuz, boosting expectations for a revival in oil supplies. Goldman Sachs today cut its price forecast on Brent crude to $80 a barrel in Q4 of this year, down from $90 a barrel, and said it expects Persian Gulf crude exports to return to pre-war levels by the end of July, one month earlier than previously expected.
The markets are discounting a 4% chance of a +25 bp rate hike at the conclusion of the Tue/Wed FOMC meeting.
Overseas stock markets are mixed today. The Euro Stoxx 50 is up +0.61%. China’s Shanghai Composite fell from a 1.5-week high and closed down -0.11%. Japan’s Nikkei-225 Stock Average rose to a new all-time high and closed up +0.13%.
Interest Rates
September 10-year T-notes (ZNU6) today are up +4 ticks, and the 10-year T-note yield is down -2.0 bp to 4.453%. Sep T-notes are moving higher today amid the fall in WTI crude oil to a 3.25-month low, which has reduced inflation expectations and is bullish for T-notes. Also, weaker-than-expected US May housing starts and building permits are supportive of T-notes. In addition, markets are hoping for a less hawkish FOMC meeting this week, given that oil prices should decline over time if the Strait of Hormuz reopens as expected.
European government bond yields are moving lower today. The 10-year German bund yield fell to an 8-week low of 2.921% and is down -3.0 bp to 2.924%. The 10-year UK gilt yield is down -3.0 bp to 4.782%.
Eurozone Q1 labor costs were revised downward to +3.2% y/y from the previously reported +3.4% y/y.
The German Jun ZEW survey expectations of economic growth rose +20.7 to a 4-month high of 10.5, stronger than expectations of -5.5.
Swaps are discounting an 17% chance of a +25 bp ECB rate hike at its next policy meeting on July 23.
US Stock Movers
Chipmakers and AI infrastructure stocks are pushing higher today, supporting gains in the broader market. Western Digital  WDC is up more than +6% to lead gainers in the S&P 500 and Nasdaq 100, and Seagate Technology Holdings Plc
  STX and Qualcomm
  QCOM are up more than +4%. Also, ARM Holdings Plc
  ARM is up more than +2%, and Analog Devices
  ADI, SanDisk
  SNDK, and Microchip Technology
  MCHP are up more than +1%.
Airline stocks and cruise line operators are rallying today as the -3% decline in WTI crude oil prices lowers fuel costs and boosts the profitability prospects for the companies. American Airlines Group AAL and Southwest Airlines LUV are up more than +3%, and Carnival CCCL, Alaska Air Group ALK, and Norwegian Cruise Line Holdings NCLH are up more than +2%. Also, Royal Caribbean Cruises RCL, United Airlines Holdings  UAL, and Delta Air Lines
  DAL are up more than +1%.
Mining stocks are climbing today with rallies in gold, silver, and copper prices. Coeur Mining CDE is up more than +3%, and Hecla Mining HL, Newmont Corp NEM, Barrick Mining B, and Southern Copper  SCCO are up more than +2%. Also, Freeport McMoRan FCX and Anglogold Ashanti AU are up more than +1%.
Cybersecurity stocks are under pressure today, limiting gains in the broader market. Palo Alto Networks PANW, Zscaler ZS, and Fortinet FTNT are down more than -2%, and CrowdStrike Holdings CRWD is down more than -1%.
Energy stocks and service providers are moving lower today with WTI crude oil down more than -3% to a 3.25-month low. Valero Energy VLO is down more than -2%. Also, ConocoPhillips COP, Diamondback Energy FANG, Devon Energy DVN, Haliburton HAL, APA Corp APA, and Marathon Petroleum  MPC are down more than -1%.
Space Exploration Technologies SPCX is up more than +13%, adding to the +37% gain over the past two sessions on positive carryover from its record $75 billion initial public offering (IPO) late last week, which was more than four times oversubscribed, indicating strong demand for the stock.
Mobileye Global MBLY is up by more than +5% after announcing plans to expand its robotaxi activities beyond self-driving technology into full ownership of an autonomous ride-hailing business.
Valmont Industries VMI is up more than +3% after projecting a goal of $5.4 billion in organic net sales and an EPS target of $35 by the end of 2029.
Edwards Lifesciences EW is up more than +3% after the US government published a coverage proposal for transcatheter aortic valve replacement, a positive development for the company.
Huntsman HUN is down more than -13% after agreeing to merge with Olin in an all-stock merger of equals.
Dave & Buster’s Entertainment PLAY is down more than -6% after reporting Q1 revenue of $559.2 million, weaker than the consensus of $580.3 million.
Tractor Supply Co TSCO is down more than -3% to lead losers in the S&P 500 after several analysts cut their price targets on the stock.
Huson Pacific Properties HPP is down more than -1% after Bank of America Global Research downgraded the stock to underperform from neutral with a price target of $14.
Tanger  SKT is down more than -1% after Bank of America Global Research downgraded the stock to underperform from neutral with a price target of $38.
Earnings Reports(6/16/2026)
John Wiley & Sons Inc (WLY) and La-Z-Boy Inc (LZB).
On the date of publication, Rich Asplund did not have (either directly or indirectly) positions in any of the securities mentioned in this article. All information and data in this article is solely for informational purposes.For more information please view the Barchart Disclosure Policy here.
More news from Barchart
TradingKey – As of today’s (June 16) European session, the crude oil market has continued to weaken on expectations of an impending preliminary US-Iran agreement. The market may begin trading on the supply recovery logic, increasing downward pressure on oil prices. As of press time, WTI crude ( USOIL) fell 1.63% to $79.85.
Recently, as a preliminary peace framework between the U.S. and Iran nears completion, the market’s trading logic has begun to shift. Trump has signaled a push to sign the agreement, reopen the Strait of Hormuz, and lift some blockades, while Iran has also confirmed progress on the text of the agreement, prompting the crude market to potentially price in a supply recovery ahead of schedule. Looking at the chart, WTI fell to near $80, indicating that the market is rapidly squeezing out the risk premium previously generated by geopolitical tensions.
However, a recovery in supply does not mean oil prices will experience a one-way decline. Even if the Strait of Hormuz is reopened, actual tanker transit, shipping insurance, port scheduling, and the resumption of buyer purchases will all take time. Market analysts believe that restoring tanker traffic could take several weeks, and the resumption of production and exports may also proceed in phases. As long as the agreement has not been officially signed, or if the implementation details remain unclear after signing, oil prices still have room for volatile fluctuations.
Meanwhile, inventories are also providing some support for oil prices. The EIA’s latest Short-Term Energy Outlook shows that restricted transit through the Strait of Hormuz has already significantly tightened the global oil market, with global petroleum inventories projected to decline by an average of 8.5 million barrels per day in the second quarter of 2026. This indicates that the prior conflict in the Middle East was not just sentiment-driven but has caused actual inventory depletion. Even if the U.S.-Iran agreement progresses, replenishing global inventories will take time. If summer travel demand rebounds, low inventory levels could limit the room for further deep declines in WTI.
On the demand side, this remains the key factor capping any rebound in oil prices. Currently, global crude demand is sluggish, with Asian demand performing particularly weakly. China’s crude imports in May fell 29% year-on-year to an eight-year low, indicating that high oil prices, supply instability, and pressure on refining margins have significantly dampened buying interest. Weakness on the demand side means that once Middle Eastern supply recovers, it will be difficult for the market to continue justifying high oil prices with supply tightness. Meanwhile, U.S. crude and refined product exports remain high, mitigating the Middle East supply gap to some extent and leaving the spot market less tight than previously expected.
WTI Crude Oil Price Weekly Chart, Source: TradingView
From WTI’s weekly chart, following a sharp 6.6% drop last week, oil prices opened lower with a gap and continued to decline this week, significantly boosting bearish momentum in the market. The downward trend could persist for the remainder of the trading week.
Currently, WTI’s primary downside target is to test the support at the April low of $78.97. If this level fails to hold, oil prices could open up room for further decline toward the $76.60 support level, and potentially even move lower to fill the gap between $67.28 and $75.00.
On the upside, if WTI fails to break below the $78.97 support, oil prices may see a short-term technical rebound, with the primary target of filling the $84.28-$81.40 gap.
This content was translated using AI and reviewed for clarity. It is for informational purposes only.
Silver Price (XAG/USD) trades in negative territory around $69.85 during the early European trading hours on Tuesday. The white metal retreats from a weekly high as traders book some profits ahead of the US Federal Reserve (Fed) interest rate decision.
The US central bank is widely expected to keep its benchmark interest rate unchanged at a target range of 3.50% to 3.75% at its upcoming policy meeting on Wednesday.
Traders will closely monitor the developments surrounding the US-Iran peace deal. The progress of a preliminary framework agreement between both countries has significantly eased geopolitical tensions and might help limit Silver’s losses in the near term.
Bets on Fed rate hikes receded after the framework deal, supporting the precious metals, non-yielding assets. Markets cut the chance of a US rate hike in December to 58% from nearly 70% last week, according to the CME FedWatch tool.
In the daily chart, XAG/USD remains under clear downside pressure as price holds below the Bollinger Bands’ 20-day simple moving average and the 100-day simple moving average, keeping the broader trend tilted lower. The Relative Strength Index (14) hovers just below the midline, hinting at weak but not extreme bearish momentum while silver consolidates in the lower half of its recent volatility envelope.
On the topside, initial resistance is located at the Bollinger Bands’ middle line around $72.25. The next hurdle to watch is the June 5 high of $74.14, en route to the 100-day SMA near $78.55 and the upper Bollinger band around $80.72. On the downside, the next notable support aligns with the lower Bollinger band at roughly $63.80, where volatility-based demand could attempt to slow the current bearish phase.
(The technical analysis of this story was written with the help of an AI tool.)
Silver is a precious metal highly traded among investors. It has been historically used as a store of value and a medium of exchange. Although less popular than Gold, traders may turn to Silver to diversify their investment portfolio, for its intrinsic value or as a potential hedge during high-inflation periods. Investors can buy physical Silver, in coins or in bars, or trade it through vehicles such as Exchange Traded Funds, which track its price on international markets.
Silver prices can move due to a wide range of factors. Geopolitical instability or fears of a deep recession can make Silver price escalate due to its safe-haven status, although to a lesser extent than Gold’s. As a yieldless asset, Silver tends to rise with lower interest rates. Its moves also depend on how the US Dollar (USD) behaves as the asset is priced in dollars (XAG/USD). A strong Dollar tends to keep the price of Silver at bay, whereas a weaker Dollar is likely to propel prices up. Other factors such as investment demand, mining supply – Silver is much more abundant than Gold – and recycling rates can also affect prices.
Silver is widely used in industry, particularly in sectors such as electronics or solar energy, as it has one of the highest electric conductivity of all metals – more than Copper and Gold. A surge in demand can increase prices, while a decline tends to lower them. Dynamics in the US, Chinese and Indian economies can also contribute to price swings: for the US and particularly China, their big industrial sectors use Silver in various processes; in India, consumers’ demand for the precious metal for jewellery also plays a key role in setting prices.
Silver prices tend to follow Gold’s moves. When Gold prices rise, Silver typically follows suit, as their status as safe-haven assets is similar. The Gold/Silver ratio, which shows the number of ounces of Silver needed to equal the value of one ounce of Gold, may help to determine the relative valuation between both metals. Some investors may consider a high ratio as an indicator that Silver is undervalued, or Gold is overvalued. On the contrary, a low ratio might suggest that Gold is undervalued relative to Silver.
Domestic coffee prices today
Coffee prices today in the domestic market recorded a slight downward trend in some key localities. According to records, the average coffee price reached 89,300 VND/kg, down 300 VND/kg compared to the previous session.
In Dak Lak, coffee prices were recorded at 89,300 VND/kg, down 200 VND/kg. Gia Lai also had a price of 89,300 VND/kg, down 200 VND/kg.
In Lam Dong, coffee prices today reached 89,000 VND/kg, not recording changes compared to the previous session. Meanwhile, the old Dak Nong area was recorded at 89,300 VND/kg, down 400 VND/kg.
Thus, domestic coffee prices currently fluctuate around 89,000-89,300 VND/kg. The highest price in the survey group is 89,300 VND/kg in Dak Lak, Gia Lai and the old Dak Nong area.
The USD/VND exchange rate according to Vietcombank is recorded at 26,073 VND/USD.
World coffee prices
On the London exchange, the price of Robusta coffee futures in July 2026 reached 3,607 USD/ton, an increase of 13 USD/ton, equivalent to 0.36%. The term for September 2026 reached 3,529 USD/ton, an increase of 4 USD/ton, equivalent to 0.11%.
Further terms also increased slightly. Robusta November 2026 term reached 3,466 USD/ton, up 14 USD/ton; January 2027 term reached 3,409 USD/ton, up 19 USD/ton; March 2027 term reached 3,375 USD/ton, up 21 USD/ton.
On the New York exchange, Arabica coffee prices increased more strongly than Robusta. July 2026 futures reached 262.95 US cents/lb, up 5.75 cents/lb, equivalent to 2.24%. September 2026 futures reached 259.20 US cents/lb, up 5.80 cents/lb, equivalent to 2.29%.
In distant terms, Arabica in December 2026 reached 251.75 US cents/lb, an increase of 5.30 cents/lb; March 2027 futures reached 249.15 US cents/lb, an increase of 4.95 cents/lb; May 2027 futures reached 249.10 US cents/lb, an increase of 4.95 cents/lb.
This development shows that world coffee prices continue to maintain the recovery momentum, although domestic coffee prices have not reflected the same direction in today’s session.
Coffee price assessment
According to Barchart, world coffee prices continued to rise in the first session of the week, with Arabica reaching a 2-week high and Robusta reaching a 5-week high. The main driver came from concerns that prolonged rain in Brazil could slow down coffee harvest progress.
Weather factors in Brazil are being closely monitored by the market. Light to heavy rain in coffee growing areas can disrupt harvesting and drying operations and affect the quality of seeds. This is the reason for supporting coffee prices in the short term, especially for Arabica.
Coffee inventory on the ICE exchange decreasing in recent months is also a factor supporting prices. Arabica inventory on the ICE fell to its lowest level in more than 6 months last weekend. Robusta inventory also touched a 2-year low in May and is still in the low zone.
However, the coffee market still faces pressure factors. USDA/FAS forecasts that Brazil’s coffee output in the 2026/27 crop year may reach 71.9 million bags, an increase of about 14% over the same period. Rabobank also raised its global Arabica surplus forecast to 9.5 million bags, higher than the previous level of 7 million bags.
On the Robusta side, increased Vietnamese coffee exports are a factor that can limit price increases. According to data from the Customs Department (Ministry of Finance), Vietnam’s coffee exports in the first 5 months of 2026 reached 922,000 tons, an increase of 7.9% compared to the same period.
In general, world coffee prices are being supported by Brazilian weather risks, low inventories and concerns that El Niño may affect the flowering cycle in the near future. However, the prospect of large supply from Brazil and Robusta exports from Vietnam are still factors that can curb the increase in coffee prices.