The main tag of Gold Today Price Articles.
You can use the search box below to find what you need.
[wd_asp id=1]
The main tag of Gold Today Price Articles.
You can use the search box below to find what you need.
[wd_asp id=1]
The article covers the following subjects:
Consider long positions from corrections above 67.00 with a target of 91.80–105.17.
Breakout and consolidation below 67.00 will allow the asset to continue declining to the levels of 62.00–58.50.
A descending correction appears to have formed as the second wave of larger degree (2) on the weekly chart, with wave C of (2) completed as its part. On the daily time frame, an ascending third wave (3) is likely developing. Within it, the first wave of smaller degree 1 of (3) has formed, and a downward correction has been completed as the second wave 2 of (3). On the H4 time frame, wave 3 of (3) is presumably starting to develop. If this assumption is correct, WTI will continue to rise to 91.80–105.17. The level of 67.00 is critical in this scenario as a breakout below it will enable the asset to continue declining to the levels of 62.00–58.50.
This forecast is based on the Elliott Wave Theory. When developing trading strategies, it is essential to consider fundamental factors, as the market situation can change at any time.
The content of this article reflects the author’s opinion and does not necessarily reflect the official position of LiteFinance broker. The material published on this page is provided for informational purposes only and should not be considered as the provision of investment advice for the purposes of Directive 2014/65/EU.
According to copyright law, this article is considered intellectual property, which includes a prohibition on copying and distributing it without consent.
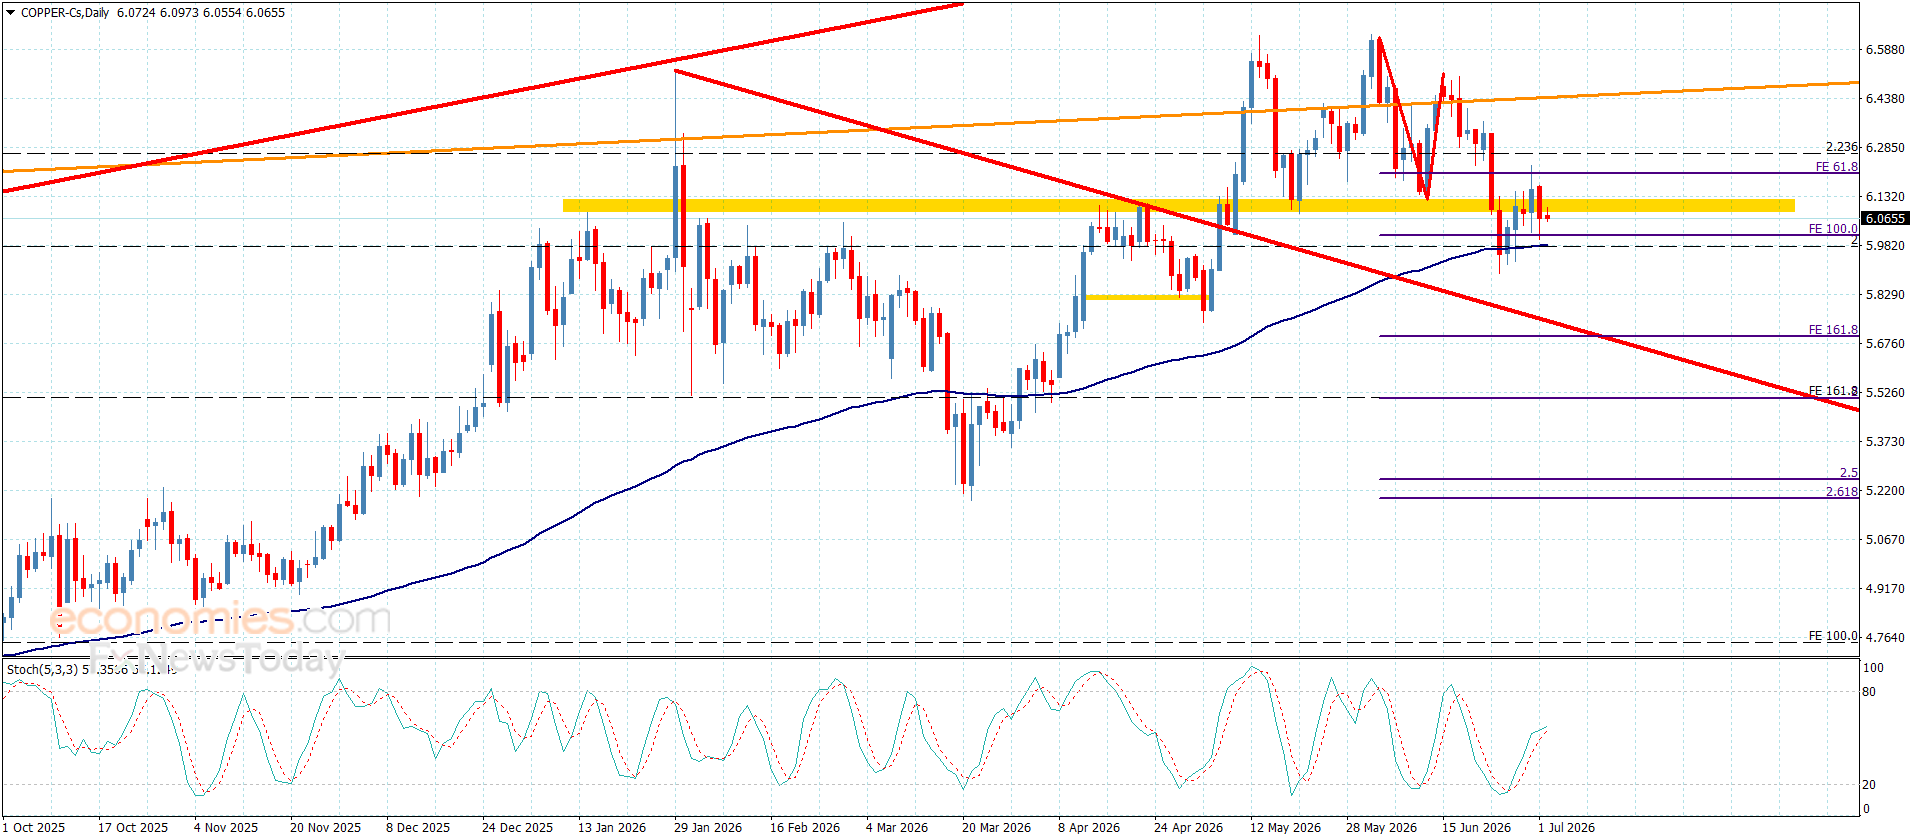
Copper price settles above the moving average 55 near $5.9500, to announce delaying the bearish corrective attempts, noticing its rally to settle near $6.1500 level, surrendering to the sideways track, which is represented by the current support and $6.3000 level that represents an extra barrier against the current trading.
The price might form sideways trading until surpassing one of the mentioned levels, note that reaching below the extra support and holding below it will open the way for activating the bearish corrective track, to expect targeting $5.8200 and $5.7100 level.
The expected trading range for today is between $5.9500 and $6.3000
Trend forecast: Sideways
Silver price (XAG/USD) jumps to the weekly high near $62.15 during the early European trading hours on Friday. The precious metal extends the rally as a weaker-than-expected US Nonfarm Payrolls (NFP) report has reduced expectations of Federal Reserve (Fed) interest rate hikes this year.
According to the CME FedWatch tool, traders are now pricing in nearly a 52% chance of a US rate hike by September, down from 66% before the jobs data.
Traders will closely monitor the developments surrounding peace in the Middle East between the US and Iran. Renewed tensions between Wahington and Tehran could raise inflation worries, weighing the white metal.
Iran’s joint military command warned on Thursday that any US interference in the Strait of Hormuz will be met with a “decisive and swift response” as tensions continue to roil negotiations. Meanwhile, US President Donald Trump said that “I think they have accepted nearly everything we require.”
In the daily chart, XAG/USD holds in a bearish near-term stance as price sits below the Bollinger middle band and well under the 100-day moving average (MA). The metal hovers in the lower half of its Bollinger envelope, while the Relative Strength Index (RSI) at about 42 points to subdued bullish momentum and reinforces the view that recent bounces remain corrective within a broader downside phase.
On the topside, initial resistance emerges at the Bollinger middle band near $63.50, with further barriers at the $70.00 psychologocal level. The next hurdle to watch is the upper Bollinger band around $71.80 and the 100-day MA clustered higher toward $75.00.
On the other hand, the first downside target is seen at the $60.00 round mark. The next notable cushion aligns with the lower Bollinger band near $55.25, where failure would open the door to a deeper extension of the current decline.
(The technical analysis of this story was written with the help of an AI tool.)
Silver is a precious metal highly traded among investors. It has been historically used as a store of value and a medium of exchange. Although less popular than Gold, traders may turn to Silver to diversify their investment portfolio, for its intrinsic value or as a potential hedge during high-inflation periods. Investors can buy physical Silver, in coins or in bars, or trade it through vehicles such as Exchange Traded Funds, which track its price on international markets.
Silver prices can move due to a wide range of factors. Geopolitical instability or fears of a deep recession can make Silver price escalate due to its safe-haven status, although to a lesser extent than Gold’s. As a yieldless asset, Silver tends to rise with lower interest rates. Its moves also depend on how the US Dollar (USD) behaves as the asset is priced in dollars (XAG/USD). A strong Dollar tends to keep the price of Silver at bay, whereas a weaker Dollar is likely to propel prices up. Other factors such as investment demand, mining supply – Silver is much more abundant than Gold – and recycling rates can also affect prices.
Silver is widely used in industry, particularly in sectors such as electronics or solar energy, as it has one of the highest electric conductivity of all metals – more than Copper and Gold. A surge in demand can increase prices, while a decline tends to lower them. Dynamics in the US, Chinese and Indian economies can also contribute to price swings: for the US and particularly China, their big industrial sectors use Silver in various processes; in India, consumers’ demand for the precious metal for jewellery also plays a key role in setting prices.
Silver prices tend to follow Gold’s moves. When Gold prices rise, Silver typically follows suit, as their status as safe-haven assets is similar. The Gold/Silver ratio, which shows the number of ounces of Silver needed to equal the value of one ounce of Gold, may help to determine the relative valuation between both metals. Some investors may consider a high ratio as an indicator that Silver is undervalued, or Gold is overvalued. On the contrary, a low ratio might suggest that Gold is undervalued relative to Silver.
The EURJPY pair surrendered to the negative factors in yesterday’s trading, which are represented by the continuation of forming a strong barrier at 185.80 level besides providing negative momentum by stochastic, which forces it to form new bearish waves, to settle below the support level at 184.20.
Note that the attempt of forming extra barrier at 184.85 level will increase the chances of forming new bearish waves, to expect reaching 183.50 followed by the next support at 183.00, while surpassing the current barrier will provide a chances for recovering the previously achieved losses by its rally towards 185.40 and 185.80.
The expected trading range for today is between 183.50 and 184.60
Trend forecast: Bearish
11
Brent Crude Oil Price Today (July 1): Brent crude and US West Texas Intermediate (WTI) oil prices traded higher in early Wednesday, July 1, after Iran ruled out direct negotiations with US officials, reviving concerns over the fragile Middle East ceasefire. Although crude prices posted modest gains, the broader market remains under pressure following one of the steepest quarterly declines in years as easing geopolitical tensions and improved supply outlook weighed on sentiment.
Brent crude futures rose 50 cents, or 0.69%, to $73.45 per barrel during early Wednesday trading. The benchmark crude oil contract gained after Iran confirmed it would not participate in direct talks with US officials, adding uncertainty to the ceasefire that has temporarily paused the four-month-long conflict between the two countries.
US West Texas Intermediate (WTI) crude futures climbed 63 cents, or 0.91%, to $70.13 per barrel. The gains reflected renewed geopolitical concerns, although analysts say improving global supply conditions continue to limit any sharp rally in oil prices.
Crude oil prices moved higher after Iran announced that it would not hold direct discussions with the United States. According to the White House, US special envoy Steve Witkoff and Jared Kushner, son-in-law of President Donald Trump, travelled to Doha for high-level diplomatic meetings.
However, Iranian and Qatari officials clarified that the American delegation would meet with mediators rather than Iranian representatives directly. Qatar also confirmed that Prime Minister Sheikh Mohammed bin Abdulrahman Al Thani participated in discussions with the US officials.
The lack of direct negotiations has renewed concerns about the durability of the ceasefire and raised fresh uncertainty over stability in the Middle East, a key oil-producing region.
Even with Wednesday’s rebound, oil prices remain significantly below recent highs after recording sharp losses during the previous quarter. Brent crude reportedly fell by nearly $45 per barrel between the first and second quarters of 2026, marking its largest quarterly decline since the 2008 global financial crisis. Meanwhile, WTI crude dropped approximately $31 per barrel, representing its steepest quarterly fall since 2020, when the COVID-19 pandemic severely reduced global fuel demand.
The decline followed easing geopolitical tensions, which removed much of the risk premium that had supported crude prices during the Iran-related conflict.
A Reuters survey published on Tuesday showed that analysts reduced their 2026 oil price forecasts for the first time since the Iran conflict began. The downward revision ended five consecutive months of higher forecasts as improving supply expectations outweighed geopolitical risks.
Analysts also noted that the reopening of the Strait of Hormuz has eased fears of prolonged disruptions to global crude exports, helping stabilise supply expectations.
US Vice President JD Vance said Washington would not allow Iran to impose transit fees on ships passing through the Strait of Hormuz. He stressed that the United States would not accept a scenario in which Iran began “collecting tolls” from vessels using one of the world’s most strategically important oil shipping routes. The comments reinforced expectations that global oil supply routes will remain open despite ongoing regional tensions.
Disclaimer: Oil prices are highly volatile and may change rapidly due to geopolitical developments, supply-demand dynamics, central bank policies, and global economic conditions. Prices mentioned are based on early trading data available on July 1, 2026.
Silver price (XAG/USD) trades 0.9% higher to near $59.65 during the European trading session on Thursday. The white metal gains as the US Dollar (USD) slumps ahead of the United States (US) Nonfarm Payrolls (NFP) data for June, which will be published at 12:30 GMT.
As of writing, the US Dollar Index (DXY), which tracks the Greenback’s value against six major currencies, is down 0.4% to near 101.00.
The table below shows the percentage change of US Dollar (USD) against listed major currencies today. US Dollar was the weakest against the Japanese Yen.
| USD | EUR | GBP | JPY | CAD | AUD | NZD | CHF | |
|---|---|---|---|---|---|---|---|---|
| USD | -0.34% | -0.54% | -0.85% | -0.20% | -0.17% | -0.32% | -0.54% | |
| EUR | 0.34% | -0.20% | -0.52% | 0.12% | 0.18% | 0.04% | -0.20% | |
| GBP | 0.54% | 0.20% | -0.30% | 0.30% | 0.38% | 0.24% | 0.00% | |
| JPY | 0.85% | 0.52% | 0.30% | 0.62% | 0.68% | 0.50% | 0.30% | |
| CAD | 0.20% | -0.12% | -0.30% | -0.62% | 0.04% | -0.09% | -0.33% | |
| AUD | 0.17% | -0.18% | -0.38% | -0.68% | -0.04% | -0.13% | -0.37% | |
| NZD | 0.32% | -0.04% | -0.24% | -0.50% | 0.09% | 0.13% | -0.24% | |
| CHF | 0.54% | 0.20% | -0.00% | -0.30% | 0.33% | 0.37% | 0.24% |
The heat map shows percentage changes of major currencies against each other. The base currency is picked from the left column, while the quote currency is picked from the top row. For example, if you pick the US Dollar from the left column and move along the horizontal line to the Japanese Yen, the percentage change displayed in the box will represent USD (base)/JPY (quote).
Technically, a lower US Dollar makes the Silver price an attractive bet for investors.
Investors will pay close attention to the US NFP data to get fresh cues regarding the Federal Reserve’s (Fed) monetary policy outlook. The NFP report will likely show that employers hired 110K fresh workers, lower than 172K in May. The Unemployment Rate is expected to remain steady at 4.3%.
Currently, the CME FedWatch tool shows that traders see an almost 85% chance that the Fed will deliver at least one interest rate hike this year.
On Wednesday, the US ADP Employment Change and the ISM Manufacturing PMI data for June missed expectations. The ADP report showed that the private sector created 98K fresh jobs, lower than the estimates of 113K. The Manufacturing PMI arrived lower at 53.3, while it was expected to remain steady at 54.0.
XAG/USD trades higher at around $59.65 in the European trade. However, the index is keeping a bearish near-term tone as price holds below the 20-day Exponential Moving Average (EMA), which is at $63.74. The metal remains pressured by this overhead dynamic barrier, while the Relative Strength Index (RSI) at 36.24 stays just above oversold territory, hinting at lingering downside bias rather than a decisive recovery.
On the topside, initial resistance is located at the 20-day EMA around $63.74, which needs to be reclaimed to ease the current bearish pressure and open the way for a more sustainable rebound. On the downside, the June 24 low at $55.63 is the immediate support; a downside move below that would expose the pair to the psychologcial level of $50.00
(The technical analysis of this story was written with the help of an AI tool.)
The Nonfarm Payrolls release presents the number of new jobs created in the US during the previous month in all non-agricultural businesses; it is released by the US Bureau of Labor Statistics (BLS). The monthly changes in payrolls can be extremely volatile. The number is also subject to strong reviews, which can also trigger volatility in the Forex board. Generally speaking, a high reading is seen as bullish for the US Dollar (USD), while a low reading is seen as bearish, although previous months’ reviews and the Unemployment Rate are as relevant as the headline figure. The market’s reaction, therefore, depends on how the market assesses all the data contained in the BLS report as a whole.
Coffee (KC) is trading at $308.62, down 1.89% on the day, with the price currently positioned above its short- and medium-term moving averages but remaining just below its longer-term trend levels.
Real-time Data
18:35
313.04

On the technical front, KC is trading above both the 20-period and 50-period moving averages on the working timeframe, but remains just under the 200-period moving average. The key Ichimoku Kijun support on the daily chart is at $304.96. The Moving Average Convergence Divergence (MACD) and the Average Directional Index (ADX) both register a Buy signal, while the Relative Strength Index (RSI) also indicates buying momentum. In contrast, the Stochastic RSI is oversold, Commodity Channel Index (CCI) sits at Neutral, and Bull/Bear Power shows intraday overbought conditions, highlighting buyer dominance. The Awesome Oscillator is neutral. This mix points to a divergence between strong short-term momentum and mixed oscillator readings.
Looking ahead to the next 2–3 trading days, the expected price range is $298.05 to $319.19, with a 70% probability of an upward move. The baseline scenario anticipates continued trading within this range. If KC decisively breaks above resistance, a move toward higher levels may follow; if price falls below the daily Ichimoku Kijun at $304.96, this would activate a bearish scenario.
Earlier, analysts noted that coffee futures were underpinned by sustained short-term bullish momentum, supported by favorable policy shifts and technical strength. The current setup reinforces this positive bias, but traders should be mindful of potential volatility around the $304.96 daily Ichimoku Kijun support, as a break below this level could shift momentum to the downside.
Copper price remains stable until this moment above the moving average 55, which keeps forming extra support level at $5.9500, obstructing the chances of resuming the previously waited corrective decline.
Reminding you that the negative stability below $6.3000 barrier supports the dominance of the bearish corrective track, to keep waiting for gathering the required extra negative momentum to break the current obstacle, to reach negative stations that might begin at $5.8200 and $5.7100.
The expected trading range for today is between $5.820 and $6.1500
Trend forecast: Bearish
TradingKey – As of the European session on July 2, WTI ( USOIL) crude oil prices fluctuated with a weak bias around $68, extending their prior downward trend. From a technical perspective, against the backdrop of easing US-Iran tensions, WTI crude oil prices have continued to decline, briefly breaking below the $68 threshold today to touch a low of $67.45, marking a new low since March this year.
From a fundamental perspective, the most critical factor influencing recent WTI crude oil price movements is the negotiations between the US and Iran regarding the Strait of Hormuz and the ceasefire mechanism. Previously, the US-Iran conflict had heightened market concerns over disruptions to Gulf shipping, adding a geopolitical risk premium to oil prices. However, as the two sides resumed technical contacts in Doha, Qatar, market fears of supply disruptions have cooled significantly.
Trump recently stated that the US and Iran are ‘getting along very well’ and noted that the recent meetings in Qatar went smoothly. He also indicated that Iran’s denuclearization process is ‘progressing well’ and that the two sides held ‘very good meetings.’
For WTI, Trump’s remarks directly eroded the risk premium. Previously, the primary logic supporting oil prices was that if the US-Iran conflict escalated again or if Iran restricted transit through the Strait of Hormuz, the global crude supply chain could be disrupted. However, as Trump and Qatari officials reported positive progress in indirect US-Iran talks—focusing on Strait shipping, ceasefire implementation, and partially frozen funds—market expectations of short-term crude supply disruptions are cooling down.
However, Iran’s stance remains firm. Iranian officials insist that Tehran should retain control over transit arrangements in the Strait of Hormuz, including deciding how vessels enter and exit the strait, as well as potentially charging fees on related vessels in the future. Tehran also emphasized that it is unwilling to shift the focus of negotiations to other disputes before the issue of control over the Strait of Hormuz is resolved.
The diverging statements from the US and Iran have created a situation where short-term easing and medium-term uncertainty coexist for oil prices. In the short term, Trump’s optimistic remarks and the progress in Qatari negotiations have weighed on the oil risk premium; in the medium term, however, Iran’s insistence on controlling the Strait could still lead to setbacks in subsequent talks. Should the two sides clash again over navigation rights, fee collection, or military escorts, WTI crude could quickly rebound.
WTI Crude Oil Daily Chart, Source: TradingView
Looking at the daily chart of WTI crude oil, the overall trend has shifted downward following a confirmed break below $80 on June 16. Meanwhile, the moving average system shows that the SMA 5, 10, and 20 have all crossed below the SMA 144, forming a death cross structure that further reinforces bearish momentum.
Currently, WTI crude oil has broken below the $70 mark as well as the 0.786 Fibonacci retracement level at $69.40. This further opens up downside potential, with prices poised to test the $60 support level, and potentially even fall toward the $56 area.
In terms of trading strategy, shorting on rallies is recommended.
This content was translated using AI and reviewed for clarity. It is for informational purposes only.
Private payrolls came in at 98,000 for June against expectations of 110,000 to 118,000. May printed 122,000. That is a clean miss and gold moved on it immediately. September hike odds are already running around 64%, and a soft official number later today pulls those odds down. Gold has room to extend off the seven-month low in that scenario.
Every dip this week got bought fast. Traders are not comfortable staying short heading into a payrolls print that the ADP already softened up. That kind of buying pressure into weakness tells you where positioning stands before the number drops.
The U.S. and Iran wrapped up another round of indirect talks on the Strait of Hormuz. Nothing concrete came out of it, but crude dropped on the fact that they were still at the table. Gold traders already know what falling oil does to the rate outlook. Less inflation pressure takes urgency off the Fed, and that is the only story gold is trading right now.
Oil pulling back alongside a weak jobs preview is the combination that points away from a September hike. That is all gold needs to hold above the seven-month low.
Fed Chair Kevin Warsh said inflation expectations and risks have come down in recent weeks but repeated the Fed is still committed to 2% and prices are still too high. That is Warsh staying in the middle. No signal on the next move, no hint at timing.
Markets are pricing over 70% odds that rates hold at the July meeting. September is the live meeting with hike odds at 60% to 64%, and that is the number today’s report can move the most. Warsh not tipping his hand means the payrolls data at 12:30 GMT is making the decision for him.