Coffee prices today in the domestic market turned down sharply after the previous increase session. Coffee prices on July 30th averaged 96,600 VND/kg, down 1,800 VND/kg compared to the previous day. The highest level in key regions of the Central Highlands was recorded at 96,800 VND/kg.
In Lam Dong, coffee prices today reached 96,000 VND/kg, down 1,800 VND/kg compared to the previous day. This is the lowest level among regions with detailed updated tables.
In Gia Lai, coffee prices were recorded at 96,500 VND/kg, down 1,800 VND/kg compared to the previous session.
The old Dak Nong area recorded a level of 96,800 VND/kg, down 1,700 VND/kg. This is the highest level among the regions updated in detail.
In Dak Lak, coffee prices also decreased according to the general trend of the market.
World coffee prices
In the world market, coffee prices fell sharply on both the London and New York exchanges.
On the London exchange, the September 2026 Robusta futures fell 104 USD/ton, equivalent to 2.68%, to 3.773 USD/ton. The November 2026 futures fell 110 USD/ton, equivalent to 2.85%, to 3.749 USD/ton.
Further terms also decreased. Robusta in January 2027 lost 108 USD/ton, down to 3.716 USD/ton; March 2027 term decreased by 108 USD/ton, to 3,686 USD/ton.
On the New York exchange, the September 2026 Arabica futures fell 13.60 US cents/lb, equivalent to 4.01%, to 325.80 US cents/lb. The December 2026 futures fell 8.75 US cents/lb, to 308.55 US cents/lb.
Coffee price assessment
Domestic coffee prices fell sharply in the context of the global market adjusting. For Vietnam, Robusta London is still a variable that needs to be closely monitored due to its direct impact on domestic purchasing prices.
Today’s decrease also shows that the general level of coffee prices is still fluctuating very quickly. Just after one day of strong increase to the area of 98. 400 VND/kg, the average price has retreated to 96. 600 VND/kg.
From a supply-demand perspective, USDA/FAS forecasts Vietnam’s coffee production in the 2026-2027 crop year to reach 32.5 million bags converted to green beans. For Brazil, USDA/FAS forecasts coffee production in the 2026-2027 crop year to reach 71.9 million bags, an increase of 14% compared to the previous crop year.
Regarding the weather, the Central Highlands is in the rainy season. According to the National Center for Hydro-Meteorological Forecasting, on July 30, day and night, the Central Highlands area will have showers and thunderstorms in some places; especially in the afternoon and night, there will be rain, moderate rain and scattered thunderstorms, locally heavy to very heavy rain. In thunderstorms, there is a possibility of tornadoes, lightning, hail and strong gusts of wind.
Heavy rain needs to be monitored in the stages of garden care, pest and disease prevention, and goods preservation.
In the coming sessions, developments on the London exchange, New York exchange, USD/VND exchange rate, inventory and demand for export purchases will continue to dominate domestic prices.
The GBPJPY pair ended the temporary negative rebound by reaching 217.15 level, to begin activating with the positivity of the main indicators by its rally above 217.55 level to rally sharply towards 218.55 approaching the initial barrier that we expected in our previous report.
The attempt of the main indicators to provide extra positive momentum will reinforce the chances pf breaching the barrier at 218.65, to open the way for targeting extra positive stations that might begin at 219.40 and 220.00, while the risk of changing the main trend is represented by breaking 216.35 level and holding below it.
The expected trading range for today is between 217.80 and 219.40
Despite the continuation of forming weak sideways trading by Platinum price in the last period, its negative stability below the extra barrier at $1695.00 confirms its surrender to the suggested negative scenario, to settle near $1595.00.
Stochastic attempt to provide negative momentum by its stability below 50 level makes us prefer reaching $1550.00, where breaking it will open the way for reaching extra negative stations near $1515.00 and $1475.00.
The expected trading range for today is between $1515.00 and $1640.00
Coffee prices today in the domestic market increased sharply compared to the previous day. Coffee prices on July 29th averaged 98,400 VND/kg, up 1,900 VND/kg. The highest level in key Central Highlands regions was recorded at 98,500 VND/kg.
In Lam Dong, coffee prices reached 97,880 VND/kg, an increase of 2,000 VND/kg compared to the previous day. This is the lowest level among regions updated in detail.
In Gia Lai, coffee prices were recorded at 98,300 VND/kg, an increase of 1,900 VND/kg.
The old Dak Nong area recorded a level of 98,500 VND/kg, an increase of 1,900 VND/kg.
After two consecutive increasing sessions, the domestic coffee price level has returned to the area close to 100,000 VND/kg.
World coffee prices
In the world market, coffee prices increased sharply on both the London and New York exchanges.
On the London exchange, the September 2026 Robusta futures contract increased by 78 USD/ton, equivalent to 2.05%, to 3,877 USD/ton. The November 2026 term increased by 78 USD/ton, to 3,859 USD/ton. The January and March 2027 terms increased by 79 USD/ton and 80 USD/ton respectively, reaching 3,824 USD/ton and 3,794 USD/ton.
On the New York exchange, the September 2026 Arabica futures contract increased by 14.85 US cents/lb, equivalent to 4.58%, to 339.40 US cents/lb. The December 2026 term increased by 11.40 US cents/lb, to 317.30 US cents/lb. Further forwards also increased sharply.
The upward momentum of world prices is creating clearer support for domestic coffee prices, especially when Robusta London returns to the area near 3,900 USD/ton.
Coffee price assessment
Domestic coffee prices increased sharply in the session of July 29, coinciding with positive developments on the two international exchanges. The increase range of Arabica is greater than Robusta, but Robusta is still a more direct factor affecting the Vietnamese market.
From a global market perspective, the International Coffee Organization said that the average ICO aggregate price index in June 2026 reached 248.90 US cents/lb, down 2.8% compared to May. However, in June, prices once fell to the lowest level in nearly 2 years and then recovered 17.4% at the end of the month, showing that the market still has a large fluctuation range.
Regarding supply, USDA/FAS forecasts that Vietnam’s coffee production in the 2026-2027 crop year will reach 32.5 million bags converted to green beans. The prospect of increased supply is still a factor to be monitored in the medium term, although short-term prices are being supported by the upward momentum on the world exchange.
Regarding the weather, according to the National Center for Hydro-Meteorological Forecasting, from early morning on July 29 to July 30, the Central Highlands and Southern regions will have moderate rain, heavy rain and thunderstorms, locally very heavy rain. Especially the Central Highlands will have moderate rain, heavy rain and scattered thunderstorms; in thunderstorms, there is a possibility of tornadoes, lightning and strong gusts of wind.
Heavy rain needs to be monitored in the stages of garden care, pest and disease prevention, and goods preservation.
The EURUSD pair declined in its last intraday trading, reaching EMA50’s resistance, putting it under negative pressure amid the dominance of the main bearish trend on the short-term basis, with its trading alongside supportive trend for this path, besides the emergence of the negative signals from the relative strength indicators, after reaching exaggerated overbought levels compared to the price move, intensifying the negative pressure, indicating more downside moves in the near upcoming period.
The GBPJPY pair’s neediness to the bullish momentum led it to form more bearish corrective waves, to notice its stability near the moving average 55 at 217.35, note that this rebound will not affect the main bullish scenario, which depends on the stability of the support level at 216.35, the stability above it confirms the continuation of the positivity, which might target the barrier at 218.65 and surpassing it will extend the trading towards 219.40 and 220.00.
While breaking the support and holding below it for four hours’ time frame will cancel the bullish trend, to force the price to form strong bearish waves, forcing it to suffer several losses by reaching 215.45 initially.
The expected trading range for today is between 216.85 and 218.65
Platinum price provided more sideways trading by its fluctuation near $1600.00 level due to the contradiction of the main indicators, especially by stochastic stability above 20 level, obstructing the previously waited negative trend.
Reminding you that the stability below the extra barrier at $1695.00 forms a main factor to confirm the previously suggested negative scenario, therefore, we will keep waiting for gathering extra negative momentum, to reach the initial target at $1550.00, then attempts to pressure the barrier near $1515.00.
The expected trading range for today is between $1515.00 and $1640.00
Gold prices deepened its losses during their latest intraday trading, breaking a bullish corrective trend line on the short-term basis, accompanied by surpassing EMA50’s support, intensifying the negative pressures and suggesting more losses in the near upcoming period, especially with the emergence of the negative signals from the relative strength indicators, despite reaching oversold levels.
Register now to be able to add articles to your reading list.
” aria-hidden=”true”>
Silver prices fell towards $57.20 per ounce on Tuesday as a stronger US dollar and growing expectations of tighter Federal Reserve policy outweighed support from another year of structural supply deficits. With the Fed set to announce its latest policy decision on Wednesday, traders are watching whether XAG/USD can hold the key $56.81 Fibonacci support before the next directional move.
Stronger Dollar and Fed Expectations Pressure Silver
Silver came under renewed selling pressure as investors reduced exposure ahead of the Federal Reserve’s two-day policy meeting. Spot silver traded near $57.23 per ounce, down around 2% on the day, extending its retreat after briefly approaching the $60 mark last week. The stronger US dollar remained the primary headwind, making dollar-denominated precious metals more expensive for overseas buyers.
Markets are increasingly focused on the Fed’s policy guidance rather than the rate decision itself. According to CME FedWatch, investors assign a 62% probability that policymakers will leave interest rates unchanged this week, while the likelihood of a 25-basis-point increase has climbed to 38%, up sharply from around 16% a week ago. Markets are also pricing roughly an 81% chance of a September rate increase, reflecting expectations that inflation risks remain elevated.
Source: CME FedWatch
Higher interest rates generally reduce the appeal of non-yielding assets such as silver by increasing returns on cash and government bonds. A hawkish statement from the Fed could therefore keep pressure on both silver and gold, even if rates remain unchanged this week.
Industrial Demand and Supply Deficits Continue to Support the Long-Term Outlook
Unlike gold, silver derives much of its value from industrial demand, particularly in electronics, renewable energy, electric vehicles and advanced manufacturing. While concerns over slower global growth have weighed on industrial metals in recent weeks, the long-term supply picture remains supportive.
The Silver Institute expects the global silver market to record its sixth consecutive annual supply deficit in 2026. Its latest estimates indicate the market could remain undersupplied by approximately 46.3 million ounces, even after modest improvements in mine production and recycling. Earlier projections had suggested a deficit closer to 67 million ounces, highlighting that global consumption continues to exceed newly available supply.
Physical investment demand also remains resilient. The Silver Institute forecasts demand for silver coins and bars to increase by roughly 20% to around 227 million ounces this year, the strongest level in three years. Although industrial fabrication is expected to soften slightly, silver continues to benefit from growing demand across electrical infrastructure, electronics and clean energy technologies.
Another supportive factor comes from India, where tighter import restrictions and higher import duties have significantly reduced silver imports, creating regional shortages and lifting domestic premiums above international benchmark prices.
Economic Data Could Drive the Next Move
Following Wednesday’s Fed decision, attention will quickly shift to Thursday’s US GDP, personal income, spending and Core PCE inflation reports. The Core PCE index remains the Federal Reserve’s preferred inflation gauge, and any upside surprise could reinforce expectations for another rate increase in September.
Conversely, softer economic growth or easing inflation would weaken the US dollar and improve the outlook for precious metals, particularly silver, which tends to react more sharply than gold to changes in monetary policy expectations.
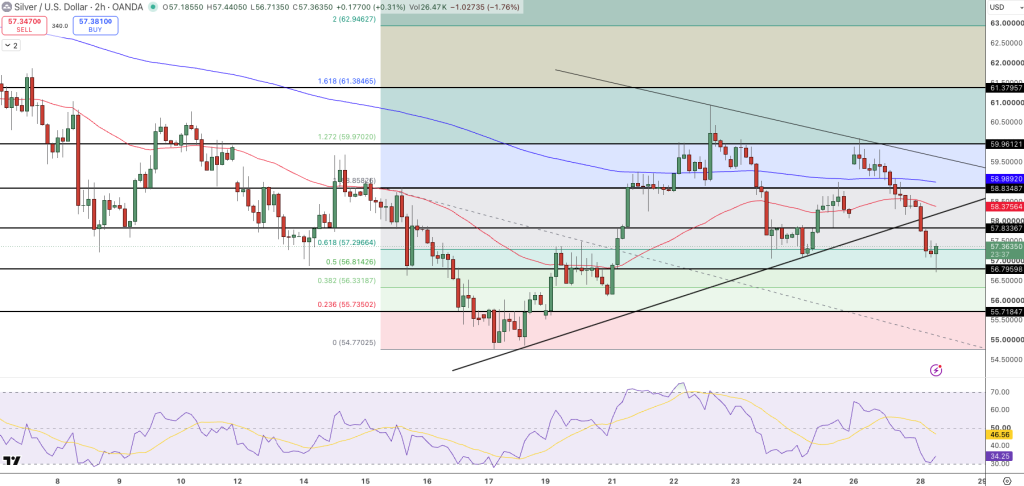
Silver Price Forecast: Can XAG/USD Hold the $56.81 Fibonacci Support?
Silver’s technical picture has weakened after breaking below the ascending trendline that supported the rally from the July 17 low. The decline has brought prices towards the 50% Fibonacci retracement at $56.81, where buyers have begun to emerge. However, the recovery remains tentative as XAG/USD continues to trade below both the former trendline and its key moving averages.
Silver Price Chart – Source: Tradingview
The 50-period EMA at $58.38 has turned lower and now acts as immediate resistance, while the 200-period EMA at $58.99 remains firmly above price, confirming that sellers retain short-term control. Meanwhile, the RSI has fallen to around 34, approaching oversold territory but not yet signalling a confirmed bullish reversal.
A sustained recovery above $58.34 would improve the near-term outlook and expose the 200-period EMA at $58.99, followed by the descending trendline near $59.96. If buyers regain control above these levels, the next upside objective comes in at $61.38.
On the downside, $56.81 remains the first key support. A decisive break below this Fibonacci level would expose $56.33, followed by $55.72, while a deeper correction could extend towards $54.77.
Bearish scenario: A confirmed break below $56.81 could accelerate losses towards $56.33, followed by $55.72 and $54.77.
FAQs
Why is silver falling today?
Silver is under pressure because the US dollar has strengthened ahead of the Federal Reserve’s policy decision, reducing demand for non-yielding precious metals and increasing the cost of silver for international buyers.
Why does industrial demand matter for silver?
Unlike gold, more than half of global silver consumption comes from industrial applications, including electronics, solar panels, electric vehicles and electrical infrastructure. Economic growth expectations therefore have a greater influence on silver prices.
Can the long-term supply deficit support silver prices?
Yes. The Silver Institute expects another annual supply deficit in 2026, with global demand continuing to exceed mine production and recycling. Persistent shortages could provide longer-term support once monetary policy uncertainty begins to ease.
Arslan Ali Butt
Lead Markets Analyst – Multi-Asset (FX, Commodities, Crypto)
Arslan Ali Butt serves as the Lead Commodities and Indices Analyst, bringing a wealth of expertise to the field. With an MBA in Behavioral Finance and active progress towards a Ph.D., Arslan possesses a deep understanding of market dynamics.
His professional journey includes a significant role as a senior analyst at a leading brokerage firm, complementing his extensive experience as a market analyst and day trader. Adept in educating others, Arslan has a commendable track record as an instructor and public speaker.
His incisive analyses, particularly within the realms of cryptocurrency and forex markets, are showcased across esteemed financial publications such as ForexCrunch, InsideBitcoins, and EconomyWatch, solidifying his reputation in the financial community.


