Amid the severe volatility in global financial markets, gold continues to shine as a safe haven, setting a series of new record highs, having surpassed the $2,800 per ounce barrier for the first time in history
As global concerns about trade tensions escalate—especially after the United States imposed tariffs on Canada, Mexico, and China, with the European Union on the way—investors are turning to the precious metal as a hedge against inflation and economic uncertainty
The massive surge in gold prices since the beginning of this year reflects the bullish market movement dominating the precious metal since March 2024, driven by several key factors that lead investors to view gold as a safe haven
One of the main reasons for this market is the global monetary easing cycle we have witnessed recently, as many central banks have significantly lowered interest rates to stimulate their local economies
These easing measures, which boost the global economy, make gold—an asset that does not yield fixed returns—more attractive to investors looking to protect their capital
Furthermore, escalating global geopolitical tensions contribute to increased demand for gold, as investors worry about political and economic uncertainty on a worldwide scale
Consequently, speculations are growing about the possibility of prices reaching the $3,000 per ounce mark in the near term, as instability continues and investors flock to safe-haven assets
Will this upward market continue? And what factors might push gold to unprecedented levels? In this report, we review the key drivers affecting gold prices and future forecasts for the precious metal in light of current economic and trade developments
Trump’s Trade Policy
After returning to the White House, President Donald Trump began implementing his protectionist trade policies, as promised during his campaign, aiming to reduce the trade deficit and boost domestic manufacturing
One of his most prominent campaign promises was to impose new tariffs of up to 60% on Chinese imports, in an attempt to force Beijing into making trade concessions and protect American industries
He also threatens to impose a 10% global tariff on all imported goods, under the pretext of bolstering domestic production and reducing reliance on foreign sources
In addition, Trump intends to renegotiate several trade agreements that he deems insufficiently beneficial to the United States, and he may use economic pressure on allies to secure more favorable terms
It is also expected that the new American administration will continue targeting companies that relocate their production abroad with new taxes and sanctions
However, these policies may lead to an escalation of trade tensions with major countries such as China and the European Union, which could spark fears of rising prices and inflation within the United States
Overall, Trump’s second administration has reshaped American trade policy with a more aggressive approach, one that will boost domestic manufacturing but may have significant repercussions on the global economy
US Tariffs on Canada and Mexico
As promised by President Donald Trump last month, the United States imposed a 25% tariff on Canada and Mexico starting Tuesday, February 4
White House officials stated that there would be no exceptions to these tariffs
During his campaign, Donald Trump vowed to impose comprehensive tariffs abroad as part of an expansive plan to reshape the American economy and its relationships with other countries
However, during the first two weeks of his term, his threats sparked uncertainty as some leaders believed his threats were merely a negotiating tactic
These rapidly escalating trade conflicts represent the most aggressive protectionist move by an American president in nearly a century, leading to widespread selling in global financial markets amid potential repercussions on inflation rates, geopolitical dynamics, and global economic growth
At the last moment, President Donald Trump suspended his threat on Monday, February 3, agreeing to a 30-day grace period in exchange for Canada and Mexico committing to concessions on illegal immigration and drug trafficking
Both Canadian Prime Minister Justin Trudeau and Mexican President Claudia Sheinbaum announced their agreement to enhance border protection efforts in response to Trump’s demands for stringent measures to curb illegal immigration and drug smuggling
US-China Trade Tensions
With the implementation of a 10% tariff on China starting Tuesday, Beijing retaliated by imposing its own tariffs on certain American imports, further intensifying trade tensions between the world’s two largest economies
The Chinese Ministry of Finance announced tariffs of 15% on American coal and liquefied natural gas, 10% on crude oil, and on agricultural equipment, as well as on a limited number of imported trucks and large-engine sedans
The Chinese Ministry of Commerce and Customs Administration also reported imposing export restrictions on certain critical minerals used in electronics, military equipment, and solar panels
Separately, the National Market Regulation Administration stated that China would cooperate with the American tech giant Google over alleged antitrust violations
During his first term in 2018, Trump launched a fierce two-year trade war with China, targeting its massive trade surplus with the United States, which led to global supply chain disruptions and significant damage to the global economy
In an attempt to end the dispute, China agreed in 2020 to increase its annual purchases of American goods by $200 billion, but the implementation of the agreement was hindered by the COVID-19 pandemic, further exacerbating China’s annual trade deficit with the United States
In a new escalation, Trump warned that tariffs could be raised further if China did not take effective measures to stop the flow of fentanyl, stating, “I hope China stops sending fentanyl to us, or tariffs will skyrocket”; while China labeled fentanyl as “an American problem” and promised countermeasures
Analyst Insights on Tariffs
- Manzur Mohieddin, Chief Economist at Capital.com, said that Trump’s early blow is likely to affect investor confidence.
- Mohieddin added that there was a consensus—including among us—that American tariffs would only threaten economic forecasts in the latter half of 2025 after prolonged negotiations.
- John Hardy, Chief Macro Strategist at Saxo, stated that if these tariff moves continue, we are effectively in a trade war with all its associated repercussions on growth, prices, and supply chains.
- Jigar Trivedi, Senior Analyst at Reliance Securities, noted that despite expectations of higher gold due to safe-haven demand, a stronger dollar and expectations of lower interest rates are putting additional downward pressure.
- Matt Simpson, Chief Analyst at Citi Index, suggested that this might be a short-term emotional reaction, and he believes that gold will continue to outperform this year amid inflation threats and upcoming trade wars.
Global Monetary Easing
Major central banks in the United States, Europe, the United Kingdom, Canada, Switzerland, and Mexico continue their cycle of monetary easing and interest rate cuts, resulting in new liquidity injections into the markets.
Market experts say that in the medium term there is clear optimism for stocks, residential real estate, gold, and even cryptocurrencies thanks to the global monetary easing cycle.
Robert Kiyosaki’s Forecasts
Robert Kiyosaki, author of “Rich Dad, Poor Dad,” wrote on platform X that he expects gold to reach $3,300 per ounce following Trump’s victory in the U.S. presidential election.
Kiyosaki explained that Donald Trump wants a weak U.S. dollar to boost exports, create jobs, and open new factories, which will drive gold prices up from $2,800 to $3,300 per ounce before the end of 2025.
$3,000 per Ounce
Citibank Group stated: We expect gold to reach $3,000 per ounce within the next six months.
Gold, which retains its value as a hedge against inflation, tends to perform well during times of economic uncertainty when investors steer away from riskier assets like stocks.
Gold bullion prices hit an all-time high of $2,860.67 per ounce on Wednesday, February 5, 2025.
Spot Gold Prices
By the end of 2024, spot gold prices rose by more than 27%, marking the second consecutive annual gain and the largest annual gain since 2010, driven by the generosity of global central banks and geopolitical tensions.
Gold prices usually have an inverse relationship with interest rates; as rates decline, gold becomes more attractive compared to fixed income assets like bonds.
Types of Demand for Gold
Industrial Demand
- Electronics: Gold is widely used in electronic components such as printed circuits and motherboards in smartphones, computers, and other electronic devices.
- Renewable Energy: Gold is used in renewable technologies such as solar panels and lithium-ion batteries.
- Automotive: Gold is used in car engines to improve performance and efficiency.
- Household Products: Gold is incorporated in household appliances to enhance their functionality and efficiency.
Investment Demand
- Jewelry: Gold is a precious metal used in the production of jewelry and art pieces.
- Coins: Gold is used in minting coins for its value and stability.
- Safe Haven: Gold bars are considered a safe haven for investors during times of economic and geopolitical uncertainty.
- Exchange-Traded Funds (ETFs): ETFs allow investors to buy and sell gold without the need to physically own it.
Global Central Banks
- Global central banks hold gold reserves as part of their foreign exchange reserves.
- Gold reserves provide a form of insurance against currency fluctuations and geopolitical risks.
- Central banks can buy or sell gold depending on their monetary policy goals and economic conditions.
Largest Gold Buyer
China and India typically compete for the title of the world’s largest gold buyer, but this scenario changed last year as Chinese consumption of jewelry, bullion, and coins reached record levels. Demand for gold jewelry in China increased by 10% while demand in India fell by 6%, and Chinese investments in bullion and coins surged by 28%.
Indian Gold Demand
The Indian government reduced import duties on gold and silver to 6% from 15% last year, improving actual demand forecasts and supporting jewelry manufacturing in the world’s second-largest consumer of gold bullion
Top Gold Price Forecasts for 2025
- Citibank Group forecasts gold prices to rise to $3,000 per ounce over the next six months.
- Goldman Sachs Group forecasts gold prices to reach $2,900 per ounce this year, driven by the bullish market.
- JP Morgan Bank forecasts gold to hit $3,100 per ounce by the end of 2025.
- Morgan Stanley forecasts gold to reach $3,200 per ounce by the end of 2025.
Analyst Insights on Gold Prices
- Kyle Roda, Chief Financial Analyst at Capital.com, stated that gold is likely to remain on an upward trajectory in 2025, driven by geopolitical risks and expectations of rising government debt.
- Julia Khandosko, CEO of Mind Money Brokerage, said that global trends will continue to push the gold market forward, with steady and gradual growth.
- HSBC Bank stated that we expect stable prices in 2025, though a possible decline in actual demand and an increase in supply might limit gains.
- Yap Jon Rong, Market Analyst at IG, expects further gold price increases due to uncertainty over trade measures.
- Jonny Tevis, Strategic Expert at UBS, noted that the rise in gold is driven by a decline in real interest rates and positive investor sentiment towards the metal.
- Jigar Bandit, Head of Commodities at BNP Paribas, expects central banks to continue buying gold amid geopolitical uncertainty.
Key Gold Price Milestones
- August 2008: Gold hit a low of $251.90 per ounce.
- February 2025: Gold reached an all-time high of $2,860.67 per ounce.
- February 2025: Gold recorded its highest closing price ever at $2,842.27 per ounce.
Best Historical Performance of Gold Prices
- 2007: Best annual performance with an increase of approximately 31%.
- Q1 2016: Best quarterly performance with an increase of over 16%.
- September 1999: Best monthly performance with an increase of approximately 17%.
Top FAQs About Gold
Is Gold Price Suitable for Investment?
Gold is trading around $2,800 per ounce, and in light of forecasts indicating a bullish market in 2025, we believe that levels between $2,750 and $2,700 are suitable for investment, with a long-term target above $3,000 per ounce
How to Invest in Gold?
Gold can be invested in several ways:
- Buying physical gold such as coins or bars.
- Investing through gold Exchange-Traded Funds (ETFs) listed on global exchanges.
- Purchasing shares in gold mining and refining companies.
- Trading gold futures, options, and other derivative contracts.
Will Gold Reach $3,000 per Ounce?
In light of recent developments in global markets and the economic and trade risks, it is entirely possible for gold prices to rise to $3,000 per ounce this year, with the potential to hit new historic levels if strong industrial and investment demand factors materialize
Is Gold Expected to Rise in 2025?
Yes, most major institutions and banks forecast that the precious metal will continue its upward trajectory this year, setting new record highs
Gold Investment Tips
Analysts and experts advise closely monitoring political and economic developments, and diversifying investment portfolios to include gold as part of a risk-hedging strategy
Technical Analysis of Gold Prices
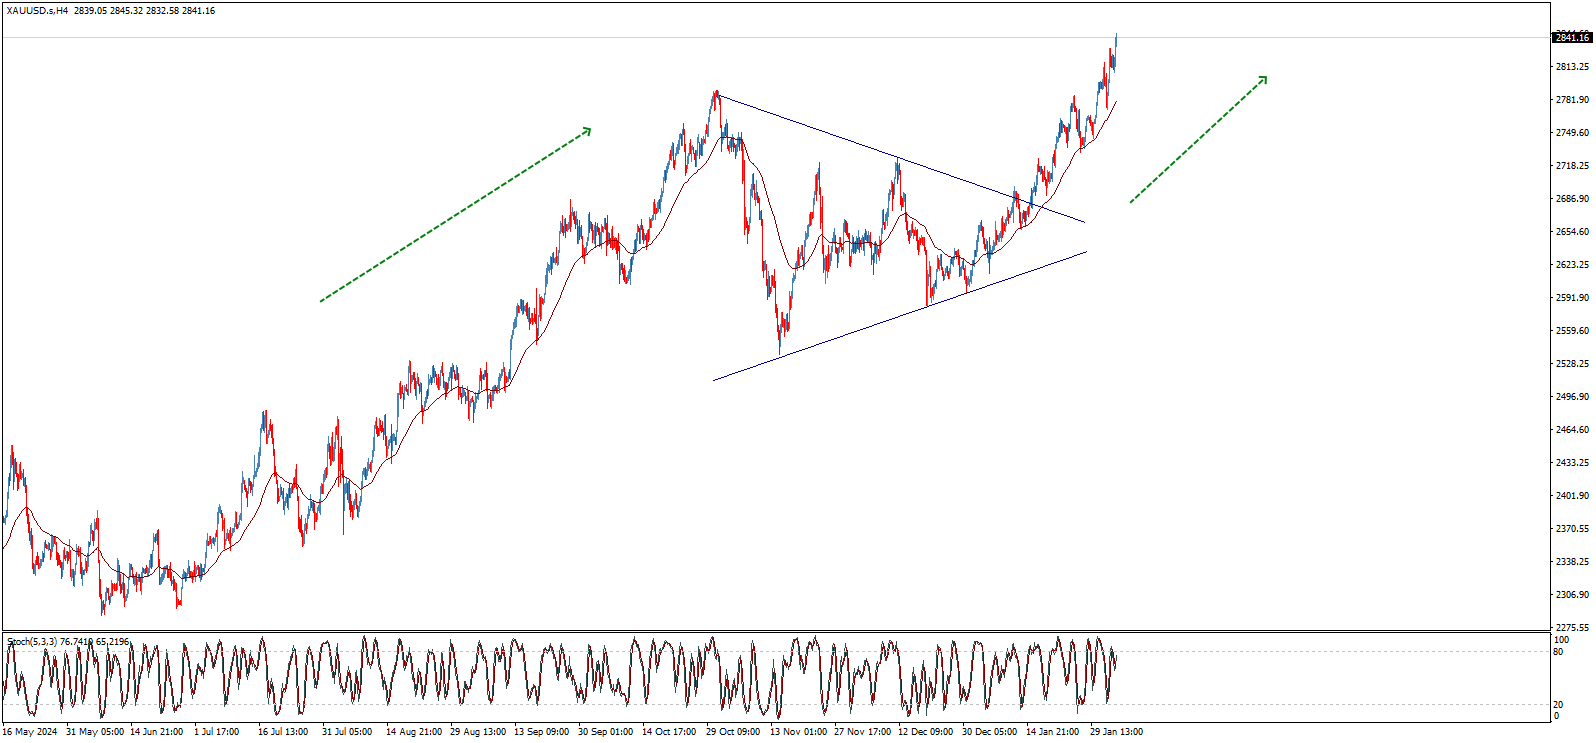
Gold is resuming its long-term upward trend after the recent temporary downward correction experienced in recent weeks. After testing the $2536.00 levels, the price rebounded, setting new historical records up to the time of writing this report.
A range of positive technical factors supports the continuation of the upward trend across various timeframes. On the weekly chart, based on Fibonacci extension levels of the last downward wave, the price appears poised to reach the next key level of $2946.00 and needs to hold above the support level at around $2790.00 to confirm the ongoing bullish trend.
On the daily chart, the price is moving within an ascending channel that has been in place since the beginning of Q4 2023. After bouncing off its support last month, the price resumes its upward movement toward an expected resistance level of $2980.00 in the channel.

Another positive catalyst in recent trading was the breakthrough of a symmetrical triangle pattern, which is considered a key to resuming the main upward trend and achieving the proposed targets, along with the positive support provided by the 50-day moving average for short- to medium-term trading.
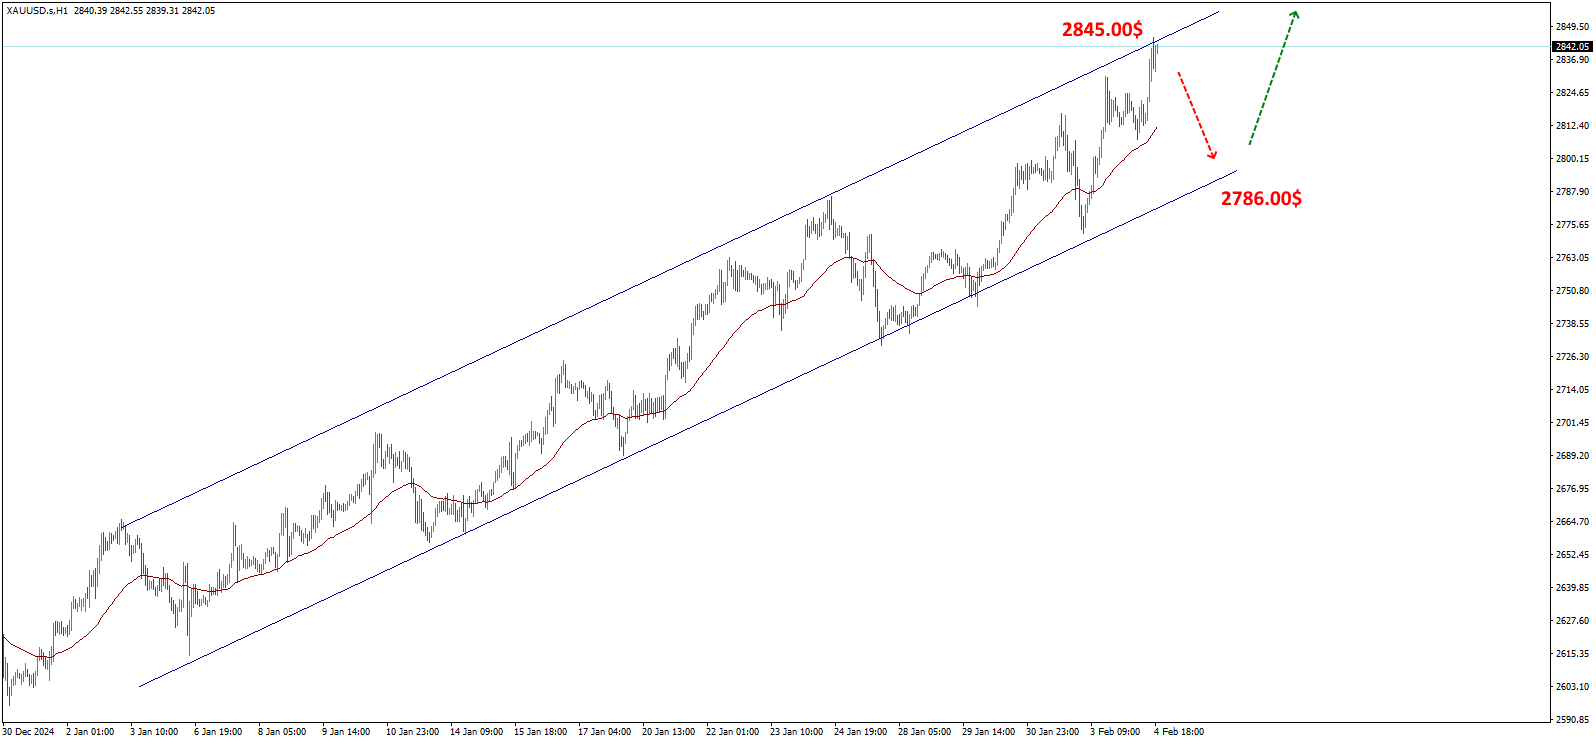
Looking at the instantaneous timeframes, we notice another ascending channel that carries the latest upward wave, where the current test of its resistance level requires caution in upcoming trading, as failure to break through the $2845.00 zone may force a pullback to test the channel’s support around $2786.00 before another recovery.

In summary, the technical factors support a continuation of the upward trend and a drive to achieve additional historic levels. However, reaching the psychological barrier of $3000.00 per ounce might trigger strong sell-offs and further corrections before any new attempt to resume the long-term upward path.
Conversely, it is crucial to note that a break below $2670.00 will derail the bullish path, forcing a downward correction that could target the $2555.00 level and extend losses down to $2375.00 before any renewed upward movement.


 forecast update")