Brazil Fair Trade Decaf Coffee Market 2026 Analysis and Forecast to 2035
Executive Summary
Key Findings
- High-Growth Premium Niche: The Brazil Fair Trade Decaf Coffee market is expanding at an estimated compound annual growth rate (CAGR) of 9% to 14% through 2035, significantly outpacing the broader domestic coffee category. This growth is fueled by converging health-conscious and ethical consumption trends among Brazil’s urban upper-middle class, though the segment represents less than 5% of total specialty coffee volume.
- Structural Import Dependence for Processing: Despite Brazil being the world’s largest green coffee producer, the market for processed Fair Trade Decaf is structurally dependent on international decaffeination supply chains, primarily in Canada and Germany. This re-import model creates a cost premium of 25% to 40% over conventional Fair Trade coffee, limiting mass-market accessibility.
- Arabica Dominance in Premium Channels: Arabica beans command an estimated 85% to 90% share of the certified decaf segment, prized for superior flavor retention post-processing. Robusta and Blended variants are largely confined to private-label and office coffee service (OCS) channels, where cost sensitivity is higher and flavor profiles are less demanding.
Market Trends
- Premium Home Brewing Ecosystem: The post-pandemic normalization of hybrid work has cemented a “home barista” culture in major urban centers like São Paulo and Rio de Janeiro. This has driven demand for single-origin Fair Trade Decaf beans specifically marketed for pour-over, espresso, and AeroPress methods, demanding higher clarity and acidity retention from the decaffeination process.
- CO2 and Swiss Water Process Preference: A clear segmentation is emerging around decaffeination methods. The Carbon Dioxide (CO2) and Swiss Water Processes are perceived as “chemical-free” and superior in flavor preservation, capturing an estimated 20% to 25% of the premium ethical decaf segment. This trend mirrors the global shift toward minimally processed, label-friendly food and beverage products.
- Direct-Trade Vertical Integration: A growing number of specialty roasters are bypassing traditional importers to establish direct-trade agreements with Fair Trade cooperatives in origin countries. This allows roasters to secure traceable, high-grade lots specifically designated for decaffeination, ensuring supply chain transparency and stronger narratives for brand differentiation in a crowded premium space.
Key Challenges
- Cost Complexity and Price Sensitivity: The additive cost of Fair Trade certification premiums, international decaffeination fees, and specialty logistics creates a retail price point for roasted beans that is 60% to 80% higher than conventional specialty coffee. This severely restricts market penetration in a price-conscious domestic market and creates a high barrier to trial for curious consumers.
- Global Decaffeination Capacity Bottlenecks: The market is constrained by limited global capacity at certified decaffeination plants. Securing processing slots requires long lead times (6 to 12 months) and significant advance planning. This lack of agility creates inventory management challenges for Brazilian roasters and importers, often leading to out-of-stock situations for high-demand SKUs.
- Certification Proliferation and Consumer Confusion: The ethical consumption space in Brazil is increasingly crowded with certifications, including Rainforest Alliance, Organic (USDA/EU), B-Corp, and various local sustainability seals. This proliferation dilutes the distinct “Fair Trade” value proposition, requiring roasters to invest heavily in educational marketing to justify the premium associated with the FLO label specifically.
Market Overview
Brazil’s Fair Trade Decaf Coffee market operates at the intersection of the country’s deep-rooted coffee culture and the globalized supply chain for specialty processed goods. While Brazil is a powerhouse of coffee production, the specific sub-market for Fair Trade Decaf is a paradox: it relies heavily on international logistics to transform locally grown green beans into a premium finished product. The market serves a distinct consumer archetype who is both health-motivated (caffeine-sensitive) and ethically engaged.
This buyer is typically an educated, high-income urbanite who views their coffee purchase as a statement of personal and environmental values. The product itself is a tangible high-end grocery item, often sold in sophisticated packaging that emphasizes its certification logos, origin story, and decaffeination method. The category is characterized by high price elasticity at the retail shelf, strong brand loyalty driven by trust in certification, and a supply chain that is unusually complex for a domestic coffee product, involving international partners for processing.
This complexity creates a natural barrier to entry for small players but offers significant differentiation opportunities for brands that can master the logistics and storytelling involved.
Market Size and Growth
Quantifying the exact volume of the Brazil Fair Trade Decaf Coffee market is challenging due to its niche status within the broader coffee import and processing data, but industry proxies point to robust expansion. The segment is growing at a pace three to four times that of the mainstream domestic coffee market, with a projected CAGR in the range of 9% to 14% between 2026 and 2035. This growth is driven primarily by value, as rising certification and energy costs push prices upward, but volume is also expanding steadily.
By the end of the forecast horizon in 2035, the market volume is likely to double or even triple compared to its 2026 base, contingent on the expansion of global decaffeination capacity and continued economic stability in Brazil’s consumer class. The market’s value is disproportionately concentrated in the premium home-consumption segment, which generates the highest revenue per kilogram. The B2B office and corporate gifting segments, while smaller, offer the fastest growth rates due to corporate sustainability commitments and wellness programs.
Despite this rapid expansion, the category will likely retain its niche status, penetrating perhaps 4% to 6% of Brazilian households by 2035, up from less than 2% currently.
Demand by Segment and End Use
By Bean Type: Arabica beans overwhelmingly dominate the Fair Trade Decaf segment, accounting for an estimated 85% to 90% of retail and foodservice volume. The superior flavor complexity of Arabica, particularly when subjected to gentle decaffeination processes, justifies the premium price. Blended products (Arabica/Robusta) represent a smaller, value-oriented segment (5% to 10%), often used in pre-ground “house blend” formats for office coffee services. Pure Robusta Fair Trade Decaf constitutes less than 5% of the market, typically utilized in instant coffee mixes or high-caffeine espresso shots for the corporate market where cost and caffeine kick are prioritized over flavor.
By End Use: At-home consumption is the largest and most lucrative end-use segment, capturing 60% to 70% of total volume. This channel is driven by the “home barista” trend and the desire for ritual. Office and workplace coffee service (OCS) constitutes 20% to 25% of volume, driven by corporate policies aimed at employee wellness and ESG (Environmental, Social, and Governance) targets. Premium gifting is a strategically vital segment, representing 10% to 15% of volume but a comparably higher share of value (20% to 25%) due to premium packaging and higher margins. Gift buyers are highly receptive to the narrative of ethical sourcing and health benefits, making this a key entry point for new consumers.
By Value Chain: Specialty roasters are the primary market makers, holding an estimated 50% to 60% share of the branded segment. Certified importer/brand owners capture 25% to 30%, while private-label retail brands are a growing force, holding 10% to 20% as supermarket chains seek to offer exclusive ethical product lines.
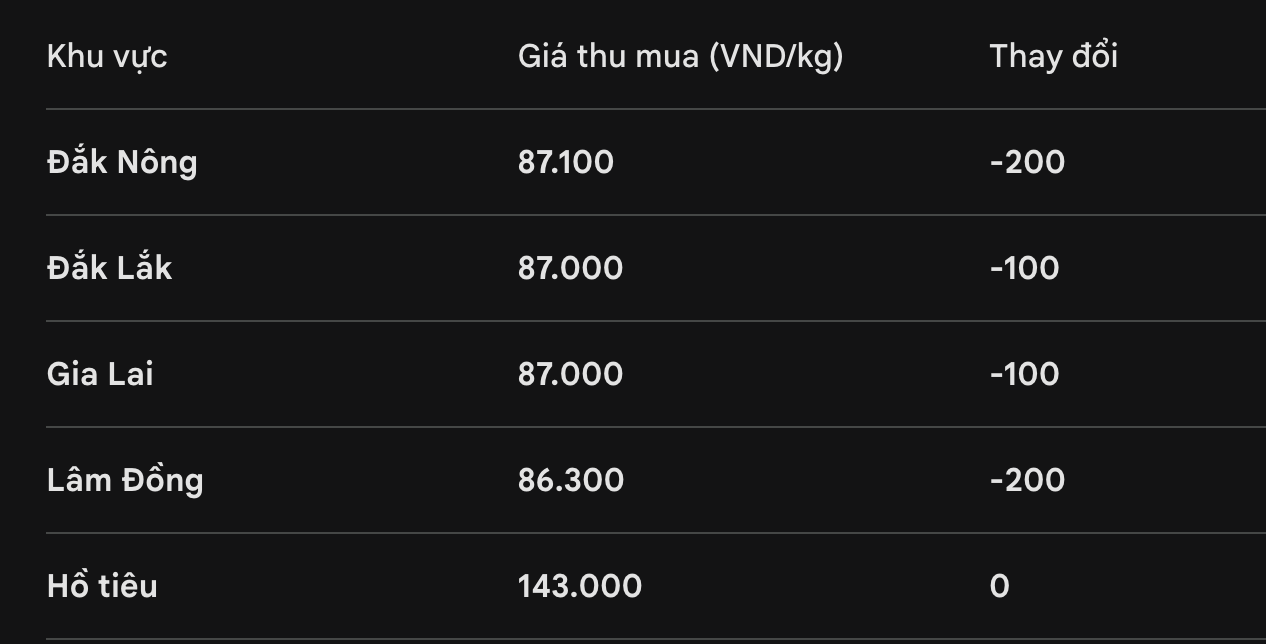
Prices and Cost Drivers
The pricing structure for Fair Trade Decaf Coffee in Brazil is multi-layered and reflects a significant “premium-on-premium” dynamic. The foundation is the commodity green bean price, which is highly volatile. On top of this, the Fair Trade premium (typically $0.20 to $0.40 per lb FOB) guarantees a minimum price to producers. The largest cost differentiator is the decaffeination process itself. The Swiss Water Process and CO2 Process add a substantial $0.80 to $1.50 per lb to the cost of green beans, reflecting the technology and logistics involved.
Roasting, packaging, and brand storytelling add another 100% to 150% markup over the landed cost of processed green beans. At the retail shelf, this complex cost chain results in a price point of R$60 to R$100 for a standardized 250g bag of whole-bean Fair Trade Decaf. This compares to R$25 to R$40 for a comparable bag of non-certified specialty coffee. Macro drivers include energy costs for roasting, international freight rates, and the BRL-USD exchange rate, which directly impacts the cost of imported decaf beans and re-imported Brazilian beans.
Promotional discounting is minimal and tactical due to tight margins, with roasters instead relying on subscription models to stabilize demand and reduce churn.
Suppliers, Manufacturers and Competition
The competitive landscape is a fragmented mix of global FMCG brand owners, agile local specialty roasters, and niche importers. Global brand owners participate in the category through dedicated premium SKUs, leveraging their extensive distribution networks to place Fair Trade Decaf in mainstream grocery channels. Their scale allows them to negotiate better terms on decaffeination processing slots. The heart of the market, however, lies with the specialty roaster segment. These companies compete fiercely on flavor profile, the transparency of their supply chain, and the specific certifications they hold (e.g., USDA Organic + Fair Trade).
They often rely on importers who specialize in ethical and certified green beans to navigate the complexity of sourcing from multiple origin countries. Private-label specialists are an emerging force, producing for supermarket chains and online retailers seeking to capture the ethical consumer with an exclusive brand. Competition is not primarily price-based; it revolves around trust, origin storytelling, and the quality of the cup post-decaffeination.
Wholesalers and distributors act as critical intermediaries, particularly for the B2B office coffee service (OCS) segment, where they bundle Fair Trade Decaf with conventional offerings to create a comprehensive portfolio for corporate clients.
Domestic Production and Supply
Brazil’s role in the Fair Trade Decaf supply chain is deeply paradoxical: it is the world’s largest producer of green coffee, yet its domestic production of the final processed product is minimal. The bottleneck is decaffeination infrastructure. While Brazil has some capacity for Ethyl Acetate (EA) decaffeination, a process often derived from sugar cane, the higher-quality Swiss Water Process and CO2 Process facilities are located overseas, primarily in Canada, Germany, and Mexico.
Most Brazilian roasters depend on a “send-and-receive” model: exporting high-grade Fair Trade certified green beans to these international processors for decaffeination, then re-importing the processed beans. This creates a supply chain that is geographically stretched, capital-intensive, and subject to long lead times. A small but growing portion of the market utilizes imported processed green beans from other origins like Colombia or Ethiopia to offer variety.
The lack of advanced domestic decaffeination capacity is a structural weakness of the market, keeping prices high and limiting the agility of local suppliers to respond to sudden demand spikes. Investment in a local, high-capacity, multi-process decaffeination plant would be a transformative event for the Brazilian market.
Imports, Exports and Trade
The trade flows for Brazil Fair Trade Decaf Coffee involve a complex re-import loop that distinguishes it from conventional coffee trade. Brazil exports massive volumes of green coffee (HS 0901.11) globally. A small, specialized fraction of these exports are high-grade, Fair Trade certified beans destined for decaffeination plants. These beans are processed in Canada, Germany, or Mexico using the Swiss Water or CO2 methods. The resulting decaffeinated green beans are then re-imported into Brazil under HS code 0901.22 (Roasted, Decaffeinated) or 0901.12 (Green, Decaffeinated).
This circular trade is costly but necessary to access preferred processing technology. In addition to re-imports, Brazil imports smaller volumes of ready-processed Fair Trade Decaf beans from other origin countries to diversify its product offering. The “Fair Trade” component is invisible in standard customs data, which tracks only the physical coffee and process, not the certification status. This makes the market opaque to conventional trade analysis, but industry sourcing patterns and certification audits confirm the dominance of the re-import supply model.
Brazil’s strong trade surplus in green coffee is slightly offset by these targeted imports of processed decaf beans.
Distribution Channels and Buyers
Retail: The primary physical retail channels for Fair Trade Decaf in Brazil are high-end supermarket chains (e.g., St. Marché, Zaffari) and specialty gourmet food stores. These physical stores offer high visibility and the opportunity for in-person education about certifications and flavor profiles. E-commerce and Direct-to-Consumer (DTC) channels are the fastest-growing segment, capturing an estimated 25% to 30% of premium sales. DTC allows roasters to offer subscription models, detailed origin stories, and higher margins by bypassing the retailer.
B2B and Foodservice: Office Coffee Service (OCS) distributors are key buyers in this channel, procuring Fair Trade Decaf for corporate break rooms. Corporate procurement managers are a distinct buyer group, motivated by employee satisfaction, wellness initiatives, and ESG reporting. Hospitality (hotels, high-end restaurants) represents a limited but high-margin end-use sector, typically requiring specific packaging formats (e.g., Nespresso-compatible pods, drip bags).
Buyer Groups: The primary consumer buyer groups are ethical-conscious consumers and health-motivated individuals (caffeine-sensitive). These groups overlap significantly. Another influential buyer group is grocery category managers at premium retailers, who see Fair Trade Decaf as a key differentiator for their store brand or specialty aisle.
Regulations and Standards
The market is heavily governed by certification standards and food safety regulations. Fair Trade International (FLO) standards set the baseline for the certification label, imposing minimum pricing, a social premium for producer cooperatives, and specific labor and environmental standards. Operators in Brazil must maintain certified supply chain traceability from the cooperative to the final packager. ANVISA (Brazilian Health Regulatory Agency) regulates the product category, enforcing labeling laws that require clear declaration of ingredients, origin, and caffeine content.
By law, decaf coffee delivered to the consumer must have a caffeine content less than 0.1% on a dry basis. Many Fair Trade Decaf products in Brazil also carry USDA Organic or EU Organic certifications, as the overlap between organic and fair-trade farming practices is significant. This dual certification adds further cost but also enhances the product’s credibility. Country-of-origin labeling regulations require clear distinction between a product grown in Brazil and one that was only processed there, which is a critical factor for the “re-import” supply chain.
Labeling of the decaffeination method (e.g., Swiss Water, CO2) is voluntary but increasingly used as a premium differentiator.
Market Forecast to 2035
Looking ahead to 2035, the Brazil Fair Trade Decaf Coffee market is expected to maintain a healthy growth trajectory, though it will likely remain a high-value niche rather than transitioning into a mass-market segment. Volume growth is forecast to compound at 8% to 10% annually, while value growth is projected to run slightly higher, in the range of 10% to 13% annually, driven by persistent inflation in certification and energy costs, as well as ongoing product premiumization. A key variable influencing the forecast is the potential investment in domestic decaffeination capacity.
If a major Swiss Water or CO2 facility were established in Brazil, the reduction in logistics costs could lower retail prices by 15% to 25%, potentially doubling the addressable market by 2035. Conversely, continued reliance on overseas processing will maintain high price barriers, keeping household penetration below 6%. The competitive landscape will likely see consolidation, with larger roasters and brand owners acquiring smaller ethical brands to stabilize their supply chains and capture the growing segment.
The consumer base will broaden slightly, moving from the top 5% income bracket to the top 15% as “conscious consumption” becomes more mainstream.
Market Opportunities
Domestic Decaffeination Infrastructure: The single greatest opportunity lies in building a state-of-the-art, multi-process decaffeination plant within Brazil. This would bypass the costly and time-consuming re-import loop, allowing Brazilian roasters to offer a “Brazilian Origin” Fair Trade Decaf at a significantly lower price point, dramatically expanding the potential consumer base.
Subscription and DTC Model Optimization: The DTC channel is still under-penetrated relative to its potential. Sophisticated subscription models that offer blending customization, flavor profiling based on brewing method, and educational content about the Fair Trade impact can build high customer lifetime value and stabilize forecasting, directly addressing the supply chain problem of long lead times.
Innovative Product Formats: There is a clear gap in the market for high-quality, single-serve Fair Trade Decaf capsules compatible with the popular Nespresso and Dolce Gusto systems. Developing a certified, compostable pod format for the at-home office market could unlock a large volume of demand among busy professionals seeking convenience without compromising their ethical or health values.
High Reach / Scale
Focused / Niche
Value / Mainstream
Premium / Differentiated
Brand examples
Private Label (e.g., Kroger Simple Truth)
Eight O’Clock Coffee
Scale + Value Leadership
Value and Private-Label Specialists
Mass-Market Portfolio Houses
Wins on reach, promo intensity, and shelf scale.
Brand examples
Peet’s Coffee
Lavazza
Scale + Premium Differentiation
Global Brand Owners and Category Leaders
Premium and Innovation-Led Challengers
Converts brand equity into price resilience and mix.
Brand examples
Cafe Altura
Equal Exchange
Focused / Value Niches
DTC and E-Commerce Native Brands
Regional Brand Houses
Plays where local execution or partner-led scale matters.
Brand examples
Counter Culture Coffee
Intelligentsia
Stumptown
Focused / Premium Growth Pockets
Value and Private-Label Specialists
Vertical integrator (farm-to-cup)
Typical white space for challengers and premium extensions.
Grocery Mass
Leading examples
Private Label
Green Mountain Coffee Roasters
The scale channel: volume, distribution, and shelf defense.
Demand Reach
Mass-market scale
Margin Quality
Tight / promo-heavy
Brand Control
Retailer-led
Specialty Grocery/Natural
Leading examples
Equal Exchange
Cafe Altura
Newman’s Own Organics
Wins where expertise, claims, and trust shape conversion.
Demand Reach
Targeted premium
Margin Quality
Higher / curated
Brand Control
Category-managed
Direct-to-Consumer (Online)
Leading examples
Trade Coffee
Atlas Coffee Club
Best for test-and-learn, premium storytelling, and retention.
Demand Reach
High growth / targeted
Margin Quality
Variable / media-led
Brand Control
High data visibility
Club
Leading examples
Kirkland Signature
Member’s Mark
This channel usually matters for controlled launches, message consistency, and premium mix.
Specialty roaster
Wins where expertise, claims, and trust shape conversion.
Demand Reach
Targeted premium
Margin Quality
Higher / curated
Brand Control
Category-managed
This report is an independent strategic category study of the market for fair trade decaf coffee in Brazil. It is designed for brand owners, general managers, category leaders, trade-marketing teams, e-commerce teams, retail partners, distributors, investors, and market entrants that need a clear read on where growth sits, which brands control the category, how pricing and promotion shape demand, and which channels matter most for scale and margin.
The framework is built for packaged food & beverage markets within consumer goods, where performance is driven by need states, shopper missions, brand hierarchies, price-pack architecture, retail execution, promotional intensity, and route-to-market control rather than by a narrow technical specification alone. It defines fair trade decaf coffee as Coffee beans that have been decaffeinated and certified as Fair Trade, meeting standards for equitable pricing, labor conditions, and environmental sustainability for producers and maps the market through category boundaries, consumer segments, usage occasions, channel structure, brand and private-label positions, supply and availability logic, pricing and promotion mechanics, and country-level commercial roles. Historical analysis typically covers 2012 to 2025, with forward-looking scenarios through 2035.
What questions this report answers
This report is designed to answer the questions that matter most to brand, category, channel, and strategy teams in consumer-goods markets.
- Where category growth and margin pools really sit: how large the market is, which segments are growing, and which parts of the category carry the strongest commercial upside.
- What the category actually includes: where the scope boundary should be drawn relative to adjacent products, substitute baskets, and wider household or personal-care routines.
- Which commercial segments matter most: how the category should be cut by format, need state, shopper occasion, price tier, pack architecture, channel, and brand position.
- How shoppers enter, repeat, trade up, and switch: which need states and shopping missions create the strongest value pools, and what drives loyalty versus substitution.
- Which brands control volume, premium mix, and shelf power: how branded players, challengers, and private label differ in scale, positioning, channel strength, and claims authority.
- How pricing and promotion really work: how price ladders, pack-price logic, promotions, and channel margin structures shape revenue quality and competitive intensity.
- How supply and route-to-market affect performance: where manufacturing, private label, fulfillment, replenishment, and on-shelf availability create advantage or risk.
- Which countries and channels matter most for growth: where to build brand power, where to source or manufacture, and where the next wave of category expansion is likely to come from.
- Where the best white-space opportunities are: which segments, countries, channels, and assortment gaps are most attractive for entry, expansion, or portfolio repositioning.
What this report is about
At its core, this report explains how the market for fair trade decaf coffee actually works as a consumer category. It is built to show where demand comes from, which need states and shopper missions matter most, which brands and private-label players shape the category, which channels control visibility and conversion, and where pricing power, repeat purchase, and margin are actually created.
Rather than framing the category through narrow technical attributes, the study breaks it into decision-grade commercial layers: product format, benefit platform, shopper segment, purchase occasion, pack-price architecture, channel environment, promotional intensity, route-to-market control, and company archetype. It is therefore useful both for teams shaping portfolio strategy and for teams executing growth through Ethical-conscious consumers, Health-motivated consumers (caffeine-sensitive), Corporate gift buyers, Grocery category managers, and Specialty food retailers.
The report also clarifies how value pools differ across Home brewing, Office coffee service, and Premium gifting, how premiumization and private label reshape category economics, how retail concentration and route-to-market design affect scale, and which countries matter most for brand building, sourcing, packaging, and channel expansion.
Research methodology and analytical framework
The report is based on an independent market-intelligence methodology that combines category reconstruction, public company evidence, retail and channel mapping, pricing review, and multi-layer triangulation. It is built for consumer categories where no single public dataset captures the real structure of demand, brand power, promotion, and channel control.
The evidence stack typically combines company disclosures, investor materials, brand and retailer product pages, e-commerce assortment checks, packaging and claims analysis, public pricing references, trade statistics where relevant, regulatory and labeling guidance, and observable route-to-market evidence from distributors, retailers, merchandisers, and marketplace ecosystems.
The analytical model then reconstructs the category across the layers that matter commercially: category scope, shopper need states, consumer segments, pack-price ladders, brand and private-label hierarchy, channel power, promotional intensity, route-to-market design, and country role differences.
Special attention is given to Health & wellness (caffeine reduction), Ethical consumption values, Premiumization at home, Brand trust and transparency, and Third-party certification appeal. The objective is not only to size the market, but to explain where value pools sit, which segments drive mix and repeat purchase, which channels shape growth, and how leading brands defend or expand their positions across Ethical-conscious consumers, Health-motivated consumers (caffeine-sensitive), Corporate gift buyers, Grocery category managers, and Specialty food retailers.
The report does not rely on survey-based opinion as its core evidence base. Instead, it uses observable commercial signals and structured public evidence to build a decision-grade view for brand, category, retail, e-commerce, investment, and market-entry teams.
Commercial lenses used in this report
- Need states, benefit platforms, and usage occasions: Home brewing, Office coffee service, and Premium gifting
- Shopper segments and category entry points: Consumer household, Corporate procurement, and Hospitality (limited)
- Channel, retail, and route-to-market structure: Ethical-conscious consumers, Health-motivated consumers (caffeine-sensitive), Corporate gift buyers, Grocery category managers, and Specialty food retailers
- Demand drivers, repeat-purchase logic, and premiumization signals: Health & wellness (caffeine reduction), Ethical consumption values, Premiumization at home, Brand trust and transparency, and Third-party certification appeal
- Price ladders, promo mechanics, and pack-price architecture: Commodity green bean price, Fair Trade premium, Decaffeination cost, Roasting & packaging cost, Brand premium, Retail margin, and Promotional discounting
- Supply, replenishment, and execution watchpoints: Limited supply of certified decaf green beans, Decaffeination plant capacity & certification, Cost premium of ethical sourcing, and Complexity of maintaining dual (Fair Trade + decaf) supply chains
Product scope
This report defines fair trade decaf coffee as Coffee beans that have been decaffeinated and certified as Fair Trade, meeting standards for equitable pricing, labor conditions, and environmental sustainability for producers and treats it as a branded consumer category rather than as a narrow technical product class. The objective is to capture the real commercial market that category, brand, trade-marketing, and channel teams are managing.
Scope is determined by how the category is sold, merchandised, priced, and chosen in market. That means the report follows product formats, claims, price tiers, pack architecture, need states, and retail environments that shape Home brewing, Office coffee service, and Premium gifting.
The study deliberately separates the category from adjacent baskets when they distort the economics or shopper logic of the market being measured. Typical exclusions therefore include Non-decaffeinated Fair Trade coffee, Decaf coffee without Fair Trade certification, Instant decaf coffee (unless specified Fair Trade), Coffee pods/capsules (separate machinery-driven segment), Foodservice/bulk unpackaged sales, Ready-to-drink (RTD) coffee beverages, Specialty caffeinated coffee, Conventional decaf coffee, Tea and other hot beverages, Coffee substitutes (e.g., chicory), and Coffee brewing equipment.
Product-Specific Inclusions
- Whole bean Fair Trade decaf coffee
- Ground Fair Trade decaf coffee
- Single-origin Fair Trade decaf
- Blended Fair Trade decaf
- Fair Trade & organic (double-certified) decaf
- Consumer packaged goods (CPG) retail formats
Product-Specific Exclusions and Boundaries
- Non-decaffeinated Fair Trade coffee
- Decaf coffee without Fair Trade certification
- Instant decaf coffee (unless specified Fair Trade)
- Coffee pods/capsules (separate machinery-driven segment)
- Foodservice/bulk unpackaged sales
- Ready-to-drink (RTD) coffee beverages
Adjacent Products Explicitly Excluded
- Specialty caffeinated coffee
- Conventional decaf coffee
- Tea and other hot beverages
- Coffee substitutes (e.g., chicory)
- Coffee brewing equipment
Geographic coverage
The report provides focused coverage of the Brazil market and positions Brazil within the wider global consumer-goods industry structure.
The geographic analysis explains local consumer demand conditions, brand and private-label balance, retail concentration, pricing tiers, import dependence, and the country’s strategic role in the wider category.
Geographic and Country-Role Logic
- Origin: Producer countries (e.g., Peru, Colombia, Ethiopia) for certified beans
- Processing: Countries with decaffeination plants (e.g., Canada, Germany, Mexico)
- Consumption: High-income markets with ethical consumption trends (e.g., US, UK, Germany, Nordic countries)
Who this report is for
This study is designed for strategic and commercial users across brand-led consumer categories, including:
- general managers, brand leaders, and portfolio teams evaluating category attractiveness, pricing power, and whitespace;
- category managers, trade-marketing teams, retail buyers, and e-commerce teams prioritizing assortment, promotion, and channel strategy;
- insights, shopper-marketing, and innovation teams tracking need states, occasions, pack-price ladders, claims, and competitive messaging;
- private-label and contract-manufacturing strategists assessing entry options, retailer leverage, and supply-side positioning;
- distributors and route-to-market teams evaluating country and channel expansion priorities;
- investors and strategy teams benchmarking competitive structure, premiumization, revenue quality, and margin logic.
Why this approach matters in consumer categories
In many brand-driven, channel-sensitive, and consumer-demand-led markets, official trade and production statistics are not sufficient on their own to describe the true market. Product boundaries may cut across multiple tariff codes, several product categories may be bundled into the same official classification, and a meaningful share of activity may take place through customized services, captive supply, platform relationships, or technically specialized channels that are not directly visible in standard statistical datasets.
For this reason, the report is designed as a modeled strategic market study. It uses official and public evidence wherever it is reliable and scope-compatible, but it does not force the market into a purely statistical framework when doing so would reduce analytical quality. Instead, it reconstructs the market through the logic of demand, supply, technology, country roles, and company behavior.
This makes the report particularly well suited to products that are innovation-intensive, technically differentiated, capacity-constrained, platform-dependent, or commercially structured around specialized buyer-supplier relationships rather than standardized commodity trade.
Typical outputs and analytical coverage
The report typically includes:
- historical and forecast market size;
- consumer-demand, shopper-mission, and need-state analysis;
- category segmentation by format, benefit platform, channel, price tier, and pack architecture;
- brand hierarchy, private-label pressure, and competitive-structure analysis;
- route-to-market, retail, e-commerce, and availability logic;
- pricing, promotion, trade-spend, and revenue-quality interpretation;
- country role mapping for brand building, sourcing, and expansion;
- major-brand and company archetypes;
- strategic implications for brand owners, retailers, distributors, and investors.


