The main tag of GoldPrice Articles.
You can use the search box below to find what you need.
[wd_asp id=1]
The main tag of GoldPrice Articles.
You can use the search box below to find what you need.
[wd_asp id=1]
Gold price edged lower on Thursday, trading at fresh two-week highs just above the $3,200 mark. De-escalating global trade tensions backed demand for the US Dollar (USD) despite mixed first-tier figures released in the last two sessions. Stocks also benefited from the better mood, with Wall Street extending Wednesday’s rally.
Most Asian and European markets were closed amid the celebration of Labor Day, but the United States (US) ones worked normally. The country released some mixed data, as Initial Jobless Claims for the week ended April 26 rose by 241K, worse than the 224K anticipated and the previous weekly figure of 223K. The April ISM Manufacturing Purchasing Managers’ Index (PMI), on the contrary, posted 48.7, down from the 49 posted in March, but better than the 48 expected.
Earlier in the day, US President Donald Trump noted progress on talks with some Asian countries, including India and Japan. Regarding China, Trump stated that there’s a “very good” chance of making a deal with China, yet added that any deal with Beijing has to be in US terms. Meanwhile, a Beijing-backed outlet reported on Thursday that United States officials have contacted their Chinese counterparts for talks.
Finally, White House trade advisor Peter Navarro down-talked data, saying, “I got to say just one thing about today’s news, that’s the best negative print I have ever seen in my life,” while saying he likes “where we’re at now.”
The week will end with the release of the US Nonfarm Payrolls (NFP) report. The country is expected to have added 130K new job positions in April, while the Unemployment Rate is foreseen at 4.2%, unchanged from March. Employment-related data ahead of the NFP report, however, hints at a soft reading, which may end up weighing on the USD.
From a technical point of view, the daily chart for XAU/USD shows that the risk skews to the downside. The pair is down for a third consecutive day, piercing a mildly bullish 20 Simple Moving Average (SMA) currently at around $3,232.10. The 100 and 200 SMAs maintain their upward slopes far below the current level, yet technical indicators head firmly south, approaching their midlines from above. Selling interest seems strong, and a break below $3,200 should open the door for a continued slide.
In the near term, and according to the 4-hour chart, the XAU/USD pair is poised to extend its slide. After meeting sellers around a mildly bullish 20 SMA, Gold slid below its 100 SMA, which, anyway, maintains its upward slope. Finally, technical indicators resumed their slides within negative levels, anticipating lower lows ahead.
Support levels: 3,200.00 3,188.30 3,176.40
Resistance levels: 3,232.10 3,245.20 3,261.70
Tariffs are customs duties levied on certain merchandise imports or a category of products. Tariffs are designed to help local producers and manufacturers be more competitive in the market by providing a price advantage over similar goods that can be imported. Tariffs are widely used as tools of protectionism, along with trade barriers and import quotas.
Although tariffs and taxes both generate government revenue to fund public goods and services, they have several distinctions. Tariffs are prepaid at the port of entry, while taxes are paid at the time of purchase. Taxes are imposed on individual taxpayers and businesses, while tariffs are paid by importers.
There are two schools of thought among economists regarding the usage of tariffs. While some argue that tariffs are necessary to protect domestic industries and address trade imbalances, others see them as a harmful tool that could potentially drive prices higher over the long term and lead to a damaging trade war by encouraging tit-for-tat tariffs.
During the run-up to the presidential election in November 2024, Donald Trump made it clear that he intends to use tariffs to support the US economy and American producers. In 2024, Mexico, China and Canada accounted for 42% of total US imports. In this period, Mexico stood out as the top exporter with $466.6 billion, according to the US Census Bureau. Hence, Trump wants to focus on these three nations when imposing tariffs. He also plans to use the revenue generated through tariffs to lower personal income taxes.
Nonetheless, natural gas is in a counter-trend rally within a bearish trend structure. It is rising into multiple potential resistance areas. How it behaves around those price levels should leave clues about what may come next. In general, once the 20-Day line is reclaimed, the 50-Day MA becomes a potential upside target. The 50-Day MA is now at $3.81 and falling. It is a little above potential resistance around an AVWAP level at $3.75, anchored at the top of the trend.
A bullish weekly reversal triggered this week indicating that a higher swing low has been established for the long-term uptrend and showing the buyers in charge. The uptrend can be defined as a rising parallel trend channel. It is interesting to observe that the middle line of the rising channel (dashed) is rapidly being approached for a test as resistance.
There is a weekly high at $3.61 that can be used as a proxy for the line. If that high can be exceeded, the $3.75 AVWAP level and 50-Day MA become the next upside targets, and it would be another sign of strength on the weekly time frame. A daily close above that weekly high would further confirm strength and increase the chance that natural gas could keep rising.
Note that yesterday support was found at the AVWAP line (light blue) from the recent bottom. Therefore, it may identify support in the future. Short-term support is now around the 20-Day MA and today’s low, which was $3.34.
For a look at all of today’s economic events, check out our economic calendar.
Silver price (XAG/USD) recovers a majority of its early losses and returns to near $32.50 during North American trading hours on Thursday. The white metal gained ground after posting a fresh over two-week low around $31.66, earlier in the day, even though the US Dollar (USD) has extended its two-day recovery.
The table below shows the percentage change of US Dollar (USD) against listed major currencies today. US Dollar was the strongest against the Japanese Yen.
| USD | EUR | GBP | JPY | CAD | AUD | NZD | CHF | |
|---|---|---|---|---|---|---|---|---|
| USD | 0.37% | 0.25% | 1.54% | 0.23% | 0.21% | 0.35% | 0.72% | |
| EUR | -0.37% | -0.12% | 1.13% | -0.17% | -0.14% | -0.02% | 0.33% | |
| GBP | -0.25% | 0.12% | 1.26% | -0.02% | -0.03% | 0.10% | 0.46% | |
| JPY | -1.54% | -1.13% | -1.26% | -1.30% | -1.29% | -1.22% | -0.87% | |
| CAD | -0.23% | 0.17% | 0.02% | 1.30% | 0.00% | 0.12% | 0.48% | |
| AUD | -0.21% | 0.14% | 0.03% | 1.29% | -0.00% | 0.12% | 0.50% | |
| NZD | -0.35% | 0.02% | -0.10% | 1.22% | -0.12% | -0.12% | 0.36% | |
| CHF | -0.72% | -0.33% | -0.46% | 0.87% | -0.48% | -0.50% | -0.36% |
The heat map shows percentage changes of major currencies against each other. The base currency is picked from the left column, while the quote currency is picked from the top row. For example, if you pick the US Dollar from the left column and move along the horizontal line to the Japanese Yen, the percentage change displayed in the box will represent USD (base)/JPY (quote).
Technically, a higher US Dollar makes the Silver price an expensive bet for investors.
The US Dollar Index (DXY), which tracks the Greenback’s value against six major currencies, jumps above 100.00. The USD strengthens even though the United States (US) ISM Manufacturing PMI data for April has shown that activities declined at a faster pace. The Manufacturing PMI is down at 48.7 from 49.0 in March but higher than estimates of 48.0.
Meanwhile, ISM Manufacturing Prices Paid, which gauges change in input cost, expanded at a faster pace to 69.8 from 69.4, but missed estimates of 70.3. Accelerating input costs are expected to feed consumer inflation. Such a scenario will limit the Federal Reserve (Fed) from reducing interest rates, which bodes poorly for non-yielding assets, such as Silver.
Earlier in the day, the Silver price fell sharply as investors expected that fears of additional tariffs announced by US President Donald Trump have peaked as Washington is close to announcing a bilateral trades with number of its trading partners soon.
“Initial trade deals are to be announced in weeks, not months,” US Trade Representative Jamieson Greer said at Fox News, Reuters reported.
However, trade uncertainty between the US and China will keep the downside in the Silver price limited.
Silver price struggles to revisit an over three-week high around $33.70. The near-term outlook of the white metal has become uncertain as it falls below the 20-day Exponential Moving Average (EMA), which trades around $32.65.
The 14-day Relative Strength Index (RSI) falls below 50.00 after failing to break above 60.00, indicating that investors are not bullish anymore.
Looking up, the March 28 high of $34.60 will act as key resistance for the metal. On the downside, the April 11 low of $30.90 will be the key support zone.
Silver is a precious metal highly traded among investors. It has been historically used as a store of value and a medium of exchange. Although less popular than Gold, traders may turn to Silver to diversify their investment portfolio, for its intrinsic value or as a potential hedge during high-inflation periods. Investors can buy physical Silver, in coins or in bars, or trade it through vehicles such as Exchange Traded Funds, which track its price on international markets.
Silver prices can move due to a wide range of factors. Geopolitical instability or fears of a deep recession can make Silver price escalate due to its safe-haven status, although to a lesser extent than Gold’s. As a yieldless asset, Silver tends to rise with lower interest rates. Its moves also depend on how the US Dollar (USD) behaves as the asset is priced in dollars (XAG/USD). A strong Dollar tends to keep the price of Silver at bay, whereas a weaker Dollar is likely to propel prices up. Other factors such as investment demand, mining supply – Silver is much more abundant than Gold – and recycling rates can also affect prices.
Silver is widely used in industry, particularly in sectors such as electronics or solar energy, as it has one of the highest electric conductivity of all metals – more than Copper and Gold. A surge in demand can increase prices, while a decline tends to lower them. Dynamics in the US, Chinese and Indian economies can also contribute to price swings: for the US and particularly China, their big industrial sectors use Silver in various processes; in India, consumers’ demand for the precious metal for jewellery also plays a key role in setting prices.
Silver prices tend to follow Gold’s moves. When Gold prices rise, Silver typically follows suit, as their status as safe-haven assets is similar. The Gold/Silver ratio, which shows the number of ounces of Silver needed to equal the value of one ounce of Gold, may help to determine the relative valuation between both metals. Some investors may consider a high ratio as an indicator that Silver is undervalued, or Gold is overvalued. On the contrary, a low ratio might suggest that Gold is undervalued relative to Silver.
Natural gas price failed to resume the bullish attack, affected by a stochastic attempt to exit the overbought level, which forces it to provide sideways trading by its stability near $3.400, note that the price might form a temporary negative rebound, to target $2.280 level before any attempt to renew the bullish attempts in the current period.
While its rally above the $3.480 level and providing a positive close will reinforce the chances for resuming the bullish attack, to keep waiting for recording the main targets near $3.540 and $3.610.
The expected trading range for today is between $3.280 and $3.450
Trend forecast: Fluctuated
Do you need help in trading decisions? Do you want to learn how to start trading?
Join Economies.com VIP Club and benefit from over 15 years of market analysis expertise and get:
Special Offer: Subscribe to the Economies.com VIP channel and get also a free subscription to a trusted trading signals channel provided by Best Trading Signal.
Gold prices have slipped below two crucial areas of support as hopes of a trade deal between the US-China continues to grow. The precious metal is now trading near a two-week low.
Risk appetite and sentiment continues to improve on rising hopes that a trade deal between the US-China will be reached. According to reports from both Bloomberg and the Financial Times, the Trump administration has reportedly tried reaching out to Beijing to start tariff talks, according to a Chinese state-run media outlet.
The outlet stated that China isn’t in a rush to negotiate and won’t engage unless the US takes meaningful actions. However, it added that there’s no harm for China in talking if the US wants to. Analysts noted this language shows a softer stance from Beijing compared to last week, when China’s commerce ministry said negotiations couldn’t begin until the US removed its heavy tariffs.
The result of this growing optimism has definitely weighed on safe haven demand and thus pushed Gold prices lower.
The U.S. economy shrank by 0.3% in the first quarter of 2025, its first decline since early 2022. This was a sharp drop from 2.4% growth in the previous quarter and missed market predictions of 0.3% growth.
A 41.3% jump in imports played a big role in slowing the economy, as businesses and consumers stocked up on goods ahead of higher costs from new tariffs announced by the Trump administration. Consumer spending grew just 1.8%, its slowest pace since mid-2023, and federal government spending fell by 5.1%, the biggest drop since early 2022. However, fixed investment rose by 7.8%, the largest increase since mid-2023.
The impact saw the US Dollar weaken as recession fears gained momentum. Gold prices also enjoyed a rally but as we have noted of late, tariff developments will overshadow data releases in the short-term.
Gold failed to hold onto gains and experienced a swift selloff in the Asian session as it failed to consolidate gains above the $3300/oz handle.
There remains a significant amount of high impact data releases for the US this week, with the NFP release tomorrow taking center stage.
Even if the data disappoints, the chances of a stellar Gold recovery may not be forthcoming. As long as sentiment and risk appetite continues to improve Gold bulls will face significant headwinds.

For all market-moving economic releases and events, see the MarketPulse Economic Calendar. (click to enlarge)
From a technical analysis standpoint, Gold prices have failed to hold above crucial support at the $3300/oz handle.
A daily candle close below the 3300 handle yesterday has led to an accelerated selloff in the Asian session. This has continued after the European open with the precious metal trading at 3220 at the time of writing.
Looking at the period-14 RSI and it is approaching the neutral 50 level which could prove key. A bounce here could be a sign that bullish momentum remains intact and thus facilitate a short-term recovery.
The precious metal is down around $60 on the day and yet a push toward support at the 3200 handle looks likely.
A crucial level of support i will be keeping an eye on rests at 3167, which was the April 3 swing high, just after the universal tariff announcements. This level could hold the key, and have a big impact on whether the precious metal is able to hold above the crucial 3000 handle.
Gold (XAU/USD) Daily Chart, May 1, 2025
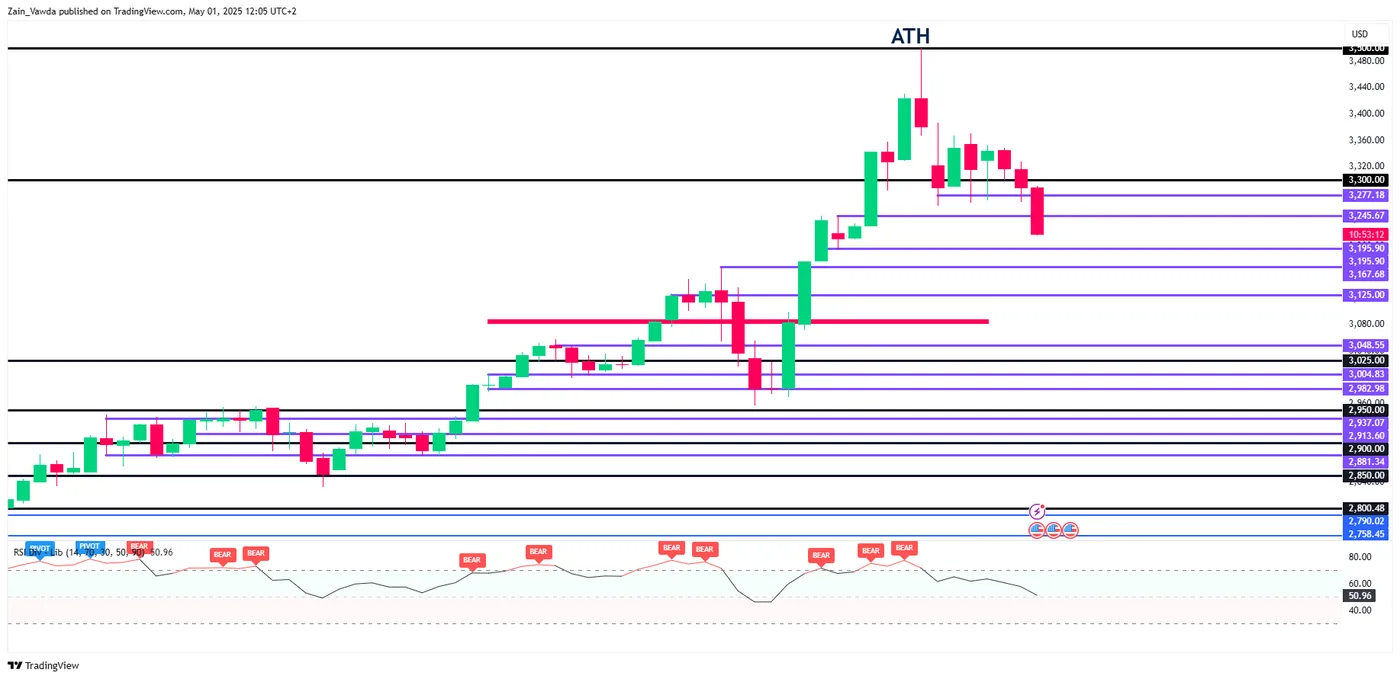
Source: TradingView (click to enlarge)
Support
Resistance
Natural gas price failed to resume the bullish attack, affected by a stochastic attempt to exit the overbought level, which forces it to provide sideways trading by its stability near $3.400, note that the price might form a temporary negative rebound, to target $2.280 level before any attempt to renew the bullish attempts in the current period.
While its rally above the $3.480 level and providing a positive close will reinforce the chances for resuming the bullish attack, to keep waiting for recording the main targets near $3.540 and $3.610.
The expected trading range for today is between $3.280 and $3.450
Trend forecast: Fluctuated
Do you need help in trading decisions? Do you want to learn how to start trading?
Join Economies.com VIP Club and benefit from over 15 years of market analysis expertise and get:
Special Offer: Subscribe to the Economies.com VIP channel and get also a free subscription to a trusted trading signals channel provided by Best Trading Signal.
The GBPUSD declined in its recent intraday trading, with the emergence of the negative signals on the (RSI), which caused the loss of the previous positive momentum, and that led it to break a minor bullish bias line that represents a dynamic support for the price of recent trading.
The pressure increased with surpassing the support of EMA50, which is considered as an extra confirmation for the weakness of the previous bullish trend, and the price move to a clear correctional station that threatens for more downside moves, especially after losing technical support that might limit the negative momentum.
Therefore, our expectations suggest more of the downside movement for the GBPUSD price in its upcoming intraday trading, if the price settles below 1.3345, to target the critical support at 1.3230.
The expected trading range is between 1.3270 support and 1.3365 resistance.
Today’s forecast: Bearish
Do you need help in trading decisions? Do you want to learn how to start trading?
Join Economies.com VIP Club and benefit from over 15 years of market analysis expertise and get:
Special Offer: Subscribe to the Economies.com VIP channel and get also a free subscription to a trusted trading signals channel provided by Best Trading Signal.
The GBPUSD declined in its recent intraday trading, with the emergence of the negative signals on the (RSI), which caused the loss of the previous positive momentum, and that led it to break a minor bullish bias line that represents a dynamic support for the price of recent trading.
The pressure increased with surpassing the support of EMA50, which is considered as an extra confirmation for the weakness of the previous bullish trend, and the price move to a clear correctional station that threatens for more downside moves, especially after losing technical support that might limit the negative momentum.
Therefore, our expectations suggest more of the downside movement for the GBPUSD price in its upcoming intraday trading, if the price settles below 1.3345, to target the critical support at 1.3230.
The expected trading range is between 1.3270 support and 1.3365 resistance.
Today’s forecast: Bearish
Do you need help in trading decisions? Do you want to learn how to start trading?
Join Economies.com VIP Club and benefit from over 15 years of market analysis expertise and get:
Special Offer: Subscribe to the Economies.com VIP channel and get also a free subscription to a trusted trading signals channel provided by Best Trading Signal.
The Gold price (XAU/USD) extends the decline to around $3,245 during the early Asian session on Thursday. The precious metal edges lower to near two-week low amid easing US-China trade tensions as traders hope for US-China trade deal after US President Donald Trump’s comments
Risk sentiment is improving as Trump said early Thursday that there is a “very good probability that the United States will reach a deal with China, but the agreement must align with its conditions. Optimism surrounding tariff lift the Greenback and weakens demand for traditional safe-haven assets like Gold as it makes yellow metal more expensive for holders of other currencies.
On Tuesday, Trump signed an executive order aimed at easing tariffs on foreign auto parts, granting carmakers a two-year window to raise domestic sourcing. Additionally, US Treasury Secretary Scott Bessent emphasized “very good” offers from trade partners. US trade representative Jamieson Greer said late Wednesday that US President Donald Trump’s administration expects to conclude initial tariff deals with some US trading partners within weeks.
On the other hand, rate cut hopes from the US Federal Reserve (Fed) after weaker-than-expected US economic data might help limit the yellow metal’s losses. The US economy contracted at an annualised rate of 0.3% in the first quarter (Q1) of 2025, according to the US Commerce Department on Thursday. This figure came in weaker than the estimation of 0.4% and down from the previous reading of a 2.4% expansion.
Futures contracts see the Fed starting rate cuts in June, with a total of four quarter-point reductions expected, lowering the rate to the 3.25%-3.50% band by year-end. Investors will closely watch the US April employment data due on Friday for fresh impetus. The NFP is expected to show 130K job additions in April, while the Unemployment Rate is estimated to remain at 4.2%.
Gold has played a key role in human’s history as it has been widely used as a store of value and medium of exchange. Currently, apart from its shine and usage for jewelry, the precious metal is widely seen as a safe-haven asset, meaning that it is considered a good investment during turbulent times. Gold is also widely seen as a hedge against inflation and against depreciating currencies as it doesn’t rely on any specific issuer or government.
Central banks are the biggest Gold holders. In their aim to support their currencies in turbulent times, central banks tend to diversify their reserves and buy Gold to improve the perceived strength of the economy and the currency. High Gold reserves can be a source of trust for a country’s solvency. Central banks added 1,136 tonnes of Gold worth around $70 billion to their reserves in 2022, according to data from the World Gold Council. This is the highest yearly purchase since records began. Central banks from emerging economies such as China, India and Turkey are quickly increasing their Gold reserves.
Gold has an inverse correlation with the US Dollar and US Treasuries, which are both major reserve and safe-haven assets. When the Dollar depreciates, Gold tends to rise, enabling investors and central banks to diversify their assets in turbulent times. Gold is also inversely correlated with risk assets. A rally in the stock market tends to weaken Gold price, while sell-offs in riskier markets tend to favor the precious metal.
The price can move due to a wide range of factors. Geopolitical instability or fears of a deep recession can quickly make Gold price escalate due to its safe-haven status. As a yield-less asset, Gold tends to rise with lower interest rates, while higher cost of money usually weighs down on the yellow metal. Still, most moves depend on how the US Dollar (USD) behaves as the asset is priced in dollars (XAU/USD). A strong Dollar tends to keep the price of Gold controlled, whereas a weaker Dollar is likely to push Gold prices up.
Gold price is extending its bearish momentum into a third consecutive day early Thursday, languishing near two-week lows. Trade headlines have yet again overshadowed the US economic data, significantly impacting the traditional safe-haven Gold price.
The US Dollar (USD) builds on its recovery, capitalizing on the latest remarks from US President Donald Trump, stating that he has “potential” trade deals with India, South Korea and Japan and that there is a very good chance of reaching an agreement with China.
These optimistic comments on the trade front lift risk sentiment and trigger a fresh leg down in the USD-denominated Gold price, diminishing its haven appeal. Hopes over a likely US-China trade war de-escalation continue to act as a headwind for the bright metal.
Meanwhile, markets shrug off the rejection of a bipartisan measure to block Trump’s tariffs by the Senate and the earlier comments from US Trade Representative Jamieson Greer, citing that no official talks were happening with China.
All in all, Gold’s fate hinges on the sentiment surrounding trade developments, as any reaction to the US economic data releases remains short-lived. Traders will also look to the US ISM Manufacturing PMI and Jobless Claims data for some trading incentives ahead of Friday’s Nonfarm Payrolls (NFP) showdown.
The first look of the US annualized Gross Domestic Product (GDP) on Wednesday showed that the US economy contracted for the first time in three months to 0.3% in the first quarter of 2025 as US firms frontloaded to get ahead of the US levies, resulting in an imports surge.
Meanwhile, the core Personal Consumption Expenditures (PCE) Price Index, which excludes volatile food and energy prices, rose 2.6% in March, down from the 3% increase reported in February.
Gold price jumped briefly above $3,300 following the US GDP and inflation data but failed to sustain the rebound on Trump’s conciliatory remarks following the bleak GDP reading. The US President said in his Truth Social post that “this will take a while, has NOTHING TO DO WITH TARIFFS, only that he left us with bad numbers, but when the boom begins, it will be like no other. BE PATIENT!!!”
At the time of writing, Gold price extends the downside break of a three-week-long rising channel confirmed on Wednesday.
Gold price settled well below the rising trendline support, then at $3,351, on Wednesday, paving the way for more downside.
The 14-day Relative Strength Index (RSI) has stretched its descent, currently testing the midline near 53.50. The leading indicator remains above 50, keeping some hopes alive for Gold buyers.
Gold price must defend the critical 21-day Simple Moving Average (SMA) at $3,230 on a daily closing basis to keep the doors open for a turnaround.
If the latter holds the fort, Gold buyers could test the rising channel support-now-resistance at $3,383 on the road to recovery.
However, recapturing the previous day’s high of $3,328 is critical at first.
On the other hand, if sellers crack the 21-day SMA at $3,230 on a sustained basis, a fresh decline toward the $3,150 psychological level cannot be ruled out.
The 50-day SMA at $3,081 will be next on sellers’ radars.
Generally speaking, a trade war is an economic conflict between two or more countries due to extreme protectionism on one end. It implies the creation of trade barriers, such as tariffs, which result in counter-barriers, escalating import costs, and hence the cost of living.
An economic conflict between the United States (US) and China began early in 2018, when President Donald Trump set trade barriers on China, claiming unfair commercial practices and intellectual property theft from the Asian giant. China took retaliatory action, imposing tariffs on multiple US goods, such as automobiles and soybeans. Tensions escalated until the two countries signed the US-China Phase One trade deal in January 2020. The agreement required structural reforms and other changes to China’s economic and trade regime and pretended to restore stability and trust between the two nations. However, the Coronavirus pandemic took the focus out of the conflict. Yet, it is worth mentioning that President Joe Biden, who took office after Trump, kept tariffs in place and even added some additional levies.
The return of Donald Trump to the White House as the 47th US President has sparked a fresh wave of tensions between the two countries. During the 2024 election campaign, Trump pledged to impose 60% tariffs on China once he returned to office, which he did on January 20, 2025. With Trump back, the US-China trade war is meant to resume where it was left, with tit-for-tat policies affecting the global economic landscape amid disruptions in global supply chains, resulting in a reduction in spending, particularly investment, and directly feeding into the Consumer Price Index inflation.