About Editorial team of BIPNs

Main team of content of bipns.com. Any type of content should be approved by us.
18 11, 2024

CAD/JPY Forecast Today 14/11: Pushes Higher (Video)

By |2024-11-18T08:03:55+02:00November 18, 2024|Forex News, News|0 Comments

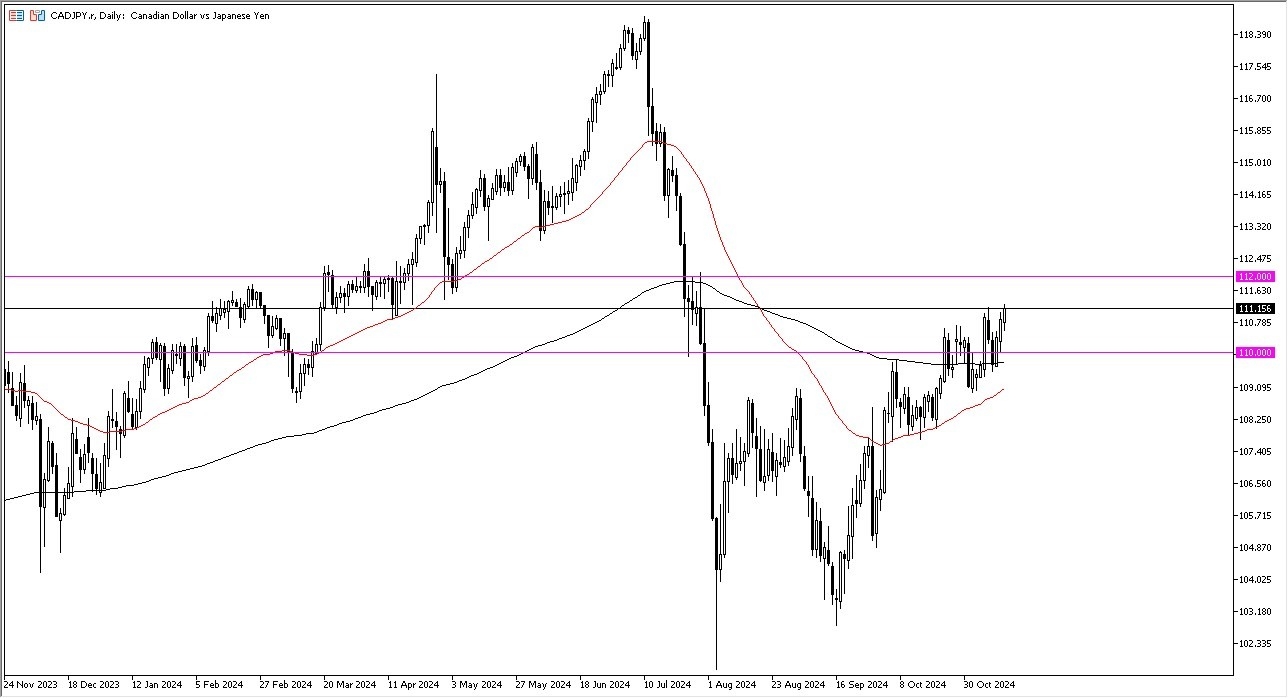
  • The Canadian dollar initially pulled back just a bit during the early hours on Wednesday, as the Japanese yen saw a little bit of strength early, but we have since turned around to show signs of life.
  • All things being equal, this is a market that has been very noisy for a while, and the fact that we had bounced from a couple of days ago at the 200 day EMA does suggest that we are going to continue to try to grind to the upside.
  • The 112 yen level is the top of an overall consolidation range that we have been in, and if we can break above that level, then it’s likely that we will go much higher.

On the other hand, if we turn around and drop from here, the 200 day EMA sits right around the 110 yen level, which of course is a large round psychologically significant figure and an area that a lot of people will be paying close attention to. Keep in mind that this is also a play on oil a lot of the times due to the fact that Canada is a major exporter of crude oil, while the Japanese import 100 percent of theirs. With this being the case, it does tend to move right along with the WTI crude oil market, for example.

Noisy Market Will Continue to Be So

That being said, the market is going to continue to be noisy, but I think given enough time, we will have to make a bigger decision. The Japanese yen itself is being hindered by the fact that the Bank of Japan can’t do anything to tighten interest rates, and as long as that’s going to be the case, there’s really no reason to think that the yen will strengthen significantly, unless of course there’s been some type of event.

I think this is a grind to the 112 yen level, and once we can break out of there, then we can really take off. For what it is worth, the US dollar climbed over a major hurdle against the yen today, so we may see the yen fall apart everywhere.

Ready to trade our Forex daily analysis and predictions? Here’s a list of the best Forex Trading platform in Canada to choose from. 

Source link

18 11, 2024

XAU/USD bounces off key support on renewed Russia-Ukraine geopolitical risks

By |2024-11-18T07:43:32+02:00November 18, 2024|Forex News, News|0 Comments


  • Gold price rises for the first time in seven days as a new week begins.
  • Renewed Russia-Ukraine geopolitical woes and a subdued US Dollar aid the Gold price rebound.
  • Gold price defends key support near $2,550 as the daily RSI tests oversold territory and bounces.   

Gold price stages a solid comeback early Monday, testing the $2,600 threshold as buyers return on looming risks of a geopolitical escalation between Russia and Ukraine.   

Gold price capitalizes on safe-haven demand

In the latest development that occurred over the weekend,  US President Joe Biden authorized Ukraine to use  American Army Tactical Missile Systems (ATACMS) to strike inside Russia. The decision to allow the use of long-range US weapons inside Russia came after Moscow deployed North Korean ground troops to supplement its own forces.

Markets remain wary of further escalation in the Russia-Ukraine tensions amid the ongoing conflict between Israel and Iran, spurring safe-haven flows into the bright metal.

Gold price also capitalizes on China’s efforts to ramp up the country’s stock market activity. China Securities Regulatory Commission (CSRC) announced that it will expand the scope of stock eligible to trade via the Shanghai-Hong KongStock Connect.

Note that China is the world’s top Gold consumer, and any support measures by the local authorities to boost economic performance seem positive for the precious metal.

Meanwhile, a broad-based US Dollar (USD) upside consolidative phase also aids the Gold price upswing as buyers take a breather heading into the new week.

The USD has rallied hard to reach the highest level in a year against its major rivals last week, courtesy of the Trump trades. US President-elect Donald Trump’s fiscal and trade policies are seen as inflationary and supportive of a higher Greenback.

Attention now remains on the upcoming speech by Chicago Federal Reserve (Fed) President Austan Goolsbee in the absence of top-tier economic releases on Monday. Geopolitical developments will also be closely eyed for any significant impact on the traditional safe-haven asset, Gold.

Gold price technical analysis: Daily chart

The short-term technical outlook for Gold price remains more or less the same, with any recovery attempts likely to be short-lived as long as the 14-day Relative Strength Index (RSI) stays bearish.

However, the latest uptick in the leading indicator justifies the Gold price rebound from the critical support of $2,548, where the 100-day Simple Moving Average (SMA) and the September 18 low merge.

In doing so, Gold price challenges the $2,600 mark. Recapturing the latter on a daily closing basis is critical to unleashing the additional recovery toward the November 13 high of $2,619.

Further up, the $2,650 psychological barrier could check the upswing. The 50-day SMA aligns near that level, making it a strong resistance.

On the flip side, the immediate support is seen at the abovementioned confluence support of $2,548.

A sustained break below the last will initiate a fresh downtrend toward the $2,500 threshold, with the next bearish target seen at the September 4 low of $2,472.

Gold FAQs

Gold has played a key role in human’s history as it has been widely used as a store of value and medium of exchange. Currently, apart from its shine and usage for jewelry, the precious metal is widely seen as a safe-haven asset, meaning that it is considered a good investment during turbulent times. Gold is also widely seen as a hedge against inflation and against depreciating currencies as it doesn’t rely on any specific issuer or government.

Central banks are the biggest Gold holders. In their aim to support their currencies in turbulent times, central banks tend to diversify their reserves and buy Gold to improve the perceived strength of the economy and the currency. High Gold reserves can be a source of trust for a country’s solvency. Central banks added 1,136 tonnes of Gold worth around $70 billion to their reserves in 2022, according to data from the World Gold Council. This is the highest yearly purchase since records began. Central banks from emerging economies such as China, India and Turkey are quickly increasing their Gold reserves.

Gold has an inverse correlation with the US Dollar and US Treasuries, which are both major reserve and safe-haven assets. When the Dollar depreciates, Gold tends to rise, enabling investors and central banks to diversify their assets in turbulent times. Gold is also inversely correlated with risk assets. A rally in the stock market tends to weaken Gold price, while sell-offs in riskier markets tend to favor the precious metal.

The price can move due to a wide range of factors. Geopolitical instability or fears of a deep recession can quickly make Gold price escalate due to its safe-haven status. As a yield-less asset, Gold tends to rise with lower interest rates, while higher cost of money usually weighs down on the yellow metal. Still, most moves depend on how the US Dollar (USD) behaves as the asset is priced in dollars (XAU/USD). A strong Dollar tends to keep the price of Gold controlled, whereas a weaker Dollar is likely to push Gold prices up.


Source link

18 11, 2024

XAU/USD recovers above $2,550 as US Dollar enters consolidation mode

By |2024-11-18T05:42:37+02:00November 18, 2024|Forex News, News|0 Comments


  • The Gold price attracts some buyers to around $2,570 in Monday’s early Asian session. 
  • Traders wind back expectations for a Fed rate cut in December, weighing on the yellow metal.
  • Geopolitical risks could boost the Gold price, a traditional safe-haven asset. 

The Gold price (XAU/USD) rebounds to near $2,570, snapping the six-day losing streak during the early Asian trading hours on Monday. However, the strength of the US Dollar (USD) might cap the upside for the precious metal. 

The Greenback rally in the wake of Donald Trump’s election win could exert some selling pressure on the USD-denominated Gold price. The expectations of higher inflation next year due to Donald Trump’s policies have led to fewer expected rate cuts. 

Furthermore, traders pared back expectations for lower rates in December after Fed Chair Jerome Powell said that the US central bank would be in no rush to cut, citing the “remarkably good” performance of the economy. Higher interest rates generally drag the Gold price lower, as it makes holding non-yielding assets like gold less appealing.

On the other hand, the rising geopolitical tensions in the Middle East and the ongoing conflict between Ukraine and Russia could boost the safe-haven flows, benefiting the yellow metal. President Joe Biden’s administration has allowed Ukraine to use US arms to strike inside Russia in a significant reversal of Washington’s policy in the Ukraine-Russia conflict, per Reuters. 

Gold FAQs

Gold has played a key role in human’s history as it has been widely used as a store of value and medium of exchange. Currently, apart from its shine and usage for jewelry, the precious metal is widely seen as a safe-haven asset, meaning that it is considered a good investment during turbulent times. Gold is also widely seen as a hedge against inflation and against depreciating currencies as it doesn’t rely on any specific issuer or government.

Central banks are the biggest Gold holders. In their aim to support their currencies in turbulent times, central banks tend to diversify their reserves and buy Gold to improve the perceived strength of the economy and the currency. High Gold reserves can be a source of trust for a country’s solvency. Central banks added 1,136 tonnes of Gold worth around $70 billion to their reserves in 2022, according to data from the World Gold Council. This is the highest yearly purchase since records began. Central banks from emerging economies such as China, India and Turkey are quickly increasing their Gold reserves.

Gold has an inverse correlation with the US Dollar and US Treasuries, which are both major reserve and safe-haven assets. When the Dollar depreciates, Gold tends to rise, enabling investors and central banks to diversify their assets in turbulent times. Gold is also inversely correlated with risk assets. A rally in the stock market tends to weaken Gold price, while sell-offs in riskier markets tend to favor the precious metal.

The price can move due to a wide range of factors. Geopolitical instability or fears of a deep recession can quickly make Gold price escalate due to its safe-haven status. As a yield-less asset, Gold tends to rise with lower interest rates, while higher cost of money usually weighs down on the yellow metal. Still, most moves depend on how the US Dollar (USD) behaves as the asset is priced in dollars (XAU/USD). A strong Dollar tends to keep the price of Gold controlled, whereas a weaker Dollar is likely to push Gold prices up.


Source link

18 11, 2024

Ripple Blooms in a Trump World, but this Altcoin Rival Still Outruns It with 82,102% Rise

By |2024-11-18T02:00:03+02:00November 18, 2024|Crypto News, News|0 Comments

The XRP price has performed impressively following Donald Trump’s victory in the US election. However, Ripple investors are searching for alternative investments, and there is no end in sight to the SEC vs. Ripple Labs case. 

Meanwhile, RCO Finance (RCOF), a new DeFi altcoin, has attracted investors after raising $5 million during its presale. 

Between XRP and RCO Finance (RCOF), which altcoin is poised to deliver the highest ROI by early 2025? Let’s find out!

XRP Price Surges 57% in a Week: More Gains Coming?

The XRP price has performed laudably over the past seven days. On November 8, XRP was changing hands at around $0.5550. Following days of trading around this range, the XRP price gained momentum on October 13 after Bitcoin (BTC) surged to $93,434.36, setting a new ATH.

Due to the bullish sentiment in the crypto market, Ripple (XRP) jumped as high as $0.8800 on November 15 before stabilizing at around $0.8715. This XRP price means the altcoin has surged 56% over the past week. 

While the XRP price has maintained a green weekly chart, Ripple investors seek high-potential tokens to diversify their portfolios. This is because the Ripple Labs vs. SEC legal battle continues casting a massive cloud on the long-term performance of the XRP price. 

RCO Finance Gains Investor Confidence With Its AI And Blockchain Solutions

With Ripple investors uncertain about the long-term performance of the XRP price, RCO Finance has emerged as a leading portfolio diversification platform. RCO Finance has taken center stage as a DeFi platform because it runs on AI and blockchain-powered architecture. 

This next-gen architecture enables RCO Finance to offer investors state-of-the-art trading tools. One RCO Finance tool, in particular, has caught investor attention. It is an AI-powered robo advisor that uses machine learning and algorithms to offer investors custom investment recommendations. 

Through these recommendations, investors can tell which assets to buy to meet their financial goals. The robo advisor can also trade automatically, entering or exiting positions based on their risk tolerance. As such, investors get a mix of high profitability and reduced risk exposure. 

This investment approach helps investors avoid letting emotions and guesswork prevent lucrative investing. Eliminating emotions and guesswork is crucial because RCO Finance supports 120,000 assets. These include crypto, tokenized real-world assets (RWAs) like commodities, and decentralized derivatives. 

These trailblazing features explain why Ripple investors are rushing to buy RCOF, RCO Finance’s native token. 

RCOF Wins Over Investors With Amazing Tokenomics Model

RCOF has attracted Ripple investors despite the XRP price surging because it has a solid tokenomics model. Specifically, RCOF’s supply ceiling is 800 million tokens. Additionally, RCOF has an efficient deflationary tool, which burns tokens in circulation, further shrinking the supply. 

It is also worth pointing out that RCOF’s smart contract was audited. The firm behind the audit verified that the token met industry safety standards. SolidProof, a leading blockchain security company based in Germany, conducted this audit. 

RCOF Promises Humongous Presale ROIs

Apart from the above features, RCOF is stealing the show because it has the potential to outshine the XRP price during its presale. As of November 15, RCOF had entered Stage 3 of its presale at $0.0558. The next RCOF price is $0.0778 during Stage 4. After this, RCOF will go through the Bonus Round before launching at $0.4-$0.6. 

By surging to $0.4-$0.6, RCOF will have generated massive ROIs for Stage 3 investors. Moreover, experts believe RCOF will surge 82,102% by Q1 2025, outshining XRP’s 60,000% surge in 2017. This explains why you should join RCOF’s high-potential presale now. 

For more information about the RCO Finance Presale:

Visit RCO Finance Presale

Join The RCO Finance Community

✓ Share:

Disclaimer
This article is a paid publication and does not have journalistic/ editorial involvement of CoinGape. CoinGape does not endorse/ subscribe to the contents of the article/advertisement and/or views expressed herein. Do your market research before taking any actions . The author or the publication does not hold any responsibility for your personal financial loss.


Source link

18 11, 2024

Do anti-ageing NAD supplements really work? Here’s what the expert has to say |

By |2024-11-18T00:20:09+02:00November 18, 2024|Dietary Supplements News, News|0 Comments


NAD supplements are flying off the shelves, thanks to influencers and podcasters endorsing them, claiming that they can turn back the clock on ageing. Mankind’s obsession with maintaining youthfulness and longevity is never going out of style, and nor is the emergence of anti-ageing treatments. NAD is the supplement that is going viral amongst the elites across the globe. Preliminary studies are promising, but does it really work?

What is NAD supplement?

Do anti-ageing NAD supplements really work? Here’s what the expert has to say |

NAD is an acronym for nicotinamide adenine dinucleotide, a compound found naturally in our body’s cells that is crucial in energy metabolism. The levels of this coenzyme decrease naturally over time. It starts to dip by nearly 50 percent once the individual enters their 40s.
NAD+ can, directly and indirectly, influence many key cellular functions, including metabolic pathways, DNA repair, chromatin remodeling, cellular senescence, and immune cell function. NAD are now available as a dietary supplement because of its anti-ageing properties.

Does the supplement really work?

Do anti-ageing NAD supplements really work? Here’s what the expert has to say |

Dr. Sarah Espinoza, director of Translational Geroscience at Cedars-Sinai, who has been studying NAD, told ABC7 that the levels of this co-enzyme go down with age, and is associated with age-related diseases. These age-related ailments include dementia, diabetes, and vascular disease. She stated that there are no major adverse effects of taking the supplement for a relatively short period of time, for instance a few weeks. And the supplements do increase NAD levels in the cells in the blood.

Do anti-ageing NAD supplements really work? Here’s what the expert has to say |

The study also found out that though the NAD levels came up, they didn’t find any significant benefit in terms of a cognitive boost. Though some animal studies suggest that NAD boosting can improve mitochondrial function, insulin regulation, and cognition, they are yet to be proven in human studies. Some of the side effects of the supplement may include headaches, fatigue, nausea, and indigestion.

As NAD is a relatively new supplement in the market, she states that at the moment it is not recommended based on the currently available findings. NAD supplements are taken intravenously and as injectable. So far, most research has focused on oral NAD supplements, but the demand for expensive

NAD intravenous infusions and injectables is on the rise. According to Espinoza, there is no evidence that these methods offer any additional benefits compared to the pills. Currently, NAD supplements range anywhere between $20 to $150 per month depending on the brand and dosage.
(Pic courtesy: Pexels)


Source link

17 11, 2024

Dogecoin Price Prediction: Bi-Monthly RSI Rises To 2020 Levels, Analyst Reveals What’s Next

By |2024-11-17T23:58:39+02:00November 17, 2024|Crypto News, News|0 Comments

Analyst Trader Tardigrade revealed that the Dogecoin price bi-monthly has reached 2020 levels while the demand for ETFSwap (ETFS) shows it could rally significantly.

The Dogecoin price currently boasts a bullish outlook, considering how much it has surged these past few weeks. This Dogecoin price rally looks likely to continue as analyst Trader Tardigrade revealed that DOGE’s RSI (Relative Strength Index) has risen to levels recorded in 2020. Meanwhile, the ETFSwap (ETFS) token is enjoying a lot of demand, which could cause its price to surge massively.

What Next For Dogecoin Price Following RSI Surge

In an X post, analyst Trader Tardigrade revealed that the next three candles for the Dogecoin price will be huge as DOGE’s bi-monthly RSI has risen to levels last seen in 2020. Back then, the Dogecoin price RSI reached this level right before the massive bull run. That eventually paved the way for the Dogecoin price to reach its current all-time high (ATH).

The analyst’s accompanying chart showed that something similar will likely play out this time around for the Dogecoin price, which could reach a new ATH. Interestingly, the analyst’s chart showed that the Dogecoin price could rise to $44. A Dogecoin price rally to $44 represents a 14,567% increase from its current price.

Demand For ETFSwap (ETFS) Indicates Imminent Price Rally

The demand for the ETFSwap (ETFS) token indicates that it could enjoy a massive rally as soon as it launches. Investors have bought millions of tokens in its ongoing presale, providing a bullish outlook for the crypto. This demand for ETFS is thanks to its incredible utility, which positions it as a potential top gainer in this market cycle.

ETFSwap (ETFS) is the native token of the ETFSwap platform, which will offer tokenized exchange-traded funds (ETFs). Investors will be able to access these tokenized ETFs using ETFs, which they will swap for their desired asset. The decentralized finance (DeFi) platform is expected to become the go-to platform for trading these ETFs, another reason why the ETFS token can rally significantly.

The ETFSwap (ETFS) platform will have the edge over centralized trading platforms for several reasons. For instance, the DeFi platform’s Know-Your-Customer (KYC) requirements are non-mandatory, which enables investors to start investing quickly. The platform’s decentralized nature means that investors will now be able to trade these ETFs from anywhere in the world.

Furthermore, ETFSwap will allow investors to trade anonymously as zero-knowledge (ZK) proof technology will be integrated into the platform. These investors will also enjoy 24/7 market coverage and will be able to buy, sell, and trade these ETFs anytime, even after the traditional trading hours.

This will enable investors to benefit from the market gains these ETFs record after trading hours. Investors will enjoy ample liquidity thanks to ETFSwap’s (ETFS) market-making services and can settle their trades instantly with minimal slippage. It is worth mentioning that the DeFi platform is built on Ethereum, so investors will also have access to the network’s unparalleled liquidity.

The ETFSwap (ETFS) platform also stands out from centralized trading platforms with its ETF perpetuals feature. The platform offers derivative contracts that allow investors to bet on the future prices of these traditional assets without expiration. Traders can use up to a 50x margin on their initial position when shorting or longing these assets.

ETFSwap’s (ETFS) artificial intelligence (AI) powered tools provide investors and traders with the much-needed assistance to execute more successful trades. These tools analyze several market data and recommend the best ETFs to invest in. This will enable investors to maximize their profits in this bull run.

Conclusion

ETFSwap (ETFS) will gain much attention as investors look to access these offerings on the DeFi platform. This development will ultimately lead to significant price rallies for the ETFSwap token. You can easily position yourself for these price rallies by buying some of the remaining tokens in the ETFSwap presale at an affordable price of $0.05769 before the bonus round ends.

For More Information On ETFSwap and its presale:

Visit ETFSwap Presale
Join The ETFSwap Community


This is a sponsored article. Opinions expressed are solely those of the sponsor and readers should conduct their own due diligence before taking any action based on information presented in this article

Source link

17 11, 2024

Weekly Forex Forecast – 17/11: EUR/USD, GBP/USD (Charts)

By |2024-11-17T21:59:07+02:00November 17, 2024|Forex News, News|0 Comments

(MENAFN– Daily Forex) Fundamental Analysis & market Sentiment

I wrote on 10th November that the best trade opportunities for the week were likely to be:

  • Long of bitcoin in USD terms. Bitcoin has risen by 12.55% over the past week.

  • Long of the S&P 500 index . The Index fell by 2.30% over the past week.

  • Long of the nasdaq 100 Index . The Index fell by 3.51% over the past week.

The weekly gain of 6.74% equals 2.25% per asset.Last week’s key takeaways were:

  • US CPI (inflation) – all the inflation metrics were exactly as forecasted, and the annualized rate rose to 2.6% .

  • US PPI – as expected, reinforcing no news on inflation.

  • US Retail Sales – slightly stronger than expected, at a month-on-month increase of 0.4% compared to the forecasted 0.3%. This may increase the chance of a rate hike by the Fed at its December policy meeting.

  • UK GDP – considerably worse than expected, showing a month-on-month contraction of 0.1% when an increase of 0.2% was expected. This increases the chance of a rate cut and has helped make the Pound the weakest of all major currencies right now.

  • Australian Wage Price Index – a fraction lower than expected at a quarterly increase of 0.8%. In a very small way, this may increase the case for a further rate cut.

  • New Zealand Inflation Expectations = 2.12%.

  • UK Claimant Count Change (Unemployment Claims) – more or less as expected.

  • Australian Unemployment Rate – as expected at 4.1%.Last week, the most important factors driving the market were not so much economic data but a growing digestion of what the Trump / Republican victory in the USA will mean economically and for markets generally. The strong slump in stock markets towards the end of the week, especially in the USA, should be cause for concern, as the major indices have almost retreated back to where they were when news of Trump’s victory began to emerge Week Ahead: 18th – 22nd NovemberThe coming week’s schedule is lighter, with the most important scheduled events likely to be inflation data releases in the UK and Canada.

  • UK CPI (inflation)

  • Canada CPI (inflation)

  • UK Monetary Policy Report Hearings

  • US Unemployment Claims

  • UK Retail Sales

  • Canada Retail Sales

  • US, German, UK, French Services & Manufacturing PMIMonthly Forecast November 2024 I made no monthly forecast for November, as the long-term trends in the Forex market were too unclear Forecast 17th November 2024I made no weekly forecast this week, as there were no unusually strong directional price movements over the past week, which is the basis of my weekly trading strategy.Last week, the US Dollar was the strongest major currency, while the British Pound was the weakest. One third of the most important Forex currency pairs and crosses changed in value by over 1%.You can trade these forecasts in a real or demo Forex brokerage account .Key Support/Resistance Levels for Popular Pairs Top Forex Brokers1 Get Started 74% of retail CFD accounts lose money Technical AnalysisUS Dollar IndexLast week, the US Dollar Index printed a large bullish candlestick that broke out beyond the resistance level at 105.81, as well as the upper trend line of the formerly dominant consolidating triangle chart pattern , which can be seen in the price chart below. These are bullish signs, but it should be noted that the candlestick has a large upper wick, showing that the Dollar struggled to hold some of its earlier gains as it consolidated towards the end of last week.The price is now above its levels from both three months ago and six months ago, suggesting a long-term bullish trend in the greenback, which should be exploitable.The strong US Dollar is supported by the expectation that the new Trump / Republican control of the executive and legislature in the USA will lead to a more hawkish monetary policy. This has been evidenced by the strong increase in US Treasury Yields over recent weeks.I have plenty of technical and fundamental reasons to be bullish on the US Dollar. The only bearish note comes from the price not clearing the 1-year+ high at 107.00, which was previously a major bearish inflection point, so I would be more bullish above 107.00 if the price gets established up there.
    EUR/USDLast week, the EUR/USD currency pair printed a relatively large bearish candlestick, which made the lowest weekly close seen in one year. The weekly candlestick closed not far from its low, although there is enough of a lower wick on the candlestick for it to be worth noting. The price is below its levels from both 3 and 6 months ago, which is my preferred metric for calling a long-term bearish trend. The US Dollar Index is also in a long-term bearish trend. A final bearish signal is that the 50-day moving average has crossed below the 100-day moving average, which validates the trend.So, there are plenty of reasons to go short here, but I remain concerned that the price area being reached was a bullish inflection point when it was last tested, around the $1.0500 area, and there may still be demand here. This concern is strengthened by the fact that for almost 2 years, the price has ranged approximately between $1.0500 and $1.1250.The best approach here is to look for short swing trades from retests and rejections of resistance levels above the current price. GBP/USDLast week, the GBP/USD currency pair printed a large bearish candlestick, making the lowest weekly close seen in 6 months. It was the largest bearish candlestick range in several months, suggesting strong bearish momentum. The weekly candlestick closed near its low, and the British Pound was the weakest of all major currencies last week. The price is below its levels from both 3 and 6 months ago, which is my preferred metric for calling a long-term bearish trend. The US Dollar Index is also in a long-term bearish trend.There are several bearish technical signs. Turning to fundamentals, one of the reasons the Pound is weak is that the Bank of England may be forced to cut rates more quickly after last week’s very poor UK GDP data, which showed a contraction of economic activity over the month. The weakening British economy may require a faster rate cut, which will help sink the Pound.The US Dollar also remained strong following the Republican victory in the US general election, so the price could continue falling for several reasons. However, I don’t want to be short here until the trend is established for longer – I like to see the 50-day moving average below the 100-day moving average before going short. Day traders may be interested in this pair on the short side. USD/JPYThe USD/JPY currency pair gained last week in line with the general rise in the US Dollar but gave up most of its gains by the end of the week, as can be seen by the large upper wick on the most recent weekly candlestick shown within the price chart below.The moving average positions still need to be fully bullish for the long term, so I do not see this pair as fully trending. Additionally, the price is above its level of 3 months ago but still needs to reach its level of 6 months ago, reinforcing the lack of true trend. European currencies like the Euro are considerably weaker than the Yen.So, although there are reasons not to trade this pair for trend or momentum, what it does have – in conjunction with almost all the Yen crosses – is a high level of volatility, making this an interesting currency pair for Forex day traders to focus on. USD/CADThe USD/CAD currency pair made a strong gain last week, as it made a bullish breakout to a new 4-year high price, which is a significant long-term high price.The weekly close was located quite near the top of the weekly range, which is another bullish sign.The technical picture could hardly be more bullish and is supported by the fundamental picture, which sees a strong US Dollar boosted by the upcoming Trump presidency and Republican Congress, and also a weak Canadian Dollar, which is being driven lower by the global decline in the price of crude oil – WTI Crude Oil closed last week at its lowest weekly closing price in 18 months.There are many reasons to think about going long here, but remember that this currency pair typically trends little as the American and Canadian economies are so intertwined. However, there are periods in which this is not true. As we have seen some divergence between the Federal Reserve and the Bank of Canada on monetary policy in recent months, this may be such a period now. BitcoinBitcoin saw another week of extraordinary gains as it powered to new all-time highs, topping to date above $93,000. The price rose by more than 10% over the week.There is no reason not to be bullish except that the price is now not far from the huge six-figure round number at $100,000. If the price arrives at, or very close to, that point, we will likely see massive profit taking as there will be a 25% gain within just a few weeks, an enormous rise in value for any asset. So, this leg of the bull run, or maybe this whole trend, maybe does not have much further to run.Bitcoin received a significant boost from the election victories of President Trump and Congressional Republicans in both Houses. Republicans are seen as more likely to favour lighter regulation of cryptocurrency, so their ascendancy has boosted both crypto in particular and risk sentiment in general, which also helps a risky asset like Bitcoin.I think it is smart to be long of Bitcoin, just be mindful of $100,000 as a potentially strong barrier. With such momentum and strong gains, a trend or momentum trader should be interested.Note that Bitcoin ETFs are not getting the full gain made by the underlying, not in some way, so if you can afford it, you might want to buy Bitcoin futures instead of a Bitcoin ETF or even spot Bitcoin. There are Bitcoin micro futures available on the CME, which are only sized at 10% of the value of one Bitcoin. NASDAQ 100 IndexThe NASDAQ 100 Index fell last week, especially on Friday, when it made its strongest daily fall since September. The daily chart below shows that after making a new record high recently following the Trump/Republican victory in the US election, the price printed classing topping price action triggered the big drop at the end of the week.The price is now almost where it was when it became clear Trump had won the Presidency, which is an ominous sign for the market. It was expected Trump would boost stocks quite strongly, but if the price falls just a bit further, we will be in negative Trump territory.There is a long-term bullish trend here, so there are still plenty of reasons to expect the price to turn bullish again.The price is now approaching a critical technical area just below the big round number at 20,000 – there is a confluence here of an obvious horizontal area of support and the lower trend line of the linear regression channel, which I have drawn to cover the recent bullish leg of the price action. If the price continues to fall and gets established below 19,800, it might quickly fall considerably.I do not see the NASDAQ 100 Index as a buy for now, especially below 19,800. Bottom LineI see the best trading opportunities this week as

    • Long of Bitcoin in USD terms.

    • Short of the EUR/USD currency pair.

    Ready to trade our weekly Forex analysis ? Check out our list of the best Forex brokers worth checking out.

    MENAFN17112024000131011023ID1108894781

    Source link

    17 11, 2024

    Cardano Price Prediction: ADA Gains Momentum but Slowly as this Altcoin Competitor Eyes 8280x Run

    By |2024-11-17T21:57:52+02:00November 17, 2024|Crypto News, News|0 Comments

    As the crypto market continues pumping, the Cardano price has grown explosively. To this end, investors seek fresh tokens with similar growth trajectories. 

    This explains why RCO Finance (RCOF), an upcoming DeFi token, has taken the crypto market by storm after securing over $5 million during its presale. 

    Which token is poised to deliver better returns, Cardano (ADA) or RCO Finance (RCOF)? Let’s find out!

    Cardano Price Surges 49% in a Week: More Growth Coming?

    Cardano has performed exceptionally well over the past week. On November 8, the Cardano price was hovering around $0.4397. After holding this level for two days, ADA shot up on November 10. 

    This surge came after ADA mirrored the price movement of Bitcoin (BTC), which soared past $80,000 for the first time.

    The resulting uptrend saw the Cardano price jump as high as $0.6800 on November 15 before stabilizing at around $0.6578. This price means Cardano (ADA) has jumped 49% in a week. This makes ADA the second best-performing altcoin in the top 10, with Dogecoin (DOGE) taking the lead. 

    While this impressive ADA performance has caught investor attention, the Cardano price has only spiked because of the current bullish sentiment in the crypto market. To this end, the Cardano price is susceptible to a speculative trader-driven price correction. 

    RCO Finance Attracts Investors With Its Revolutionary Crypto AI Platform

    As the Cardano price continues climbing, traders are looking for top-tier platforms that can help capitalize on the current bull run. Meanwhile, RCO Finance, an upcoming DeFi platform, has witnessed an influx of investors due to its game-changing blockchain and crypto AI features.

    Specifically, investors are flocking to RCO Finance because of its AI-powered robo advisor. The RCO Finance robo advisor has captivated investors because it uses machine learning and advanced algorithms to analyze market data and offer investors actionable investment recommendations. 

    This means investors can decide when to open or close specific positions, increasing profitability and reducing risk exposure. Moreover, the robo advisor can trade automatically, executing transactions on assets that match an investor’s preferences early. 

    In addition, RCO Finance supports over 120,000 assets across 12,500+ classes. The supported classes include crypto, tokenized real-world assets (RWAs) like real estate, and decentralized derivatives. As such, the robo advisor has many assets to diversify investor portfolios. 

    RCOF Becomes 2024’s Top ICO

    Although the Cardano price has impressed traders, RCOF has remained their preferred investment. RCOF has won over investors because of its safety. It is worth pointing out that SolidProof, a leader in blockchain security, carefully audited RCOF’s smart contract and verified that the token is a safe investment. 

    Additionally, RCOF has reeled in investors because its presale has rapidly progressed. As of November 15, RCOF had secured over $5 million in funding, making it one of the fastest-growing ICOs in 2024. 

    Impressive Growth Incoming

    Investors can now buy RCOF at $0.0558. RCOF’s Stage 3 price offers investors an appealing entry point. Investors purchasing RCOF at $0.0558 reap massive returns when this DeFi token enters Stage 4 at $0.0778. Moreover, more gains are coming as RCOF launches at $0.4-$0.6.

    Astonishingly, experts expect RCOF to surge 8,280x by Q1 2025, surpassing Cardano’s 1,500% surge in 2021. This projected growth explains why you should pick RCOF despite the double-digit Cardano price gains. 

    For more information about the RCO Finance Presale:
    Visit RCO Finance Presale
    Join The RCO Finance Community

    Source link

    17 11, 2024

    Here is How Much 1 XRP Will be Worth if Its Market Cap Reaches $350B

    By |2024-11-17T19:56:06+02:00November 17, 2024|Crypto News, News|0 Comments

    The price of 1 XRP could explode by more than 759% if XRP’s market cap reached the $350 billion mark. 

    XRP has been one of the biggest beneficiaries of the ongoing market upsurge as Bitcoin broke $90,000. Amid the prevalent market push, XRP recently reclaimed the $1 price mark.

    XRP Joins Market Rally

    This rally allowed XRP to cross the $60.9 billion market cap, its highest valuation since July 2021. As the upsurge persists, discussions around a price increase to lofty targets have resurfaced. For instance, earlier this month, market analyst EGRAG suggested that XRP could hit $17, leveraging a “bent fork” formation.

    Another market watcher, Steph, charged investors to procure XRP tokens before the altcoin claims a new peak of $14. While targets of a $4 price or a $6 value are logically attainable, some have doubted the feasibility of higher goals such as $14 and $17. 

    These skeptics point to the market cap that could result from such ambitious targets. For the valuations from these audacious goals to materialize, the XRP market would need to welcome a substantial amount of capital. 

    XRP Price at a $350B Market Cap

    Throughout its decade-old journey, XRP has not clinched the coveted $100 billion valuation mark. The altcoin’s peak market cap was $95.5 billion, attained when its price spiked to an all-time high of $3.3 in January 2018. XRP has since dropped from this mark, struggling to maintain the $30 region this year.

    However, we recently assessed how much XRP would need to rally to claim a $350 billion market cap, roughly the size of Ethereum’s valuation before the latest uptrend. Such a market cap would mark a new territory for XRP, possibly buoyed by a flood of new capital.

    Currently, XRP has a circulating supply of 56.8 billion tokens, a jump from previous figures due to the periodic escrow releases from Ripple’s accounts. At the current circulating supply, the value of 1 XRP would need to rise by 759% to $6.15 for XRP to claim a $350 billion market cap.

    Both the $6 price mark and the $350 billion valuation are within reach for XRP. Some factors that could catalyze a run to these levels include the forthcoming XRP ETFs and launch of Ripple Stable coin (RLUSD) on XRP ledger.

    DisClamier: This content is informational and should not be considered financial advice. The views expressed in this article may include the author’s personal opinions and do not reflect The Crypto Basic opinion. Readers are encouraged to do thorough research before making any investment decisions. The Crypto Basic is not responsible for any financial losses.

    Source link

    17 11, 2024

    Pound US Dollar (GBP/USD) Exchange Rate Slides as Republicans Gain Control of Congress

    By |2024-11-17T17:56:16+02:00November 17, 2024|Forex News, News|0 Comments

    November 17, 2024 – Written by Frank Davies

    The Pound to US Dollar (GBP/USD) exchange rate dropped to a new multi-month low on Thursday as investor demand for the USD remained strong.

    At the time of writing, GBP/USD was trading around $1.2644, down approximately 0.5% from Thursday’s opening levels.

    The US Dollar (USD) climbed on Thursday, continuing its upward trend following Donald Trump’s election win.

    The recent boost in USD came as Republicans secured a majority in the House of Representatives, granting the party control of all branches of the US government.

    With Trump now poised to advance his economic policies more easily, USD exchange rates rose as investors anticipate his tax cuts and tariffs may fuel inflation, potentially leading the Federal Reserve to keep US interest rates elevated for longer.

    The Pound (GBP) struggled to gain traction against the US Dollar on Thursday, as GBP investors remained cautious ahead of a speech from Bank of England (BoE) Governor Andrew Bailey.

    Bailey’s comments will follow recent remarks by BoE official Catherine Mann, who discussed the risks of rising inflation in the UK and suggested rates might need to remain high.

    Advertisement


    If Bailey echoes this sentiment, it could dampen market expectations of a BoE rate cut in December and help the GBP/USD exchange rate recover from its current lows.

    GBP/USD Forecast: Slowing UK GDP to Pressure the Pound?

    Looking toward the end of the week, the Pound to US Dollar (GBP/USD) exchange rate may face further headwinds with the release of the UK’s latest GDP figures.

    Preliminary data for the third quarter is expected to show that UK economic growth slowed from 0.5% to just 0.2%, raising concerns about the country’s economic outlook and likely weighing on Sterling.

    Meanwhile, the release of US retail sales data could limit the US Dollar’s recent gains if the figures indicate a slowdown in consumer spending last month.

    Like this piece? Please share with your friends and colleagues:


    International Money Transfer? Ask our resident FX expert a money transfer question or try John’s new, free, no-obligation personal service! ,where he helps every step of the way,
    ensuring you get the best exchange rates on your currency requirements.

    TAGS: Pound Dollar Forecasts

    Source link

    Go to Top