- The antioxidants in green tea support healthy blood pressure by helping blood vessels relax.
- In the longer term, green tea may help protect your arteries by reducing oxidative stress and inflammation.
- Choose regular or decaf brewed green tea over supplements or extracts for blood-pressure benefits.
High blood pressure, or hypertension, affects nearly half of U.S. adults and increases the risk for heart disease and stroke. Blood pressure is an important indicator of metabolic health and healthy blood pressure is less than 120/80 mm Hg. The top number (systolic) measures pressure when your heart beats, while the bottom (diastolic) measures it between beats.
While lifestyle and medications play the biggest roles in managing it, small daily habits—like sipping green tea—may also have an impact. We spoke with nutrition experts to find out how drinking green tea affects your blood pressure and who should avoid it, plus tips to add it to your routine.
How Green Tea Affects Blood Pressure
May Relax Blood Vessels and Improve Circulation
Much of green tea’s heart-healthy blood pressure benefits come from antioxidant compounds called catechins—these polyphenols help blood vessels stay flexible and open. “One compound in particular, epigallocatechin gallate (EGCG), boosts nitric oxide and promotes vasodilation, helping your blood vessels relax,” says Bess Berger, RDN. When your blood vessels relax, or vasodilate, your blood pressure lowers—a short-term effect that supports smoother circulation.
“While catechins are one type of tea polyphenol, the blood pressure–lowering effects of green tea are probably attributable to a combination of all of the plant compounds it contains instead of an individual few,” adds Qianzhi Jiang, Ph.D., RDN.
Though some research suggests that green tea may lower blood pressure in both healthy individuals and those with hypertension, the results are inconsistent, and further long-term studies are needed to confirm these findings.
Helps Protect Arteries from Long-Term Damage
While green tea may help blood vessels relax in the moment, its bigger advantage may come from how it protects them over time. The same polyphenols that give green tea its antioxidant strength appear to guard arteries against oxidative stress and low-grade inflammation—two drivers of the slow, silent damage that can increase blood pressure with age.
“Green tea’s catechins support blood vessel health by reducing inflammation and improving how your vessels function,” says Devon Golem, Ph.D., RD, LDN. Over time, that can translate to more supple arteries that expand and contract more easily, helping your heart pump blood efficiently.
The result isn’t an overnight change in blood pressure but a gradual, protective effect that keeps arteries healthy and resilient in the long run.
Caffeine Can Temporarily Raise Blood Pressure
Although green tea generally has less caffeine than coffee—about 30 milligrams of caffeine in an 8-ounce cup of green tea versus 95 mg in the same serving of coffee—it’s still a stimulant that can cause a short-term increase in blood pressure. “If you’re super-sensitive to caffeine, green tea could cause a temporary bump in blood pressure right after drinking it,” says Berger. This effect typically fades within a few hours as your body metabolizes the caffeine.
For most people, this short-term spike doesn’t cancel out green tea’s long-term cardiovascular benefits. Research suggests that the long-term benefits of drinking green tea likely outweigh the short-term effect caffeine may have on blood pressure.
If you’re prone to caffeine jitters, switching to decaf green tea can be a good option. You’ll still get many of the same beneficial antioxidants, as one review compared caffeinated and decaffeinated green tea extract supplements and found no difference in blood pressure effects.
How Much Green Tea Should You Drink Daily?
There’s no official guideline for how much green tea to drink for blood pressure benefits. “The majority of the studies used three to four cups of green tea daily, and greater reductions in blood pressure were observed with longer use—more than three months,” explains Jiang.
Brewing matters, too. Jiang says that most of green tea’s polyphenols are released within the first five minutes of steeping, so letting your tea sit for a few minutes can help you get the most benefit from each cup.
“Overconsumption is very rare from green tea beverages,” says Jiang. However, green tea extracts may lead to side effects, including nausea, abdominal discomfort and increased blood pressure. Experts agree: It’s better to drink green tea than to take supplements that contain green tea extracts.
How Green Tea Interacts with Blood Pressure Medications
While brewed tea in moderate amounts is generally safe, concentrated green tea extracts can interfere with how certain drugs are absorbed or metabolized. Studies show that green tea can reduce the effectiveness of certain blood pressure medications, including the beta-blocker nadolol. It may also interfere with other heart or cholesterol drugs when taken at the same time. These effects are more likely with high intakes or green tea extracts, but brewed tea can still play a role.
If you take medication for blood pressure or cholesterol, it’s worth checking with your health care provider to make sure that green tea fits safely into your routine.
Is Green Tea Safe for Everyone?
For most people, a few cups of green tea a day are perfectly safe—and even beneficial—but there are some exceptions. “Caffeine can negatively affect pregnant and breastfeeding women, children and individuals with anxiety, irregular heartbeats, seizures, sleep issues and irritable bowel syndrome,” says Golem.
If you’re pregnant or breastfeeding, keep total caffeine intake under 200 mg per day (about two cups of green tea, depending on strength), or follow your health care provider’s guidance.
People who prefer to limit their caffeine intake can still benefit from drinking decaf green tea, which contains many of the same antioxidants but with less caffeine. While it’s uncommon, concentrated green tea extracts have been linked to liver issues in sensitive individuals, so sticking to brewed tea is the safest way to enjoy its benefits.
Ways to Enjoy Green Tea
- Try It Iced: Brew a few cups ahead and chill them for a refreshing afternoon drink. Add a squeeze of lemon to boost flavor and add some vitamin C.
- Go for Matcha: This powdered form of green tea offers a concentrated source of antioxidants and a mild caffeine lift. Whisk it into hot water for a traditional preparation, or use it in desserts—think cakes, cookies and pudding.
- Skip the Sugar: Opt for unsweetened tea to maximize health benefits. If you prefer a sweeter beverage, try a drizzle of honey or sweetener of your choice.
- Infuse It with Flavor: Steep your tea with fresh herbs like mint or basil, or add slices of ginger or orange for a fragrant, spa-like spin.
- Get Creative in the Kitchen: Green tea can also be used in cooking. Jiang notes that in Japan, green tea is sometimes poured over rice and topped with salmon and scallions—a simple dish called ochazuke that adds subtle flavor and antioxidants to your meal.
Our Expert Take
Green tea isn’t a magic fix for high blood pressure, but it can play a small role in supporting heart health—especially when enjoyed regularly as part of a healthy lifestyle. Its polyphenols can help relax blood vessels in the short term and protect them from long-term damage caused by oxidative stress and inflammation.
Experts recommend getting your green tea from the cup, not a capsule. Brewed tea offers the ideal balance of beneficial compounds without the risks associated with concentrated extracts. A few cups a day—paired with other healthy habits like eating a balanced diet, staying active and managing stress—can help keep your blood pressure in a healthy range.
:max_bytes(150000):strip_icc()/Health-GettyImages-1140109435-92c4ff8c1152479db2c1651c02c986fb.jpg "7 Possible Side Effects of Creatine")
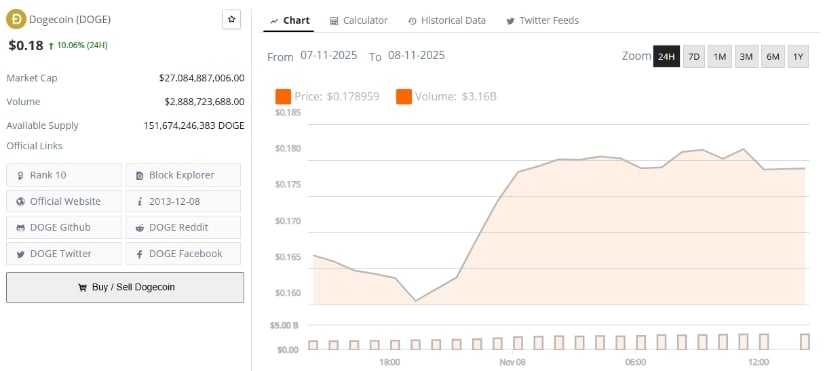
 Price Prediction: Can Dogecoin’s alt=")
:max_bytes(150000):strip_icc()/What-Happens-to-Your-Blood-Pressure-When-You-Drink-Green-Tea-d627f0b2e9484cd1a131060ecb672a39.jpg "What Happens to Your Blood Pressure When You Drink Green Tea")


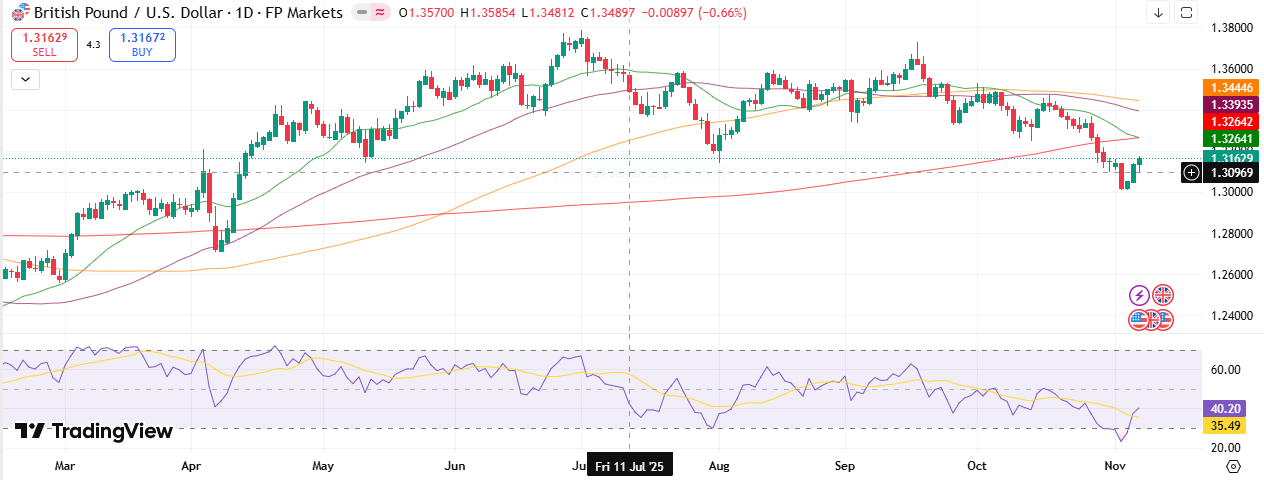
 – Forbes Health")