The main category of Dietary Supplements News Articles.
You can use the search box below to find what you need.
[wd_asp id=1]
The main category of Dietary Supplements News Articles.
You can use the search box below to find what you need.
[wd_asp id=1]
Researchers in India have found that a polyphenol-rich herbal supplement, combining pomegranate and marigold extracts, significantly improved healthy aging parameters in older adults, and in some instances outperformed a mainstay ingredient in the category.
Healthy aging and longevity clearly are hot topics in the supplement and nutraceutical industry. Supplement sales in the healthy aging category are expected to grow at a double-digit pace between now and 2028, according to Nutrition Business Journal analyst Erika Craft.
The study included both objective and subjective measurements, showing participants not only improved according to tests, but noticed a difference in how they felt after taking the supplement for 60 days.
Nicotinamide adenine dinucleotide (NAD+) is a molecule frequently mentioned in healthy aging discussions, as NAD+ levels decrease with age. This coenzyme is highly important at the cellular level, supporting DNA repair and energy metabolism.
NAD precursors are the largest ingredient category in the healthy aging supplement market. NBJ data show this category is likely to double between 2025 and 2028, said Craft.
Two ingredients used most frequently in supplements targeting NAD+ levels are nicotinamide riboside (NR) and nicotinamide mononucleotide (NMN), both of which are NAD+ precursors. NMN may sound familiar, as it was the subject of recent FDA scrutiny, but now it is reinstated as a dietary supplement.
“The market has been waiting for an NAD+ solution that goes beyond precursors alone,” said Eric Anderson, managing director at NXT USA and CEO of Blue Helix Health, via press release. NXT USA recently launched BluNADBooster, the herbal supplement evaluated in this clinical trial.
“BluNADBooster represents a next-generation approach — one that strengthens the body’s ability to generate and maintain healthy NAD+ levels while addressing the underlying mechanisms that cause NAD+ to decline with age,” he said. “This study confirms what we’ve believed for years: polyphenols matter, and they work in ways synthetic precursors cannot.”
The combination of pomegranate and marigold extracts studied in the clinical trial support healthy aging by boosting NAD+ levels and decreasing age-related depletion of NAD+. The results support the notion that this ingredient also improves cognitive function and physical health.
BluNADBooster is a combination of extracts from pomegranate (Punica granatum) and marigold (Tagetes erecta), standardized to at least 1.5% punicalagins and 4% quercetagetin.
Design: Randomized, double-blind, placebo-controlled trial.
Study size: 140 healthy, older adults with an average age of 60 years.
Dosage: 1,000 mg pomegranate and marigold extract blend (BluNADBooster), 500 mg nicotinamide riboside (NR), 1,000 mg BluNADBooster + 500 mg NR, or placebo.
Outcomes measured: Blood NAD+ levels were measured as well as CD38, an enzyme that “significantly (contributes) to the age-related depletion of NAD+,” according to the study authors. Various inflammatory biomarkers also were measured. Subjects underwent a 6-minute walk test, completed a mini-mental state examination and filled out quality-of-life surveys.
Participants in all treatment groups experienced significantly increased blood NAD+ levels after 60 days compared to baseline.
The increase was greater for BluNADBooster versus nicotinamide riboside, although this was not statistically significant. The combination of both ingredients led to a greater increase in NAD+ than either ingredient alone, but the difference was not statistically significant.
Participants receiving BluNADBooster alone for 60 days had significantly lower CD38 levels than at baseline or those receiving placebo. Subjects who received NR or the combination of actives did not experience significant decreases in CD38, indicating the ability of BluNADBooster not only to boost NAD+ levels but to decrease loss of NAD+ by inhibiting CD38 activity.
All actives significantly decreased tumor necrosis factor alpha and interleukin-6, both of which are proinflammatory cytokines, reducing inflammation in subjects.
Participants walked longer distances in the six-minute walk tests after 60 days of supplementation with all actives, alone or in combination. Similar results emerged with the mini-mental state examinations, indicating all actives improved cognitive performance. BluNADBooster combined with NR produced significantly higher scores than either ingredient alone.
All subjects receiving an active ingredient had improved quality-of-life scores by the end of the trial, indicating they felt a noticeable positive difference beyond what was observed in blood markers and physical tests.
The benefits of nicotinamide riboside and NMN supplementation have been well established in the literature. NAD+ boosters show promise in the treatment Alzheimer’s disease and modulating NAD+ metabolism may benefit immunity and inflammation regulation.
There may also be an opportunity to support NAD+ levels via the gut microbiome and to reduce the severity of age-related diseases.
However, there are few reports of herbal ingredients supporting NAD+ levels. Blue Helix was founded to find “clinically validated, nature-derived innovations” for longevity and metabolic wellness, according to the press release. Blue Helix Health and NXT USA screened 900 herbal extracts to find what they believe to be the optimal solution for boosting NAD+.
“This is comprehensive, multidimensional evidence — science layered on science — to ensure the formulation truly delivers,” Anderson said. “For the first time, we’re seeing a clinically validated botanical strategy that supports multiple hallmarks of aging — including mitochondrial efficiency, inflammation and cognitive resilience — within just 60 days.”
usatoday.com wants to ensure the best experience for all of our readers, so we built our site to take advantage of the latest technology, making it faster and easier to use.
Unfortunately, your browser is not supported. Please download one of these browsers for the best experience on usatoday.com
Comparative Study Examines Ingredient Composition, Manufacturing Processes, and Value Propositions
Relive Greens Advancements
Relive Greens Supplement Facts

Franklin, Tennessee, Dec. 11, 2025 (GLOBE NEWSWIRE) — A comprehensive analysis of three leading greens supplement products has identified substantial differences in ingredient sourcing, manufacturing methodologies, and nutritional approaches among Relive Greens from The ROOT Brands, AG1, and Bloom Nutrition Greens & Superfoods.
The analysis revealed that Relive Greens from The ROOT Brands utilizes a patented manufacturing process (U.S. Patent 12,058,998 B1) for ingredient purification and extraction-a technological approach not employed by AG1 or Bloom Nutrition.
Proprietary Technology and Patent Protection
The ROOT Brands’ proprietary formulation process is protected under U.S. Patent 12,058,998 B1 (issued August 13, 2024) for “Permeable and Semi-Permeable Substrate and Substance,” invented by Dr. Christina Rahm Cook. This patent covers specialized fractionation and extraction processes utilizing high-frequency pulse technology to isolate active compounds from minerals and nutrients.
The patented process involves treating ingredients with specific techniques to create “activatable protection formulas” using silicas, zeolites, and mineral compounds. This technology addresses molecular-level processing to enhance bioavailability and remove environmental contaminants before formulation-a process not disclosed in either AG1’s or Bloom Nutrition’s manufacturing specifications.
Formulation and Concentration Differences
Serving sizes vary significantly: Relive Greens from The ROOT Brands delivers its profile in 5.15 grams, AG1 requires 13 grams, and Bloom Nutrition uses 5.46 grams-representing a 2.5-fold concentration advantage for Relive Greens over AG1.
Fiber Blend Analysis:
Relive Greens from The ROOT Brands features psyllium husk powder, apple fiber, flaxseed, and green banana flour. The green banana flour provides resistant starch, a prebiotic supporting gut health and blood sugar regulation-not found in Bloom Nutrition’s fiber blend. Bloom contains chicory root fructo-oligosaccharides, organic flaxseed, and apple fruit powder, delivering 2 grams of dietary fiber per serving.
Green Superfood Diversity:
Relive Greens from The ROOT Brands includes broccoli, kale, spinach, green cabbage, barley grass, wheatgrass, spirulina, chlorella, parsley, and aloe vera-emphasizing cruciferous vegetables rich in phytonutrients. Bloom Nutrition’s 1.367-gram green superfood blend focuses on grass-based ingredients (organic barley grass, spirulina, wheat grass, alfalfa, chlorella).
Market Summary –
The global market for Matcha Tea was estimated to be worth US$ 360 million in 2024 and is forecast to a readjusted size of US$ 612 million by 2031 with a CAGR of 8.0% during the forecast period 2025-2031.
Accourding to QY Research has released a new publication titled “Global Matcha Tea Market Share and Ranking, Overall Sales and Demand Forecast 2025-2031.” This comprehensive study provides an in-depth evaluation of the worldwide Matcha Tea industry, uncovering the major forces influencing market growth and delivering high-value insights for investors, industry leaders, and strategic decision-makers. The report examines critical elements such as market dynamics, evolving technologies, segmentation trends, regional developments, and the competitive landscape. With data backed by rigorous research and expert interpretation, it offers an authoritative guide to understanding the macroeconomic and microeconomic factors reshaping the global market.
Get Full PDF Sample Copy of the Report: (Including Full TOC, Tables & Charts): https://qyresearch.in/request-sample/food-beverages-matcha-tea-market-share-and-ranking-overall-sales-and-demand-forecast-2025-2031
This report provides a comprehensive assessment of recent tariff adjustments and international strategic countermeasures on Matcha Tea cross-border industrial footprints, capital allocation patterns, regional economic interdependencies, and supply chain reconfigurations.
Matcha Tea originated in China and gained popularity in Japan. Japan defines matcha as tencha, which is produced by cultivating tea leaves under shade cover, drying them without rolling, and then grinding the resulting tencha into a fine powder known as matcha. In 2007, China established the national standard “Matcha” (GB/T 34778-2017), which stipulates that matcha is a powdered tea product made from shaded tea leaves that undergo steam (or hot air) fixation and drying, followed by a grinding process.
Due to the lack of mature legal regulations in the market, parameters vary widely, leading to a relatively chaotic market environment. However, it is now widely accepted that matcha must be produced from tea leaves shaded before harvesting to enhance amino acid content, resulting in a dried product with a distinctive seaweed-like aroma.
Market Drivers, Challenges & Restraints –
This section outlines the various elements influencing the trajectory of the Matcha Tea market:
Key Growth Drivers –
The growth of the matcha tea market is primarily driven by health-conscious consumption trends and diversified applications. As demand for functional foods and natural ingredients rises, matcha has gained popularity due to its rich antioxidants, polyphenols, and amino acids (e.g., L-theanine), positioning it as a staple in healthy beverages and superfoods. Additionally, innovative uses in the F&B industry (e.g., ice cream, baked goods, lattes) have expanded its consumption scenarios, appealing to younger demographics and global markets.
Going forward, the matcha tea market will see premiumization and globalization as key trends. On one hand, high-quality matcha (e.g., organic-certified, Japanese-origin) commands premium pricing due to its scarcity and distinctive flavor, fueling growth in premium tea drinks and artisanal foods. On the other hand, the global spread of Asian culinary culture is boosting matcha’s adoption in Western markets, spurring international brands to innovate and collaborate (e.g., matcha chocolates, cocktails), thereby pushing industry boundaries.
Restraints & Challenges –
– Regulatory uncertainties
– Competitive pricing pressures
– Operational risks
– Market-entry barriers
Market Segmentation and Regional –
By Type
Drinking-use Matcha Tea
Additive-use Matcha Tea
By Application
Food Additives
Beverage Additives
Others
Regional Analysis –
✔ North America (U.S., Canada, China)
✔ Europe (Germany, U.K., France, Italy, Russia, Spain, Rest of Europe)
✔ Asia-Pacific (Japan, South Korea, China Taiwan, Southeast Asia, India)
✔ Middle East, Africa, Latin America (Brazil, Mexico, Turkey, Israel, GCC Countries)
The analysis spans from 2024 (base year) to 2031 (forecast period).
Major Company Included: –
Guizhou Tongren Guitea
Aiya
Marushichi Seicha
Shaoxing Royal Tea Village
Zhejiang Hua’s Tea Industry
Marukyu Koyamaen
Yanoen
DoMatcha
Uji Matcha (Shanghai)
AOI Seicha
Ujinotsuyu Seicha
Zhejiang Tea
Horii Shichimeien
Shandong Hongyu agricultural science and Technology
Hubei banbingwei Tea Industry
Request for Pre-Order / Enquiry Link: https://qyresearch.in/pre-order-inquiry/food-beverages-matcha-tea-market-share-and-ranking-overall-sales-and-demand-forecast-2025-2031
Why should you purchase this report?
Purchasing this report provides you with a comprehensive and data-driven understanding of the market landscape, enabling informed business decisions and strategic planning. The report comes with free customization based on client requirements, including a country-level breakdown of any five countries of your choice and a competitive analysis of segment revenue by key market players. With detailed insights into market trends, growth drivers, challenges, competitive dynamics, and emerging opportunities, this report equips stakeholders, manufacturers, and investors with actionable intelligence to identify profitable prospects, optimize operations, and maintain a competitive edge in the industry.
How Can the Research Study Help your Business?
✔ The information presented in the Matcha Tea report helps your decision makers to become prudent and make the best business choices.
✔ The report enables you to see the future of the global Matcha Tea market and accordingly take decisions that will be in the best interest of your business.
✔ It offers you a forward-looking perspective of the global Matcha Tea market drivers and how you can secure significant market gains in the near future.
✔ It provides SWOT analysis of the global Matcha Tea market along with useful graphics and detailed statistics providing quick information about the market’s overall progress throughout the forecast period.
✔ It also assesses the changing competitive dynamics of the global Matcha Tea market using pin-point evaluation.
Key Questions Answered in the Report –
✔ What is the size and estimated growth rate of the global and regional Matcha Tea market?
✔ Which countries are expected to display the strongest growth?
✔ Which region will dominate the market throughout the forecast period?
✔ What are the main factors driving or restraining market expansion?
✔ What technological advancements are shaping future demand?
✔ Where are the key opportunities for new entrants and established players?
✔ Which companies currently hold the highest market share?
✔ How will market dynamics evolve from 2025 to 2031?
Table of Contents – Major Key Points:
1 Market Overview
1.1 Matcha Tea Product Introduction
1.2 Global Matcha Tea Market Size Forecast
1.2.1 Global Matcha Tea Sales Value (2020-2031)
1.2.2 Global Matcha Tea Sales Volume (2020-2031)
1.2.3 Global Matcha Tea Sales Price (2020-2031)
1.3 Matcha Tea Market Trends & Drivers
1.3.1 Matcha Tea Industry Trends
1.3.2 Matcha Tea Market Drivers & Opportunity
1.3.3 Matcha Tea Market Challenges
1.3.4 Matcha Tea Market Restraints
1.4 Assumptions and Limitations
1.5 Study Objectives
1.6 Years Considered
2 Competitive Analysis by Company
2.1 Global Matcha Tea Players Revenue Ranking (2024)
2.2 Global Matcha Tea Revenue by Company (2020-2025)
2.3 Global Matcha Tea Players Sales Volume Ranking (2024)
2.4 Global Matcha Tea Sales Volume by Company Players (2020-2025)
2.5 Global Matcha Tea Average Price by Company (2020-2025)
2.6 Key Manufacturers Matcha Tea Manufacturing Base and Headquarters
2.7 Key Manufacturers Matcha Tea Product Offered
2.8 Key Manufacturers Time to Begin Mass Production of Matcha Tea
2.9 Matcha Tea Market Competitive Analysis
2.9.1 Matcha Tea Market Concentration Rate (2020-2025)
2.9.2 Global 5 and 10 Largest Manufacturers by Matcha Tea Revenue in 2024
2.9.3 Global Top Manufacturers by Company Type (Tier 1, Tier 2, and Tier 3) & (based on the Revenue in Matcha Tea as of 2024)
2.10 Mergers & Acquisitions, Expansion
3 Segmentation by Type
3.1 Introduction by Type
3.1.1 Drinking-use Matcha Tea
3.1.2 Additive-use Matcha Tea
3.2 Global Matcha Tea Sales Value by Type
3.2.1 Global Matcha Tea Sales Value by Type (2020 VS 2024 VS 2031)
3.2.2 Global Matcha Tea Sales Value, by Type (2020-2031)
3.2.3 Global Matcha Tea Sales Value, by Type (%) (2020-2031)
3.3 Global Matcha Tea Sales Volume by Type
3.3.1 Global Matcha Tea Sales Volume by Type (2020 VS 2024 VS 2031)
3.3.2 Global Matcha Tea Sales Volume, by Type (2020-2031)
3.3.3 Global Matcha Tea Sales Volume, by Type (%) (2020-2031)
3.4 Global Matcha Tea Average Price by Type (2020-2031)
4 Segmentation by Application
4.1 Introduction by Application
4.1.1 Food Additives
4.1.2 Beverage Additives
4.1.3 Others
4.2 Global Matcha Tea Sales Value by Application
4.2.1 Global Matcha Tea Sales Value by Application (2020 VS 2024 VS 2031)
4.2.2 Global Matcha Tea Sales Value, by Application (2020-2031)
4.2.3 Global Matcha Tea Sales Value, by Application (%) (2020-2031)
4.3 Global Matcha Tea Sales Volume by Application
4.3.1 Global Matcha Tea Sales Volume by Application (2020 VS 2024 VS 2031)
4.3.2 Global Matcha Tea Sales Volume, by Application (2020-2031)
4.3.3 Global Matcha Tea Sales Volume, by Application (%) (2020-2031)
4.4 Global Matcha Tea Average Price by Application (2020-2031)
5 Segmentation by Region
5.1 Global Matcha Tea Sales Value by Region
5.1.1 Global Matcha Tea Sales Value by Region: 2020 VS 2024 VS 2031
5.1.2 Global Matcha Tea Sales Value by Region (2020-2025)
5.1.3 Global Matcha Tea Sales Value by Region (2026-2031)
5.1.4 Global Matcha Tea Sales Value by Region (%), (2020-2031)
5.2 Global Matcha Tea Sales Volume by Region
5.2.1 Global Matcha Tea Sales Volume by Region: 2020 VS 2024 VS 2031
5.2.2 Global Matcha Tea Sales Volume by Region (2020-2025)
5.2.3 Global Matcha Tea Sales Volume by Region (2026-2031)
5.2.4 Global Matcha Tea Sales Volume by Region (%), (2020-2031)
5.3 Global Matcha Tea Average Price by Region (2020-2031)
5.4 North America
5.4.1 North America Matcha Tea Sales Value, 2020-2031
5.4.2 North America Matcha Tea Sales Value by Country (%), 2024 VS 2031
5.5 Europe
5.5.1 Europe Matcha Tea Sales Value, 2020-2031
5.5.2 Europe Matcha Tea Sales Value by Country (%), 2024 VS 2031
5.6 Asia Pacific
5.6.1 Asia Pacific Matcha Tea Sales Value, 2020-2031
5.6.2 Asia Pacific Matcha Tea Sales Value by Region (%), 2024 VS 2031
5.7 South America
5.7.1 South America Matcha Tea Sales Value, 2020-2031
5.7.2 South America Matcha Tea Sales Value by Country (%), 2024 VS 2031
5.8 Middle East & Africa
5.8.1 Middle East & Africa Matcha Tea Sales Value, 2020-2031
5.8.2 Middle East & Africa Matcha Tea Sales Value by Country (%), 2024 VS 2031
6 Segmentation by Key Countries/Regions
6.1 Key Countries/Regions Matcha Tea Sales Value Growth Trends, 2020 VS 2024 VS 2031
6.2 Key Countries/Regions Matcha Tea Sales Value and Sales Volume
6.2.1 Key Countries/Regions Matcha Tea Sales Value, 2020-2031
6.2.2 Key Countries/Regions Matcha Tea Sales Volume, 2020-2031
6.3 United States
6.3.1 United States Matcha Tea Sales Value, 2020-2031
6.3.2 United States Matcha Tea Sales Value by Type (%), 2024 VS 2031
6.3.3 United States Matcha Tea Sales Value by Application, 2024 VS 2031
6.4 Europe
6.4.1 Europe Matcha Tea Sales Value, 2020-2031
6.4.2 Europe Matcha Tea Sales Value by Type (%), 2024 VS 2031
6.4.3 Europe Matcha Tea Sales Value by Application, 2024 VS 2031
6.5 China
6.5.1 China Matcha Tea Sales Value, 2020-2031
6.5.2 China Matcha Tea Sales Value by Type (%), 2024 VS 2031
6.5.3 China Matcha Tea Sales Value by Application, 2024 VS 2031
6.6 Japan
6.6.1 Japan Matcha Tea Sales Value, 2020-2031
6.6.2 Japan Matcha Tea Sales Value by Type (%), 2024 VS 2031
6.6.3 Japan Matcha Tea Sales Value by Application, 2024 VS 2031
6.7 South Korea
6.7.1 South Korea Matcha Tea Sales Value, 2020-2031
6.7.2 South Korea Matcha Tea Sales Value by Type (%), 2024 VS 2031
6.7.3 South Korea Matcha Tea Sales Value by Application, 2024 VS 2031
6.8 Southeast Asia
6.8.1 Southeast Asia Matcha Tea Sales Value, 2020-2031
6.8.2 Southeast Asia Matcha Tea Sales Value by Type (%), 2024 VS 2031
6.8.3 Southeast Asia Matcha Tea Sales Value by Application, 2024 VS 2031
6.9 India
6.9.1 India Matcha Tea Sales Value, 2020-2031
6.9.2 India Matcha Tea Sales Value by Type (%), 2024 VS 2031
6.9.3 India Matcha Tea Sales Value by Application, 2024 VS 2031
7 Company Profiles
7.1 Guizhou Tongren Guitea
7.1.1 Guizhou Tongren Guitea Company Information
7.1.2 Guizhou Tongren Guitea Introduction and Business Overview
7.1.3 Guizhou Tongren Guitea Matcha Tea Sales, Revenue, Price and Gross Margin (2020-2025)
7.1.4 Guizhou Tongren Guitea Matcha Tea Product Offerings
7.1.5 Guizhou Tongren Guitea Recent Development
7.2 Aiya
7.2.1 Aiya Company Information
7.2.2 Aiya Introduction and Business Overview
7.2.3 Aiya Matcha Tea Sales, Revenue, Price and Gross Margin (2020-2025)
7.2.4 Aiya Matcha Tea Product Offerings
7.2.5 Aiya Recent Development
7.3 Marushichi Seicha
7.3.1 Marushichi Seicha Company Information
7.3.2 Marushichi Seicha Introduction and Business Overview
7.3.3 Marushichi Seicha Matcha Tea Sales, Revenue, Price and Gross Margin (2020-2025)
7.3.4 Marushichi Seicha Matcha Tea Product Offerings
7.3.5 Marushichi Seicha Recent Development
7.4 Shaoxing Royal Tea Village
7.4.1 Shaoxing Royal Tea Village Company Information
7.4.2 Shaoxing Royal Tea Village Introduction and Business Overview
7.4.3 Shaoxing Royal Tea Village Matcha Tea Sales, Revenue, Price and Gross Margin (2020-2025)
7.4.4 Shaoxing Royal Tea Village Matcha Tea Product Offerings
7.4.5 Shaoxing Royal Tea Village Recent Development
7.5 Zhejiang Hua’s Tea Industry
7.5.1 Zhejiang Hua’s Tea Industry Company Information
7.5.2 Zhejiang Hua’s Tea Industry Introduction and Business Overview
7.5.3 Zhejiang Hua’s Tea Industry Matcha Tea Sales, Revenue, Price and Gross Margin (2020-2025)
7.5.4 Zhejiang Hua’s Tea Industry Matcha Tea Product Offerings
7.5.5 Zhejiang Hua’s Tea Industry Recent Development
7.6 Marukyu Koyamaen
7.6.1 Marukyu Koyamaen Company Information
7.6.2 Marukyu Koyamaen Introduction and Business Overview
7.6.3 Marukyu Koyamaen Matcha Tea Sales, Revenue, Price and Gross Margin (2020-2025)
7.6.4 Marukyu Koyamaen Matcha Tea Product Offerings
7.6.5 Marukyu Koyamaen Recent Development
7.7 Yanoen
7.7.1 Yanoen Company Information
7.7.2 Yanoen Introduction and Business Overview
7.7.3 Yanoen Matcha Tea Sales, Revenue, Price and Gross Margin (2020-2025)
7.7.4 Yanoen Matcha Tea Product Offerings
7.7.5 Yanoen Recent Development
7.8 DoMatcha
7.8.1 DoMatcha Company Information
7.8.2 DoMatcha Introduction and Business Overview
7.8.3 DoMatcha Matcha Tea Sales, Revenue, Price and Gross Margin (2020-2025)
7.8.4 DoMatcha Matcha Tea Product Offerings
7.8.5 DoMatcha Recent Development
7.9 Uji Matcha (Shanghai)
7.9.1 Uji Matcha (Shanghai) Company Information
7.9.2 Uji Matcha (Shanghai) Introduction and Business Overview
7.9.3 Uji Matcha (Shanghai) Matcha Tea Sales, Revenue, Price and Gross Margin (2020-2025)
7.9.4 Uji Matcha (Shanghai) Matcha Tea Product Offerings
7.9.5 Uji Matcha (Shanghai) Recent Development
7.10 AOI Seicha
7.10.1 AOI Seicha Company Information
7.10.2 AOI Seicha Introduction and Business Overview
7.10.3 AOI Seicha Matcha Tea Sales, Revenue, Price and Gross Margin (2020-2025)
7.10.4 AOI Seicha Matcha Tea Product Offerings
7.10.5 AOI Seicha Recent Development
7.11 Ujinotsuyu Seicha
7.11.1 Ujinotsuyu Seicha Company Information
7.11.2 Ujinotsuyu Seicha Introduction and Business Overview
7.11.3 Ujinotsuyu Seicha Matcha Tea Sales, Revenue, Price and Gross Margin (2020-2025)
7.11.4 Ujinotsuyu Seicha Matcha Tea Product Offerings
7.11.5 Ujinotsuyu Seicha Recent Development
7.12 Zhejiang Tea
7.12.1 Zhejiang Tea Company Information
7.12.2 Zhejiang Tea Introduction and Business Overview
7.12.3 Zhejiang Tea Matcha Tea Sales, Revenue, Price and Gross Margin (2020-2025)
7.12.4 Zhejiang Tea Matcha Tea Product Offerings
7.12.5 Zhejiang Tea Recent Development
7.13 Horii Shichimeien
7.13.1 Horii Shichimeien Company Information
7.13.2 Horii Shichimeien Introduction and Business Overview
7.13.3 Horii Shichimeien Matcha Tea Sales, Revenue, Price and Gross Margin (2020-2025)
7.13.4 Horii Shichimeien Matcha Tea Product Offerings
7.13.5 Horii Shichimeien Recent Development
7.14 Shandong Hongyu agricultural science and Technology
7.14.1 Shandong Hongyu agricultural science and Technology Company Information
7.14.2 Shandong Hongyu agricultural science and Technology Introduction and Business Overview
7.14.3 Shandong Hongyu agricultural science and Technology Matcha Tea Sales, Revenue, Price and Gross Margin (2020-2025)
7.14.4 Shandong Hongyu agricultural science and Technology Matcha Tea Product Offerings
7.14.5 Shandong Hongyu agricultural science and Technology Recent Development
7.15 Hubei banbingwei Tea Industry
7.15.1 Hubei banbingwei Tea Industry Company Information
7.15.2 Hubei banbingwei Tea Industry Introduction and Business Overview
7.15.3 Hubei banbingwei Tea Industry Matcha Tea Sales, Revenue, Price and Gross Margin (2020-2025)
7.15.4 Hubei banbingwei Tea Industry Matcha Tea Product Offerings
7.15.5 Hubei banbingwei Tea Industry Recent Development
8 Industry Chain Analysis
8.1 Matcha Tea Industrial Chain
8.2 Matcha Tea Upstream Analysis
8.2.1 Key Raw Materials
8.2.2 Raw Materials Key Suppliers
8.2.3 Manufacturing Cost Structure
8.3 Midstream Analysis
8.4 Downstream Analysis (Customers Analysis)
8.5 Sales Model and Sales Channels
8.5.1 Matcha Tea Sales Model
8.5.2 Sales Channel
8.5.3 Matcha Tea Distributors
9 Research Findings and Conclusion
10 Appendix
10.1 Research Methodology
10.1.1 Methodology/Research Approach
10.1.1.1 Research Programs/Design
10.1.1.2 Market Size Estimation
10.1.1.3 Market Breakdown and Data Triangulation
10.1.2 Data Source
10.1.2.1 Secondary Sources
10.1.2.2 Primary Sources
10.2 Author Details
10.3 Disclaimer
About Us:
QYResearch established as a research firm in 2007 and have since grown into a trusted brand amongst many industries. Over the years, we have consistently worked toward delivering high-quality customized solutions for wide range of clients ranging from ICT to healthcare industries. With over 50,000 satisfied clients, spread over 80 countries, we have sincerely strived to deliver the best analytics through exhaustive research methodologies.
Contact Us:
Arshad Shaha | Marketing Executive
QY Research, INC.
315 Work Avenue, Raheja Woods,
Survey No. 222/1, Plot No. 25, 6th Floor,
Kayani Nagar, Yervada, Pune 411006, Maharashtra
Tel: +91-8669986909
Emails – arshad@qyrindia.com
Web – https://www.qyresearch.in
This release was published on openPR.
Vitamin D deficiency is incredibly common, with one study estimating that 20% of Americans don’t get enough of this essential nutrient, which supports bone health as well as proper nerve, muscle, and immune function.
While supplements can help fill the gap, certain foods—and, of course, exposure to the sun’s ultraviolet rays—also contribute to daily intake. Adults need about 600 international units (IU) of vitamin D per day until age 71, when the recommendation increases to 800 IU. Here are five foods or drinks that can help you meet your vitamin D needs.
Fatty fish, such as salmon, mackerel, and sardines, are among the richest natural sources of vitamin D3, the form most easily used by the body, Morgan Walker, MS, RD, LDN, a sports nutritionist and adjunct professor at Lebanon Valley College, told Health.
One 3-ounce serving of rainbow trout contains 645 IU of vitamin D, while the same amount of sockeye salmon has 570 IU. Canned tuna and salmon are convenient and economical options as well; you can add them to salads and sandwiches or use them to make fish “burger” patties.
Egg yolks contain vitamin D3, though not nearly as much as fatty fish. One large egg has 44 IU.
There are plenty of ways to enjoy eggs, but deviled eggs put the yolks front and center, said Jen Hernandez, RDN, CSR, a registered dietitian nutritionist focusing on renal health and founder of Plant-Powered Kidneys. They’re traditionally made with mayo (which also contains eggs), but Hernandez swaps in low-fat Greek yogurt for more protein.
Omelets, fried rice, and baked goods are other easy ways to incorporate more eggs into your diet.
There aren’t many plant-based foods that naturally contain vitamin D, but mushrooms that have been exposed to ultraviolet light do. A 1/2 cup of sliced white UV-exposed mushrooms provides about 366 IU. Look for labels that say “High Vitamin D” or “UV-Exposed.”
Shiitake, button, oyster, and other mushrooms contain a precursor to vitamin D called ergosterol. When UV rays hit the mushrooms, ergosterol converts to vitamin D2—a process similar to how sunlight triggers vitamin D production in our skin.
Hernandez likes roasting mushrooms or using them in a risotto. But make sure to include some healthy fats along with them. “With all of the vitamin D foods, because vitamin D is fat-soluble, it is important to include some type of fat to help absorb the vitamin D,” she told Health.
Fortified dairy products, such as cow’s milk and yogurt, typically provide vitamin D3, while most fortified plant-based milks and non-dairy yogurts are fortified with vitamin D2, Walker said.
One cup of fortified 2% reduced-fat milk contains 120 IU. Meanwhile, a cup of fortified soy, almond, or oat milk has between 100 and 144 IU, depending on the type.
Many breakfast cereals are fortified with vitamin D. While the amount varies by brand, they typically provide around 80 IU per serving.
Dumont doesn’t recommend getting the bulk of your vitamin D intake through processed fortified cereals. But they can be a good way to tick up those numbers, especially for kids who might shy away from mushrooms, eggs, or fish.
If you regularly spend time outdoors (research suggests that sunscreen doesn’t block vitamin D production) and have a diet full of foods rich in vitamin D, you probably don’t need a supplement, Dumont said.
However, experts noted that people who live in areas with limited sun exposure, spend most time indoors, have darker skin, or follow a vegan or vegetarian diet may benefit from supplementation. Many people with a vitamin D deficiency don’t have symptoms, but possible signs include muscle weakness, bone pain, and fatigue. A simple blood test—which Hernandez recommends people get twice a year, around daylight savings time—can confirm your levels.
Before taking vitamin D, it’s a good idea to consult your physician to ensure it won’t interact with other medications or existing health conditions.
New clinical science supports NXT USA’s claims that its patent-pending herbal blend, BluNADBooster, outperforms a popular NAD+ precursor, nicotinamide riboside (NR), in raising NAD+ levels. However, combining both ingredients demonstrated synergies for improved performance, brain health, reduced inflammation, and overall quality of life.
The findings are especially timely, as consumer awareness around NAD+ and its precursors is growing and advancing research-based longevity claims. Earlier this month, the US FDA confirmed that another common precursor, nicotinamide mononucleotide (NMN), can be marketed as a dietary supplement.
As a polyphenol-rich formula blending extracts from pomegranate and marigold, BluNADBooster itself is not a precursor. “The market has been waiting for an NAD+ solution that goes beyond precursors alone,” notes Eric Anderson, managing director at NXT USA and CEO of Blue Helix Health.
“BluNADBooster represents a next-generation approach — one that strengthens the body’s ability to generate and maintain healthy NAD⁺ levels while addressing the underlying mechanisms that cause NAD⁺ to decline with age,” he adds.
“This study confirms what we’ve believed for years: polyphenols matter, and they work in ways synthetic precursors cannot.”
The new study published in the Journal of Functional Food backs BluNADBooster’s “significant improvements” in key biomarkers for mitochondrial health, energy metabolism, inflammation, cognition, physical performance, and quality of life scores.
Researchers evaluated 140 healthy aging adults who received either a placebo, 500 mg of NR, 1,000 mg of BluNADBooster alone, or a blend of 500 mg of BluNADBooster and 500 mg of NR.
 They found that BluNADBooster alone increased blood NAD+ levels by 26.48% and outperformed NR, which recorded a 22.69% increase.They found that BluNADBooster alone increased blood NAD+ levels by 26.48% and outperformed NR, which recorded a 22.69% increase. Meanwhile, the combination of both produced the largest rise (31.76%), highlighting their synergies.
Overall, the research supports BluNADBooster as a cellular energy and longevity supplement for adults seeking proactive natural NAD+ support.
BluNADBooster also inhibited CD38, a multifunctional protein on cell surfaces that drives NAD+ depletion when its levels are elevated along the aging process. As a result, BluNADBooster reduced enzymatic activity by 17.98%, according to the researchers.
“This preservation of intracellular NAD+ pools supports healthier energy balance, more efficient metabolic signaling, and broader longevity pathways,” they note.
Through its rich polyphenol profile, BluNADBooster offered anti-inflammatory support, lowering key biomarkers associated with systemic inflammation and “inflammaging,” including TNF-α, IL-6, and GDF-15.
In addition to its metabolic and inflammatory benefits, BluNADBooster also delivered cognitive support for healthy aging. Participants experienced significant improvements in cognitive performance, measured by the Mini-Mental State Evaluation system.
BluNADBooster also contributed to improved physical endurance and energy, with the combination group showing a 9.94% increase in distance during the six-minute walk test.
“Health-related quality of life scores were significantly greater in all groups after 60 days, with the combination therapy of BluNADBooster and NR having the greatest improvements in energy/fatigue, daily living, bodily pain, emotional well-being, social functioning, and general health,” NXT USA reports.
This week, botanical nutraceutical producers under the Natural Products Association (NPA) hailed a “significant victory” for the dietary supplement industry as the US FDA confirmed this month that the NAD+ precursor NMN can be marketed as a dietary supplement, reversing a 2022 determination.
“This is a significant development as it follows actions taken by the FDA in September, when the agency reversed its previous determination that the investigation of NMN as a drug precluded its use in supplements. FDA’s determination came in response to an amended citizen petition and a lawsuit against FDA brought by NPA,” states the NPA.
“FDA’s recent letters — including its response to our amended citizen petition — represent a massive U-turn, and we’re proud that we were able to help shape the outcome. NPA strongly objected when FDA made the wrong decision on NMN three years ago, and we fought it in the regulatory arena, in conversations with congressional offices, and ultimately in the courts,” says Daniel Fabricant, Ph.D., president and CEO of NPA.
Following the FDA’s response to NPA’s citizen petition in September, which resolved the NMN controversy, the association filed a notice to voluntarily dismiss (without prejudice) its lawsuit against the FDA in the Federal District Court.
“While others sat on the sidelines, NPA’s efforts delivered an unequivocal victory on this specific issue,” Fabricant adds. “Furthermore, because of our actions, the FDA has now provided extremely valuable and additional clarity on the drug preclusion clause in the Dietary Supplement Health and Education Act of 1994, so this is, in a sense, a two-fer.”
“NPA will use this opening to advance a legislative solution to the drug preclusion clause, which has been inconsistently interpreted and applied in ways that threaten lawful supplement ingredients long after they have been safely marketed to consumers.”
NPA’s successful efforts to legitimize NMN required “extraordinary investments,” including the filing of a formal citizen petition and subsequent litigation against the FDA, notes Fabricant.
“Absent congressional action, the same uncertainty now looms over peptides and other next-generation ingredients that may become entangled in investigational new drug applications, chilling research, deterring investment, undermining innovation, and limiting consumer choice,” he cautions.
“Regulatory clarity is essential to ensure that DSHEA continues to function as Congress intended by providing a predictable, science-based framework that protects consumers while allowing innovation to flourish.”
This story was written in collaboration with L.A. TACO’s Media Lab class at USC, an incubator for emerging journalists aimed at forging a new path for the future of journalism. Keep a look out for our ongoing series of stories from L.A. TACO Media Lab students.
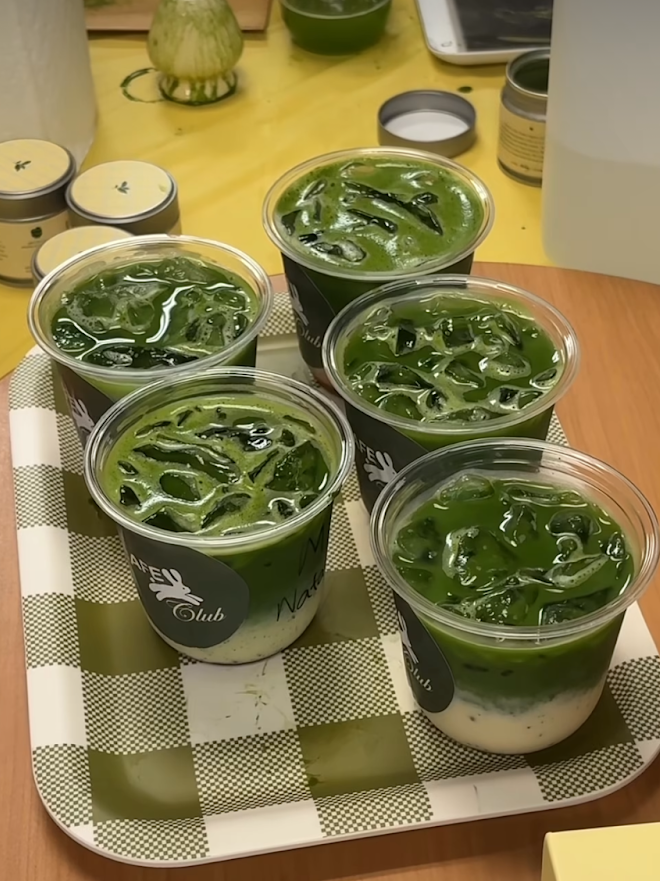
This viral $36 matcha tin just got more expensive.
Ashley Alexander, a popular YouTube influencer and founder of the matcha brand Nami Matcha, posted a TikTok in late October announcing that Nami would have to raise prices due to the “matcha shortage.”
Her most expensive product, Yame First Harvest Matcha powder, used to cost $36. Now, it costs $42.
Alexander’s TikTok caught the matcha community’s attention, receiving 423.2K views—the most Nami Matcha’s TikToks have ever received. Her comments were flooded with negativity, the top comments reading, “Insane bc ur matcha is alr SO expensive,” and, “More than $40 that’s just insane ur matcha is already expensive enough yeah goodluck!!”
Nami Matcha is just one business affected by the matcha shortage, or the high global demand for matcha, met by its low supply, but what is fueling the matcha shortage? And why can’t suppliers keep up with the demand?
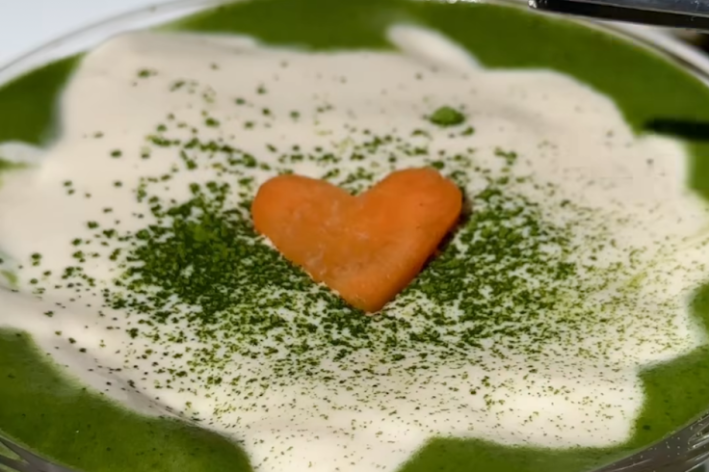
Over the past few years, matcha, a high-quality green tea finely ground into powder form, has gone viral all over the internet.
This is attributed to several factors, one being its beautiful, vibrant green aesthetic. Green matcha lattes or delicious matcha pancakes, for example, make for eye-catching Instagram posts or TikToks. Matcha recipes, reviews and drinks, in effect, gained millions of views.

The increase in tourism in Japan also increased the popularity of matcha online. As more and more people traveled to Japan to take advantage of the country’s cheap currency, more tourists tried or bought matcha and posted about it.
However, most of all, matcha gained an online presence because of its health benefits, which became prevalent following the pandemic. People were looking to become the healthiest versions of themselves, and matcha is known to be a healthy alternative to coffee.
Harvard Medical School published a study last year that lists all of matcha’s possible nutritional advantages.
They noted that catechins, antioxidants found in green tea, help lower blood pressure and cholesterol levels. Polyphenols, a plant-based chemical compound, have anti-inflammatory effects. Most notably, the amino acid L-theanine has been associated with improved concentration and alertness. Coffee, which does not contain L-theanine, may give drinkers the jitters instead.
All of these factors have fed the social media craze surrounding our favorite green drink, and as a result, demand has increased dramatically.
Miles Bothwell, a matcha educator for Den’s Tea, said, “The last year has been wildly different. In 2024, from the period of January to July, compared with 2025 January to July, the import [for matcha powder] is roughly a little more than 50% higher, which is a crazy number.”
Because of this spike in demand, suppliers in Japan are struggling to keep up.
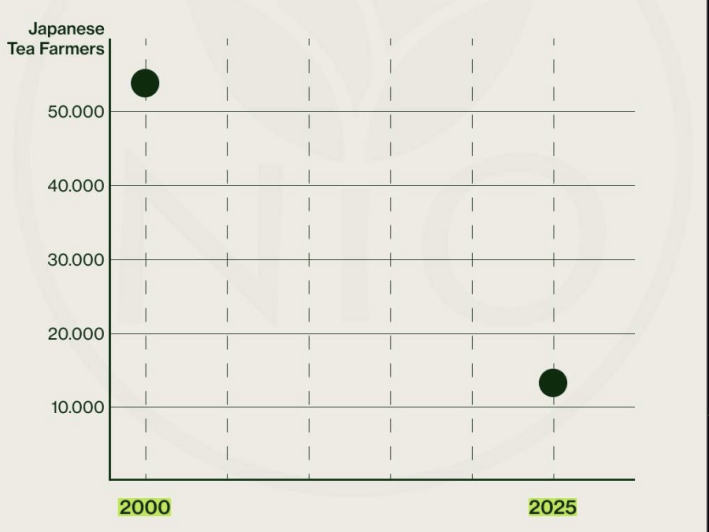
Farmers are aging, and younger populations are unwilling to take over.
According to Nio Japanese Green Tea, “In 2000, there were 53,000 tea farmers in Japan, and in the last 25 years that number has shrank 75% down to 12,353. Farmers are retiring quickly, and the younger generations aren’t willing to continue their work.”
To make matters worse, record-breaking heatwaves have led to lower-yielding harvests. Tea plants are highly sensitive to weather conditions. Extreme temperatures, irregular rainfall, and unexpected frost, worsened by climate change, can damage tea leaves or disrupt harvest times.
Even if enough tea leaves were being cultivated, there are still not enough stone mills to grind the matcha. Each mill spins slowly, producing 40 grams of powder—only enough for 10 to 12 matcha lattes—per hour. This is to ensure that the matcha is not damaged by friction-generated heat. Manufacturers would need many stone mills to produce enough matcha to meet current demand.
However, stone mills take time to construct as they are carved in a specific way to ensure the matcha is ground finely. There are only a few certified masters who create traditional Japanese stone mills, limiting matcha production.
The combination of all of these factors is preventing matcha suppliers from meeting the demand. As a result, matcha tins, like Nami’s, are costing people around $40 to $50 to get their hands on the limited supply.
As shown by Alexander’s TikTok comments, consumers are frustrated, to say the least. They are all of a sudden paying a higher cost for the same product. Several matcha powder retailers have had to increase their prices to stay afloat.
However, the effects of the matcha shortage are not necessarily all bad. Ryan Ahn, founder and CEO of Sanko Matcha Products and the co-host of the Specialty Matcha Podcast, acknowledges that there are pros.
“I actually think it’s a good thing for the industry because it’s putting everyone in an exploratory state, where you can search for little pockets of value where you might have never thought to buy matcha from this region, or processed in this way, or from this particular cultivar,” he says.
In order to remedy the matcha shortage and thereby drive down prices, experts are actually encouraging consumers to do just as Ahn said, explore other options.
Matcha is traditionally grown in Japan, but China and Korea are also major producers of matcha tea leaves. Jules Reyes, a cafe matcha educator who led marketing for Jade Leaf, the #1 Matcha Seller in the U.S., is attempting to educate people on alternatives and destigmatize matcha grown in other countries.
“What people don’t know is that, for example, in Chinese facilities that produce matcha, they are consulting with Japanese tea farmers,” she says. “They are helping them. Tea fields in Korea, planted by Japanese tea farmers.”
“I think that there’s an opportunity for matcha consumers to broaden our scope and try to appreciate the matcha for what it is. If we want to see the industry thrive, we have to open our minds.”
The Global Pet Nutraceuticals Market is projected to grow at a CAGR of 4.60% during the forecast period 2024-2031. This steady growth is driven by the global rise in pet ownership and humanization, increasing consumer spending on preventative pet healthcare, growing concerns over the aging pet population and associated conditions like osteoarthritis, and the expanding demand for targeted supplements for anxiety, weight, and immune system management.
Get a Free Sample PDF Of This Report (Get Higher Priority for Corporate Email ID):- https://www.datamintelligence.com/download-sample/pet-nutraceuticals-market?jd
North America: Key Industry Developments (Largest Market)
✅ November 2025: Zoetis Inc. announced a strategic expansion of its direct-to-consumer digital platform, integrating AI-driven pet health assessments to recommend personalized nutraceutical regimens (focusing on joint health and cognitive support) for aging dogs and cats, directly linking pet owners with veterinary-prescribed supplements.
✅ October 2025: The U.S. Food and Drug Administration’s Center for Veterinary Medicine (FDA CVM) issued new draft guidance on “Structure/Function Claims for Pet Dietary Supplements,” aiming to provide clearer regulatory pathways for nutraceutical manufacturers to communicate science-backed benefits for mobility, anxiety, and immune support on product labels.
✅ September 2025: Nestlé Purina PetCare Company launched a new line of “Veterinary-Formulated Functional Treats” in the U.S. market. The line combines proven nutraceutical ingredients like glucosamine, chondroitin, and probiotics within palatable treat formats, blurring the lines between supplement and reward for easier owner compliance.
Asia Pacific: Key Industry Developments (Fastest Growing Region)
✅ November 2025: A leading Japanese consumer health company, in partnership with Koninklijke DSM N.V., unveiled a new range of “Senior Cat” specific nutraceuticals at the Japan Pet Fair. The products feature highly bioavailable taurine, renal support blends, and omega-3s, targeting the region’s rapidly aging feline population.
✅ October 2025: The China Animal Health and Food Safety Alliance published its first “White Paper on Quality Standards for Pet Nutritional Supplements,” developed in collaboration with major manufacturers. This industry-led initiative aims to build consumer trust and standardize ingredient purity and labeling in the world’s fastest-growing pet market.
✅ September 2025: An Indian startup specializing in Ayurvedic botanicals for pets secured Series B funding to expand production of its “Calm & Joint” herbal blends for dogs. The products, featuring turmeric (curcumin), ashwagandha, and boswellia, are gaining traction in both domestic and export markets as natural alternatives.
Key Mergers and Acquisitions (2025):
✅ Kemin Industries, Inc. acquires a specialized pet probiotic manufacturer: In October 2025, Kemin Industries expanded its companion animal portfolio by acquiring a European company with patented strains for feline and canine gut-immune axis support. The move strengthens Kemin’s position in the high-growth segment of microbiome-targeted nutraceuticals.
✅ VH Group partners with a digital pet pharmacy platform: In September 2025, VH Group, a key player in animal nutrition, entered an exclusive e-commerce partnership with a subscription-based digital pet pharmacy. The deal facilitates direct access for consumers to VH Group’s premium nutraceutical lines, leveraging data-driven replenishment models.
Purchase this report before year-end and unlock an exclusive 30% discount: https://www.datamintelligence.com/buy-now-page?report=pet-nutraceuticals-market (Purchase 2 or more Reports and get 50% Discount)
Market Segmentation Analysis:
-By Product Type: Vitamins & Minerals Lead with Dominant Share
Vitamins and Minerals accounted for the highest share in the global market. This dominance is directly attributed to pet owners’ strong preference for addressing bone-related issues and supporting overall animal health. The aging pet population and high prevalence of conditions like osteoarthritis drive consistent, preventative use of calcium, vitamin D, glucosamine, and chondroitin supplements.
Proteins & Peptides and Fatty Acids (particularly Omega-3s) represent significant and growing segments, fueled by demand for muscle maintenance, skin/coat health, and anti-inflammatory benefits.
-By Application: Weight, Immune, and Pain Management Command Focus
Weight Management is a critical application area, as pet obesity rates climb globally. Nutraceuticals like L-carnitine, fiber blends, and specialized probiotics are increasingly incorporated into weight control programs.
Pain Management (primarily for joint health) and Immune Management are foundational drivers. Supplements that support mobility and natural defenses align with the pet humanization trend, where owners seek to improve quality of life and reduce reliance on pharmaceuticals.
-By Pet Type: Dogs and Cats Top with Strong Demand
Dogs represent the largest segment due to their high global ownership rates, susceptibility to joint issues, and the wide variety of breed- and size-specific formulations available.
Cats are a high-growth segment, with increasing owner awareness of feline-specific needs such as urinary tract health, kidney support, and stress/anxiety management driving demand for tailored nutraceuticals.
Growth Drivers:
1. Rising Pet Ownership and Humanization (“Pet Parents”): Pets are increasingly considered family members, leading to greater discretionary spending on their health, wellness, and longevity, with nutraceuticals seen as a proactive component of care.
2. Growing Aging Pet Population and Associated Health Concerns: As pets live longer, age-related conditions like arthritis, cognitive decline, and renal issues become more common, creating sustained demand for supportive nutraceuticals to maintain quality of life.
3. Increasing Veterinary Healthcare Costs: The high cost of advanced veterinary treatments and surgeries motivates owners to invest in preventative care through supplements to potentially avoid or delay more expensive medical interventions.
4. Expansion of Product Formats and Distribution Channels: The availability of nutraceuticals in convenient formats (soft chews, functional treats, flavored liquids) and their sale through online retailers, pet specialty stores, and veterinary clinics has dramatically improved accessibility and consumer adoption.
5. Scientific Advancements and Evidence-Based Formulations: Growing investment in clinical research to validate the efficacy of specific ingredients (e.g., green-lipped mussel for joints, probiotics for anxiety) is building veterinary and consumer confidence, moving the market beyond anecdotal claims.
Speak to Our Analyst and Get Customization in the report as per your requirements: https://www.datamintelligence.com/customize/pet-nutraceuticals-market?jd
Regional Insights:
North America holds the largest market share, driven by high pet ownership rates, significant per-pet spending, strong consumer awareness of pet health, and the presence of leading global manufacturers and brands. The U.S. is the epicenter of innovation and premiumization in this market.
Asia-Pacific is the fastest-growing region, fueled by rapid economic development, a burgeoning middle class, rising pet adoption (especially in China and India), and increasing awareness of pet healthcare. The market is evolving from basic nutrition to premium preventative supplements.
Key Players:
Nestlé Purina PetCare Company | Zoetis Inc. | VH Group | Kemin Industries, Inc. | Koninklijke DSM N.V. | Virbac | Hill’s Pet Nutrition, Inc. | Bayer AG | Ceva Santé Animale | Dechra Pharmaceuticals PLC
Key Highlights (Top 5 Key Players) for Pet Nutraceuticals Market:
1. Nestlé Purina PetCare Company is a global powerhouse in pet nutrition, leveraging its massive scale, scientific research (Purina Institute), and omnichannel distribution. Its strength lies in integrating nutraceuticals across its entire portfolio, from over-the-counter wellness brands to veterinary-exclusive therapeutic lines.
2. Zoetis Inc., as the world’s leading animal health company, possesses unparalleled veterinary channel strength and scientific credibility. Its nutraceutical portfolio, including brands like Recovery and Anxiety, is often recommended and dispensed by veterinarians, commanding a premium position in the market.
3. Hill’s Pet Nutrition, Inc. (a Colgate-Palmolive company) dominates the veterinary-prescribed diet market. Its deep scientific expertise in clinical nutrition is seamlessly extended to its nutraceutical offerings, creating strong synergies and trust among veterinary professionals for managing specific health conditions.
4. Koninklijke DSM N.V. (now part of DSM-Firmenich) is a leading science-based supplier of essential nutritional ingredients like vitamins, omega-3 fatty acids, and palatants. It drives the market from the ingredient level, supplying high-quality, traceable raw materials to pet food and supplement manufacturers worldwide.
5. Virbac is a dedicated animal health company with a strong focus on dermatology and dental care. It differentiates by offering vet-dispensed nutraceuticals that are closely aligned with pharmaceutical solutions, providing integrated therapeutic protocols for conditions like osteoarthritis and skin allergies.
Unlock 360° Market Intelligence with DataM Subscription Services: https://www.datamintelligence.com/reports-subscription?jd
Power your decisions with real-time competitor tracking, strategic forecasts, and global investment insights all in one place.
✅ Competitive Landscape
✅ Sustainability Impact Analysis
✅ KOL / Stakeholder Insights
✅ Unmet Needs & Positioning, Pricing & Market Access Snapshots
✅ Market Volatility & Emerging Risks Analysis
✅ Quarterly Industry Report Updated
✅ Live Market & Pricing Trends
✅ Import-Export Data Monitoring
Have a look at our Subscription Dashboard: https://www.youtube.com/watch?v=x5oEiqEqTWg
Contact Us –
Company Name: DataM Intelligence
Contact Person: Sai Kiran
Email: Sai.k@datamintelligence.com
Phone: +1 877 441 4866
Website: https://www.datamintelligence.com
About Us –
DataM Intelligence is a Market Research and Consulting firm that provides end-to-end business solutions to organizations from Research to Consulting. We, at DataM Intelligence, leverage our top trademark trends, insights and developments to emancipate swift and astute solutions to clients like you. We encompass a multitude of syndicate reports and customized reports with a robust methodology.
Our research database features countless statistics and in-depth analyses across a wide range of 6300+ reports in 40+ domains creating business solutions for more than 200+ companies across 50+ countries; catering to the key business research needs that influence the growth trajectory of our vast clientele.
This release was published on openPR.
Spotlighted in Innova Market Insights’ Top Trends for 2025, the “Taste the Glow” consumer trend embodies the expansion of beauty-related claims into food and beverage products. Key advances in the field include a precision probiotic isolated from kimchi to target skin conditions. Meanwhile, collagen remains a leading inclusion, boosted by complementary ingredients like OptiMSM that improves skin thickness and hydration.
As drivers of demand behind functional beauty ingredients, the majority of Gen Z and Millennial consumers surveyed by Innova Market Insights say that they want to buy food, beverage, or supplement products for their personal appearance. Younger consumers crave functional soft drinks, tea, and chocolate, and are highly receptive to novelty and creative packaging.
Nutrition Insight speaks with Bioiberica, AB-Biotics, Balchem Human Nutrition & Health, and ADM on the latest market insights and scientific advances propelling ingestible beauty.
Around two-thirds of consumers now recognize skin health as a key indicator of overall health, highlights Mónica Gomez Navarro, marketing manager of Branded Ingredients at Bioiberica.
“This helps explain why demand for skin-focused products is expanding beyond the traditional demographic of older women, with consumers across age groups and genders actively seeking out products that allow them to both feel and look their best.”
Gomez Navarro adds that the fundamentals of popular nutricosmetic formats tend to remain consistent, even as specific ingredients or benefits fall in and out of fashion. “Consumers want what they’ve always wanted: convenience, reassurance, and enjoyment.”
“Right now, the hottest formats fulfilling these needs are products like fortified teas, yogurts, and other dairy products that lend themselves to a moment of ‘me’ time. Quick and easy options like fortified gummies also remain firm favorites.”
.webp) Biotics are increasingly paired with complementary nutrients that have established roles in skin function.Miquel Bonachera, co-founder at AB-Biotics, observes that biotics are increasingly paired with complementary nutrients that have established roles in skin function. “Probiotics or postbiotics combined with zinc, support skin maintenance, while pairings with niacin or vitamin C target oxidative stress and antioxidant defense.”
Biotics are increasingly paired with complementary nutrients that have established roles in skin function.Miquel Bonachera, co-founder at AB-Biotics, observes that biotics are increasingly paired with complementary nutrients that have established roles in skin function. “Probiotics or postbiotics combined with zinc, support skin maintenance, while pairings with niacin or vitamin C target oxidative stress and antioxidant defense.”
“Hyaluronic acid also appears frequently in hydration-focused formulations. There’s also a growing interest in psychobiotics combined with melatonin in markets where it’s permitted, as brands and consumers alike recognize the role of stress management in holistic skin care.”
In terms of geographic activity, Bonachera says Asia-Pacific continues to lead in innovation due to strong consumer awareness of inside-out beauty approaches. Holistic formulations addressing both appearance and emotional well-being are rapidly growing in North America, while European demand maintains its focus on regulatory compliance and evidence-backed ingredients.
While the beauty-from-within market as a whole is booming, Jessica Arnaly, senior marketing and business development manager at Balchem Human Nutrition & Health highlights that collagen’s mainstay status is sustained by “especially strong growth.”
She says Balchem’s OptiMSM is a “perfect complement” to collagen for skin health. “Our methylsulfonylmethane (MSM) ingredient is a source of organic sulfur that aids collagen formation and other key building blocks of skin, like dermatan sulfate and hyaluronic acid.”
“It also supports the body’s network of defenses through production of glutathione, a crucial antioxidant that helps support the immune system via methylation and other epigenetic processes. All this helps keep our hair, nails, and skin looking their best as we age.”
A recent, double-blind, randomized, placebo-controlled trial compared the effects of 12 weeks of daily supplementation with either collagen alone, collagen plus MSM, or placebo on various skin parameters.
Arnaly says the results were significant: “While the group receiving collagen showed a noticeable improvement in skin density and wrinkle depth compared to both their baseline and the placebo, participants who received both MSM and collagen experienced additional and enhanced skin benefits.”
“Skin roughness was reduced in both supplement groups, but to a greater extent in those receiving both MSM and collagen,” she continues. “Additionally, only participants taking collagen plus MSM showed increased skin thickness and hydration.”
 Combining collagen with MSM, OptiMSM is ideal for inclusion in increasingly popular functional food and beverage products marketed as “GLP-1 receptor agonist companions.”While avoiding clumping and residue, Arnaly touts OptiMSM as ideal for inclusion in increasingly popular functional food and beverage products marketed as “GLP-1 receptor agonist companions.” Products of this type are nutritionally dense foods or supplements designed to minimize skin issues that can occur as a result of rapid weight loss.
“This can include deflation, dehydration, and sagging — symptoms often referred to as ‘Ozempic face,’” she notes. “Thanks to its skin firmness benefits, OptiMSM makes an effective addition to any food and beverage solution that aims to support users throughout their GLP-1 journey.”
Bioiberica spotlights a recently published peer-reviewed study published in Dermatology and Therapy supporting the skin health benefits of its hyaluronic acid matrix ingredient, Dermial.
Featuring a high concentration of hyaluronic acid (>60%), collagen, and other glycosaminoglycans, including dermatan sulfate, Dermial is marketed as the first hyaluronic acid matrix ingredient for beauty-from-within.
“The results showed its powerful regenerative and moisturizing properties, alongside a unique ‘glow’ effect, all of which was achieved at six weeks with the low daily dose of 60 mg per day,” says Gomez Navarro.
The trial involved 60 healthy female participants aged 35–65 with signs of natural skin aging, who were assigned either a daily supplement of 60 mg of Dermial or a placebo. At six and 12 weeks, researchers observed significant improvements in skin wrinkles and smoothness (at six weeks), as well as roughness and pH balance (at 12 weeks), compared with the placebo group.
“Participants in the Dermial supplement group also displayed a significant increase in skin brightness and hydration, as well as decreased scaliness and skin temperature at six and 12 weeks,” Gomez Navarro elaborates.
“Participants over 55 years old showed significant improvements across many skin barrier function parameters and skin properties, including brightness or glow, hydration, deformability, smoothness, roughness, scaliness, and temperature.”
Bioiberica has created concept formulations for yogurts and milk beverages featuring Dermial — trending formats that demonstrate the ingredient’s stability and adaptability, even when subject to pasteurization or ultra-heat treatment.
Studies investigating ingestible beauty options through the gut-skin axis are on the rise, indicating opportunities to leverage microbiome-supporting solutions
“The most recent introduction to our postbiotics suite, Lactobacillus gasseri CP2305, has clinical evidence demonstrating outcomes associated with stress management, mood support, and sleep quality in addition to support for specific demographics,” says Vaughn DuBow, senior director, Product Portfolio Marketing, Health & Wellness at ADM.
He details that research on healthy young women (average age of 21.5 years) experiencing premenstrual symptoms indicate that supplementing with L. gasseri CP2305 postbiotic may help improve skin appearance. “The data also shows L. gasseri CP2305 postbiotic may support positive moods, reduce stress or anxiety, help improve vaginal discharge, and help reduce occasional constipation for these healthy young women.”
This research also finds that the effects of L. gasseri CP2305 postbiotic on skin appearance and vaginal discharge may be mediated through the hypothalamus-pituitary-gonadal axis. “During the premenstrual period, supplementation with L. gasseri CP2305 postbiotic maintained estradiol levels and increased progesterone during the luteal phase,” notes DuBow.
ADM has also explored probiotic blends that address tailored skin health concerns with probiotics Bifidobacterium longum CECT7347 (ES1), B. animalis subsp. lactis CECT8145 (BPL1), and L. casei CECT9104 (BPL4). DuBow says the blend may help support relief for dry, itchy skin and help improve skin health.
“We have also assessed our Smooth Skin Formulation containing ES1, BPL1, and L. rhamnosus CECT8361 (BPL15), with findings showing it may support overall skin health, gut microbiome diversity, and clear and healthy skin.”
ADM’s beauty and wellness library is continuously expanding its range of bioactives and other plant-derived compounds. “A key example is our recently published study on Novasoy. The triple-blind, randomized, parallel, placebo-controlled pilot study examined, in postmenopausal women, the effects of oral soy isoflavone supplementation (Novasoy 400) for 12 weeks, compared to a placebo,” says DuBow
“Although statistical differences between groups were not reported, preliminary findings revealed a correlation between women who produced higher levels of S-equol (a gut-derived metabolite formed from soy isoflavones) and positive effects on skin under-eye smoothness, skin hydration, and barrier function. Further research would elucidate these findings.”
AB-Biotics’ AB-Sakei 65 is a probiotic ingredient that taps into the gut-skin axis, details Bonachera. “AB-Sakei 65 consists of our proprietary strain, L. sakei proBio65 — isolated from kimchi, is designed specifically for people managing sensitive or reactive skin and experiencing dryness, tightness, or occasional flare-prone discomfort.”
It works by modulating systemic immune activity associated with skin barrier balance as seen in clinical trials where AB-Sakei 65 was associated with reduced levels of the pro-inflammatory cytokines IL-4 and IL-6, as well as the allergen specific antibody IgE.
Additionally, Bonachera notes people taking the probiotic showed reduced levels of molecules that are associated with the severity and discomfort of flare-ups in sensitive and atopic-prone skin.
“In addition to these immune-related findings, participants receiving AB-Sakei 65 also saw improvements in skin hydration parameters, including moisture and sebum balance,” he adds.
Looking at future product development, he anticipates research will focus on a more integrated approach that explores how internal and external solutions work together. “As consumer understanding of the skin microbiome deepens, we’re seeing growing interest in combining ingestible products with topical applications built on the same scientific principles.”
“This creates a natural opportunity for us to explore cosmetic formats that complement our oral solutions, particularly using inactivated strains that offer the stability and texture compatibility that topical formulations demand.”


:max_bytes(150000):strip_icc()/Health-GettyImages-1281404261-9bef481bd59e452fb751be01905b5555.jpg "6 Foods You Should Eat Instead of Taking a Vitamin D Supplement")

.webp "Precision probiotics from kimchi and collagen companions")