

Category: Forex News, News
Natural Gas Price Forecast: Bullish Reversal Challenges 200-Day MA
Bearish Sentiment Dominates Until Rally Above 200-Day MA
Arguably, the retracement may be complete but there is not enough information yet to make that determination. There remains a lower target zone from 2.23 to 2.17 that has yet to be tested as support. If the 200-Day line continues to reflect resistance, a test of the lower support target becomes more likely. Nevertheless, the bearish scenario begins to soften on a decisive rally above last Tuesday’s high of 2.48. That will put natural gas above the 200-Day line, currently at 2.46. Strength would be confirmed on a daily close above 2.48.
Rally to Test Prior Support at 2.63?
The last breakdown price level was at the swing low of 2.635 (B) from June 24. Therefore, a swing back up to test that price area as resistance may play out if today’s daily bullish reversal can be sustained. Other price levels to watch on an upside move include the 50-Day MA at 2.54, the 38.2% Fibonacci upside retracement at 2.61, and the combined 50% retracement and 20-Day MA at 2.71. Each price area could see resistance on the way up.

Downward Pressure Remains
Given the bearish reaction today when encountering the 200-Day line resistance area, downward pressure remains. Unless there is a decisive rally above the 200-Day line with a daily close above it, the correction is set up to continue. As noted, there is a slightly lower target support zone that is derived from four price levels. Two come from previous support or resistance levels and two are from Fibonacci calculations. Just using the 61.8% Fibonacci retracement as a target level is enough. The other levels further confirm the likelihood of a 61.8% retracement prior to the correction being complete.
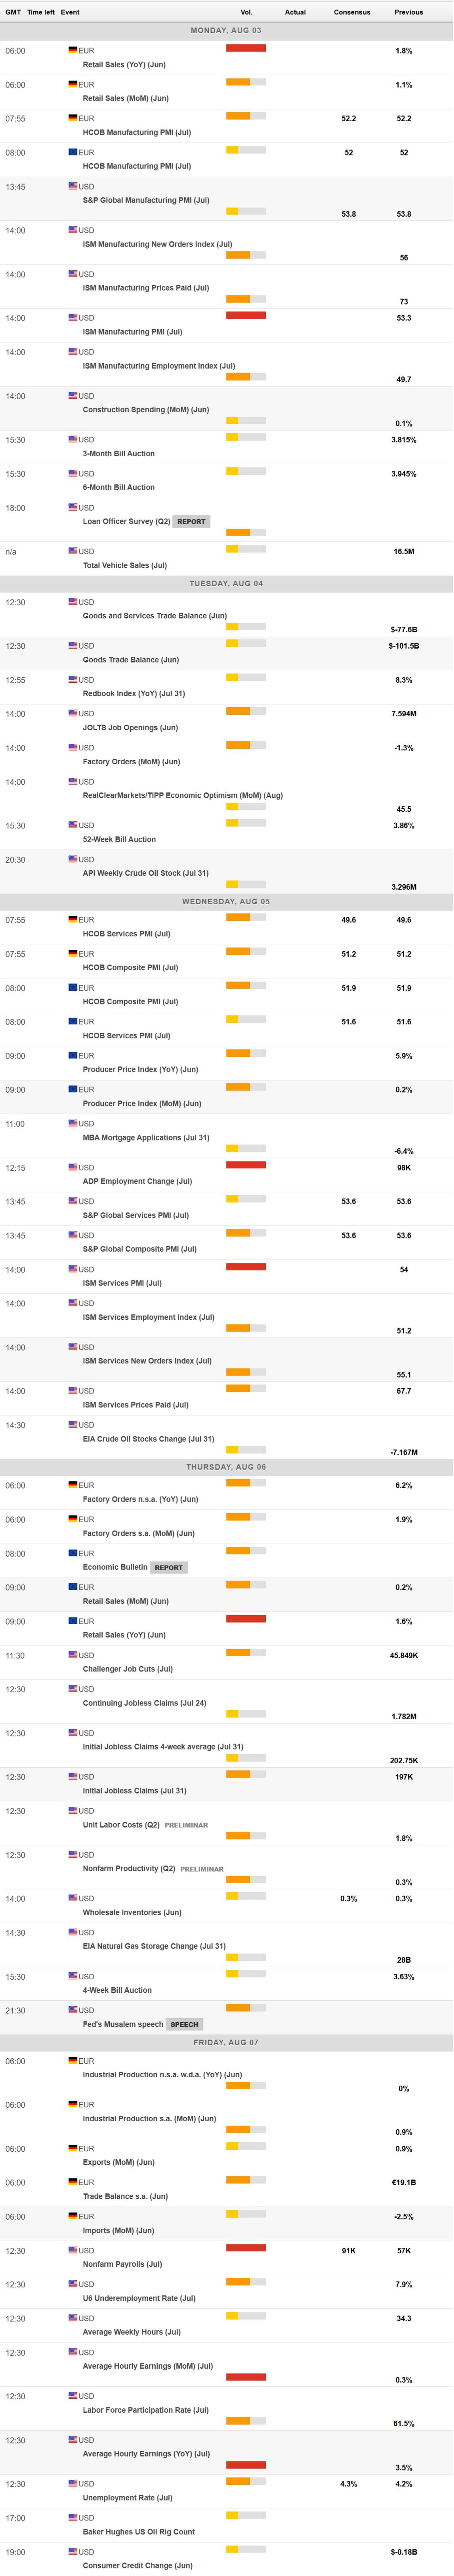
For a look at all of today’s economic events, check out our economic calendar.
Source link


Written by : Editorial team of BIPNs
Main team of content of bipns.com. Any type of content should be approved by us.


Share this article: