The main category of All News Articles.
You can use the search box below to find what you need.
[wd_asp id=1]
The main category of All News Articles.
You can use the search box below to find what you need.
[wd_asp id=1]
BNB USD (BNBUSD) is trading at $909.82 as of January 6, 2026, showing mixed signals in the crypto market. The token gained 1.71% today despite a 0.82% decline over the past 24 hours, reflecting volatility in the broader digital asset space. With a market cap of $133 billion and trading volume of 2.08 billion, BNBUSD remains one of the most actively traded cryptocurrencies. Understanding why BNBUSD is dropping requires examining technical indicators, market sentiment, and price forecasts that suggest both near-term challenges and longer-term opportunities for traders and analysts.
BNBUSD is currently trading near its 50-day moving average of $871.94, indicating consolidation around key support levels. The token’s year-to-date performance shows a 39.21% gain, though it remains 33.6% below its 52-week high of $1,370.55. Today’s 1.71% increase suggests some buying interest despite the broader downward pressure.
The day’s trading range of $890 to $915.89 shows relatively tight price action. Volume at 2.08 billion is 60% of the 90-day average, indicating lighter participation than normal. This reduced activity often precedes larger price moves as traders await clearer directional signals.
The RSI at 57.78 sits in neutral territory, neither overbought nor oversold, suggesting balanced momentum between buyers and sellers. The MACD shows a bearish signal with the line at -9.85 below the signal line at -20.16, though the positive histogram of 10.31 indicates potential bullish divergence forming.
The ADX at 34.83 confirms a strong downtrend is in place, meaning the current directional move has conviction behind it. BNBUSD is trading just above the Bollinger Bands middle line at $863.59, with support at $818.69 and resistance at $908.49. The Stochastic %K at 80.38 signals overbought conditions on shorter timeframes, which could trigger profit-taking in the near term.
Monthly Forecast: BNBUSD is projected to reach $833.08 by end of January, representing an 8.4% decline from current levels. This downside move would test the 200-day moving average at $889.20 and could be driven by profit-taking after recent gains.
Quarterly Forecast: By end of Q1 2026, the forecast rises to $1,032.17, a 13.5% increase from today’s price. This suggests a recovery phase after the monthly pullback, potentially driven by renewed institutional interest or positive regulatory developments.
Yearly Forecast: The 12-month target sits at $810.39, indicating a 10.9% decline from current levels. This longer-term view reflects potential consolidation as the market digests recent gains. Forecasts may change due to market conditions, regulations, or unexpected events.
Trading activity shows mixed signals with volume 60% below average, suggesting traders are cautious about directional commitment. The Money Flow Index at 71.08 indicates strong buying pressure despite price weakness, a bullish divergence that often precedes reversals.
Liquidation data reveals the Awesome Oscillator at 3.56 remains positive, showing momentum hasn’t completely reversed. However, the negative OBV at -18.1 billion suggests institutional selling pressure may be building beneath the surface. This combination indicates a market in transition between downtrend and potential recovery.
BNBUSD is dropping 0.82% today primarily due to profit-taking after the 1.71% daily gain and broader crypto market consolidation. The strong ADX reading confirms sellers maintain control, though oversold conditions on the Stochastic suggest a bounce could occur soon.
The token’s position between key moving averages creates a critical decision point. A break below $890 support could accelerate the decline toward $850, while a hold above $908 resistance might trigger a recovery toward $950. Traders should watch volume closely, as the current light activity suggests the next major move will come with increased participation.
BNB serves as the native token for the Binance Smart Chain ecosystem, which continues expanding with new DeFi protocols and NFT platforms. The token’s utility in transaction fees, staking rewards, and governance gives it fundamental value beyond speculation.
The 145.9 billion shares outstanding and $133 billion market cap position BNBUSD as a top-5 cryptocurrency by market value. Recent ecosystem developments, including enhanced cross-chain bridges and layer-2 scaling solutions, provide long-term growth catalysts. These fundamentals support the quarterly forecast of $1,032.17, though near-term technical weakness suggests patience is required.
BNBUSD at $909.82 presents a complex picture for traders and analysts on January 6, 2026. The token’s 1.71% daily gain masks underlying weakness, with the 0.82% 24-hour decline and strong ADX downtrend suggesting sellers remain in control. Technical indicators show mixed signals: neutral RSI, overbought Stochastic, and bullish MACD divergence all point to a market at an inflection point.
The price forecasts reveal a near-term pullback to $833.08 followed by a recovery to $1,032.17 in Q1, suggesting volatility ahead. Traders should monitor the $890 support level closely, as a break below could accelerate losses. The reduced trading volume indicates the market awaits clearer directional signals before committing fresh capital. For longer-term holders, the yearly forecast of $810.39 and three-year target of $1,017.53 suggest BNBUSD remains within a consolidation range despite short-term weakness. Market sentiment remains cautious but not bearish, with the Money Flow Index and Awesome Oscillator suggesting institutional interest persists beneath the surface.
BNBUSD is dropping 0.82% today due to profit-taking after recent gains and a strong downtrend confirmed by the ADX at 34.83. Lighter trading volume at 60% of average suggests traders are cautious about direction. The Stochastic at 80.38 indicates overbought conditions on shorter timeframes, triggering some selling pressure.
The monthly forecast for BNBUSD is $833.08, representing an 8.4% decline from current $909.82 levels. This pullback would test the 200-day moving average at $889.20. However, the quarterly forecast rises to $1,032.17, suggesting recovery in Q1 2026 after the monthly consolidation phase.
Key support for BNBUSD sits at $890 (day low) and $818.69 (Bollinger Bands lower band). Resistance is at $908.49 (upper Bollinger Band) and $915.89 (day high). A break below $890 could accelerate decline toward $850, while holding above $908 might trigger recovery toward $950.
BNBUSD shows mixed conditions: the RSI at 57.78 is neutral, but the Stochastic %K at 80.38 signals overbought conditions on shorter timeframes. The CCI at 244.77 also indicates overbought status. This suggests potential profit-taking in the near term, supporting the monthly forecast decline to $833.08.
The yearly forecast for BNBUSD is $810.39, while the three-year target reaches $1,017.53 and five-year forecast is $1,226.93. These targets suggest BNBUSD will consolidate around current levels before trending higher over multiple years, driven by ecosystem growth and institutional adoption.
BNBUSD has a market cap of $133 billion, making it one of the top-5 cryptocurrencies globally. With 145.9 billion tokens outstanding, the token maintains significant liquidity and trading volume of 2.08 billion daily. This scale provides stability compared to smaller altcoins.
Disclaimer:
Cryptocurrency markets are highly volatile. This content is for informational purposes only.
The Forecast Prediction Model is provided for informational purposes only and should not be considered financial advice.
Meyka AI PTY LTD provides market data and sentiment analysis, not financial advice.
Always do your own research and consider consulting a licensed financial advisor before making investment decisions.
The SUI price is trading sharply higher today, outperforming several major altcoins as on-chain activity and DeFi participation picked up over the past few hours. The move is being supported by rising transactions, stable liquidity, and expanding trading volumes, suggesting this is more than a short-lived speculative spike.
SUI is currently hovering near the $1.9–$2.0 zone, with over a 25% jump in the past 24 hours. The market cap increased above $7.44 billion, while the trading volume surged by over 85%, reaching over $1.65 billion. Sui always ranks among the coins that experience significant growth whenever the market recovers. The buying power of SUI is currently very strong and overwhelming, which has helped the price to surpass the previous peaks.
Now the question arises, will the SUI price continue to rise and mark new highs?
As SUI trades higher, on-chain data offers critical insight into whether the rally is driven by speculation or real network demand. This chart from Artemis displays a comparison of Sui’s daily transactions relative to its fully diluted market cap (FDMC) with token trading volume relative to FDMC over the past three months, highlighting how usage and market activity are evolving together.

The data shows a steady increase in transaction intensity, particularly since late November, suggesting that network activity is growing faster than SUI’s valuation. This points to expanding real usage across the ecosystem, including higher smart contract and application-level interactions.
Meanwhile, trading volume relative to FDMC remains volatile and largely range-bound, marked by brief spikes rather than sustained expansion. This divergence signals that recent price strength is not being fueled by excessive speculative trading.
Overall, the decoupling between rising usage and contained speculation supports the view that SUI’s current price trend is backed by organic adoption rather than short-term hype.
Blockchain data shows a visible pickup in transaction activity during the same period SUI’s price gained momentum. Despite the price surge, capital has not exited the Sui ecosystem. Total Value Locked has remained stable to slightly positive, indicating that investors are holding positions rather than selling into strength. Moreover, DEX activity on Sui has increased meaningfully, with the volumes rising in tandem with price.
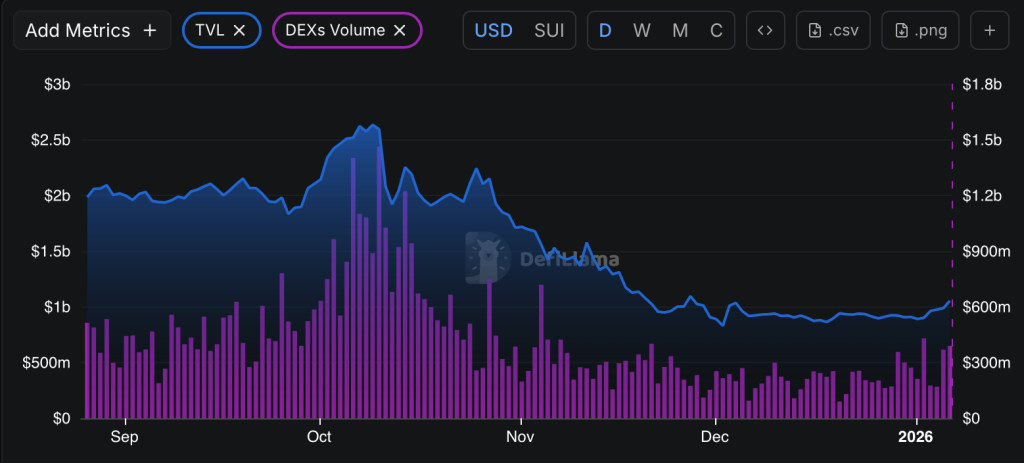
This alignment between price and usage often reflects genuine demand, not just exchange-driven trades. Higher transaction counts point to increased smart contract interactions, more active wallets and stronger short-term ecosystem usage. This behavior also contrasts with typical short-term pumps, where liquidity drains quickly. In SUI’s case, capital commitment remains intact, reinforcing the bullish structure.
SUI has entered 2026 with a notable rebound after a prolonged downtrend, putting focus back on its daily structure. The chart highlights a recovery from a clearly defined base formed in December, with price now attempting to reclaim key levels. Importantly, this move comes as trend and volume indicators begin to show early signs of improvement, suggesting the bounce may have follow-through. With Supertrend and OBV in focus, traders are now assessing whether SUI can extend toward higher resistance zones.
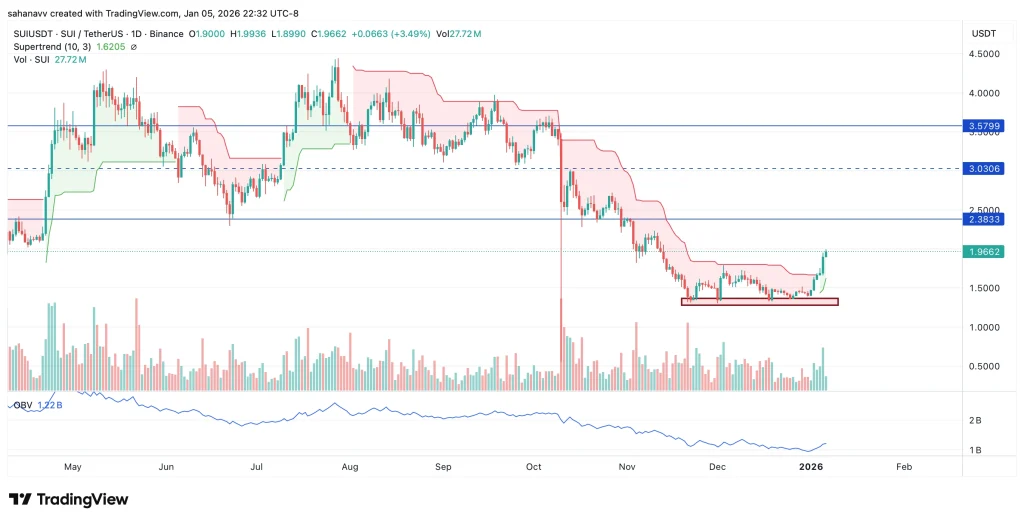
The daily chart shows SUI rebounding from the $1.4–$1.6 demand zone after a prolonged decline from above $3. Price is now pushing toward the Supertrend level, making $2.10–$2.20 the first upside target. A decisive Supertrend flip could open the door toward $2.35–$2.50, with $3.0 acting as a major resistance if momentum strengthens. Meanwhile, OBV has flattened and started to curl higher, signaling reduced selling pressure. A breakdown below $1.45 would invalidate this recovery setup.
SUI’s recent rebound is showing early signs of structure rather than a random relief bounce. The combination of a defended demand zone, price pressing toward the Supertrend, and improving OBV suggests selling pressure is easing. As long as SUI holds above the $1.45–$1.50 base, upside attempts toward the $2.2 and $2.5 resistance zones remain valid. However, a sustained trend reversal will only be confirmed if the price can flip the Supertrend and maintain higher volume participation. Until then, the move should be viewed as a developing recovery rather than a confirmed uptrend.
CoinPedia has been delivering accurate and timely cryptocurrency and blockchain updates since 2017. All content is created by our expert panel of analysts and journalists, following strict Editorial Guidelines based on E-E-A-T (Experience, Expertise, Authoritativeness, Trustworthiness). Every article is fact-checked against reputable sources to ensure accuracy, transparency, and reliability. Our review policy guarantees unbiased evaluations when recommending exchanges, platforms, or tools. We strive to provide timely updates about everything crypto & blockchain, right from startups to industry majors.
All opinions and insights shared represent the author’s own views on current market conditions. Please do your own research before making investment decisions. Neither the writer nor the publication assumes responsibility for your financial choices.
Sponsored content and affiliate links may appear on our site. Advertisements are marked clearly, and our editorial content remains entirely independent from our ad partners.
The EURJPY pair suffered strong negative pressures, reaching below the bullish channel’s support at 183.45 level, to suffer intraday losses by targeting 182.80 level, which forms a key support level to take advantage of its rally towards 183.40.
The confinement between extra support at 182.80 and 183.60 level makes us expect extending the support of the broken bullish channel, to keep the neutrality until confirming the trend by surpassing one of these levels, note that the price rally above 183.60 will reinforce the chances of renewing the bullish attempts, to expect targeting 184.40 barrier, and surpassing it will form next target at 184.90 level in the bullish trading.
The expected trading range for today is between 182.80 and 183.60
Trend forecast: Neutral
India is witnessing a profound transformation in how its citizens approach health and wellness. The nutritional supplements market of the country has evolved from a niche segment into a mainstream industry serving millions of health-conscious consumers. This shift reflects changing lifestyles, increased awareness about preventive healthcare, and growing disposable incomes. The market encompasses protein powders, vitamins and minerals, omega fatty acids, probiotics, herbal supplements, and sports nutrition formulations, catering to diverse segments from fitness enthusiasts to senior citizens. According to IMARC Group, the market was valued at USD 20.64 Billion in 2024, and it is projected to reach USD 57.53 Billion by 2033, at a CAGR of 11.14% during the forecast period (2025-2033).
Explore in-depth findings for this market, Request Sample
The contemporary Indian consumer has fundamentally altered their relationship with health and nutrition. Preventive healthcare has emerged as a priority, driven by increased health literacy and awareness campaigns. This paradigm shift has positioned nutritional supplements as essential components of daily wellness routines.
Young professionals and urban millennials view supplements as investments in long-term health outcomes. Immunity boosting has particularly resonated with vitamin C, vitamin D, zinc, and herbal formulations becoming household staples integrated into morning routines.
The fitness revolution has created massive demand for protein supplements and performance enhancers. Gym memberships have surged, home workout culture has flourished, and running communities have expanded exponentially. These enthusiasts view supplementation as fundamental to achieving their health goals.
Senior citizens represent another significant segment, increasingly recognizing the value of targeted nutritional support. Joint health supplements, calcium formulations, and multivitamins tailored for older adults have found substantial traction, often influenced by healthcare professionals.
Working adults facing demanding schedules have turned to supplements as convenient solutions for nutritional gaps. Energy boosters, stress management formulations, and cognitive support supplements address modern corporate life challenges.
The India nutritional supplements market presents a compelling growth story driven by demographic and economic factors. India’s large young population combined with rising per capita incomes creates an ideal environment for market development.
Protein powders have transcended bodybuilding to become mainstream nutritional products. Whey protein, plant-based protein, and blended formulations cater to diverse dietary preferences at multiple price points, making supplementation accessible to middle-class consumers.
Vitamin and mineral supplements represent the most established category with consistent demand. Single-vitamin formulations compete alongside comprehensive multivitamins, normalized through public health campaigns as preventive health measures.
Gummy vitamins have emerged as innovative products appealing to younger consumers and parents seeking child-friendly options. These combine functional benefits with enjoyable consumption experiences, successfully penetrating markets where traditional formats faced resistance.
Herbal and ayurvedic supplements leverage India’s traditional medicine heritage, resonating with consumers seeking natural wellness solutions. Ashwagandha and turmeric have been reformulated into convenient modern formats, bridging ancient wisdom with contemporary lifestyles.
Sports nutrition constitutes a high growth subsegment driven by fitness culture proliferation. Pre-workout formulations, post-workout recovery products, and amino acid supplements serve increasingly sophisticated consumer needs beyond elite athletes.
Organized retail expansion, modern trade channels, and e-commerce infrastructure have dramatically improved product accessibility. Consumers in tier-two and tier-three cities now access brands previously available only in metropolitan markets, unlocking new growth opportunities.
The fitness ecosystem in India has undergone remarkable expansion, creating substantial demand for nutritional supplements. Commercial gyms have proliferated with growing memberships, serving as important distribution and recommendation channels where trainers influence purchasing decisions.
Home fitness gained unprecedented momentum, with consumers investing in equipment and following digital workout programs. This expanded the market beyond traditional gym-goers to home exercisers. Online fitness platforms have democratized professional guidance while normalizing supplement consumption.
The running community has experienced explosive growth, with marathons attracting thousands of participants. Endurance athletes require specialized nutritional support including energy gels, electrolyte supplements, and recovery formulations. Running clubs facilitate knowledge sharing about supplementation strategies.
Whey protein has become synonymous with muscle building, establishing itself as the cornerstone sports nutrition product. Multiple domestic and international brands compete intensely, offering products with varying protein concentrations, flavors, and value propositions. For instance, in June 2025, Nutrabay announced the release of BioAbsorb, a next-generation whey protein intended to address poor absorption and digestive pain, two of the most prevalent but untreated problems that protein consumers encounter. Similarly, GNC Pro Performance 100% Whey + Keto Surge, a cutting-edge protein supplement that combines premium whey protein with fat-burning ingredients to support weight loss and lean muscle gain, has been introduced by GNC in May 2025.
Functional fitness and CrossFit-style workouts have introduced consumers to specialized supplements including branched-chain amino acids (BCAAs), creatine, and beta-alanine. Fitness influencer content has accelerated awareness and adoption of these performance products.
Women’s fitness has emerged as a distinct rapidly growing segment, with products formulated for female physiology addressing hormonal balance, bone health, and lean muscle development. Destigmatization of strength training among women has opened substantial opportunities.
Supplement brands have strategically partnered with gyms, fitness studios, and sports academies for brand awareness and trial. In-gym sampling, trainer endorsements, and co-branded events create multiple touchpoints with high-intent consumers, building credibility during the consideration phase.
The digital revolution has transformed how Indian consumers discover and purchase nutritional supplements. Online pharmacies have emerged as preferred destinations, offering convenience, competitive pricing, and extensive selection. Consumers can compare formulations, read reviews, and access detailed product information.
Direct-to-consumer (D2C) brands have disrupted traditional distribution by building direct customer relationships. These digitally native brands leverage social media, content marketing, and influencer partnerships to build awareness. By eliminating intermediary margins, many offer competitive pricing while maintaining premium positioning through brand storytelling.
Fast delivery capabilities have become essential, with leading platforms offering same-day or next-day delivery in major cities. Quick commerce platforms deliver supplements within hours of ordering, addressing the immediacy barrier to online purchasing.
Influencer marketing has proven exceptionally effective where trust influences decisions. Fitness influencers, nutritionists, and wellness creators provide authentic recommendations resonating with followers. User-generated transformation stories create powerful social proof driving conversions.
Subscription models have gained traction with recurring deliveries offering pricing benefits and eliminating reordering friction. Brands benefit from predictable revenue streams and increased customer lifetime value.
Personalization has emerged as a differentiator, with platforms offering customized recommendations based on health assessments and fitness goals. AI-driven engines analyze inputs to suggest optimal product combinations, enhancing satisfaction and average order values.
Digital payment infrastructure enables seamless transactions through wallets, UPI, cards, and buy-now-pay-later schemes. Educational content marketing—through blogs, videos, and podcasts—positions brands as trusted information sources, building credibility that translates into sales.
.webp)
The India nutritional supplements market features dynamic competition with domestic players, multinationals, and D2C brands vying for market share, offering consumers extensive choice while driving innovation and competitive pricing.
The India nutritional supplements market stands poised for sustained expansion driven by fundamental shifts in consumer behavior and health consciousness. The convergence of rising incomes, increased health awareness, digital infrastructure development, and demographic advantages creates a uniquely favorable environment.
The transition from reactive to preventive healthcare represents a cultural shift with lasting implications. Consumers increasingly view supplements as long-term wellness investments rather than immediate health responses, creating sustained demand beyond short-term trends.
Innovation in product formats, delivery mechanisms, and personalization will differentiate successful brands. Companies investing in understanding evolving consumer needs will capture disproportionate market share. Technology, data analytics, and consumer insights integration will separate market leaders.
Opportunities ahead are substantial for stakeholders across the value chain. Strategic investments in distribution infrastructure, brand building, and consumer education will yield significant returns as the market matures. What developments will shape the next chapter of India’s nutritional supplements revolution?
At IMARC Group, we empower businesses with intelligence to succeed in India’s evolving wellness market.
A top crypto analyst shared the possibility of a $80,000 level retest in a recent Bitcoin price prediction, sparking speculation. The BTC USD prediction comes despite the crypto breaking above $93,000 for the first time in a month.
The recent pump is the highest rebound in weeks and can be attributed to the rising geopolitical tensions. At the time of writing, traders and market watchers are both optimistic and cautious at the same time as they brace for a drop towards $80,000 before the start of any lasting bullish rally.
As such, the majority of traders perceive the recent surge as a tentative price action rather than a clear sign of momentum and strength.
The silver lining is that major technical signals started to improve with Bitcoin’s 4-hour price chart approaching the formation of a golden cross.
In a recent Bitcoin price prediction, a market watcher shared the possibility of the BTC USD pair retesting the $80,000 lows before it can print any meaningful gains. The price prediction surfaced just after the Bitcoin price soared by 5.53% over the last five days.
One particular top trader and analyst on X, CrypNuevo, said that BTC USD price is unlikely to recover immediately from current levels.
He compared the current market action to October 2019, suggesting that Bitcoin will continue to target nearby liquidity on exchange order books.
CrypNuevo noted that the market structure looks almost identical. In 2019, the price first ran through liquidity, then dipped to sweep the lows before staging a strong rally. He expects a similar pattern could play out this time.
That scenario would push Bitcoin price below $80,000 for the first time since April.
On the way down, traders are watching two gaps in CME Group’s Bitcoin futures market as potential support targets: between $90,500 and $91,600, and $88,200 and $88,800.
CoinGlass also released its latest data showing crypto short liquidations reached $250 million in 24 hours. Traders piled liquidity into the weekly close, eyeing $93,700 as the next upside target for Bitcoin bulls.
Keith Alan, cofounder of trading platform Material Indicators, noted on X that further price action could be even more interesting. A previous “wall” of sell orders at $100,000 has disappeared, removing a key resistance point.

Alan highlighted increased buying from smaller Bitcoin whales, signaling that momentum may be shifting. He told X followers that this could mark the start of a more dynamic phase in the market.
Bitcoin’s 5% rebound may look modest, but it could signal a shift in the market. In addition, the 50-period simple moving average (SMA) is almost to cross above the 200-day SMA on the four hour BTC price chart. This suggests a possible reversal of October’s death cross and signals massive potential for a bullish rally.
However, on the daily chart, a golden cross is still a distant possibility, following a death cross that appeared just a month later.
Looking at the longer term, trader SuperBro points to another set of trendlines that are turning bullish. The weekly 100-period SMA and EMA are both flipping green, suggesting stronger momentum.
SuperBro noted that in previous bear markets, the 100-week EMA crossing below the 100-week SMA marked the start of major Bitcoin price declines. In the past, these signals often came before crashes of more than 50% within just a few weeks.
This time, however, the market seems to be moving differently, suggesting the current cycle could play out more slowly.
Platinum price succeeded in renewing the bullish attack by its stability above $2085.00 level, activating with the main indicators’ positivity by its rally above $2235.00 barrier, and achieving clear gains by reaching $2335.00.
No escape from resuming the bullish attack, due to the continuation of providing bullish momentum by the main indicators to reach $2380.00, to attempt to press on the barrier at $2430.00 level, reinforcing the chances of reaching new historical stations in the near period.
The expected trading range for today is between $2235.00 and $2380.00
Trend forecast: Bullish
The GBP/JPY pair posts a fresh multi-year high at 212.15 during the Asian trading session on Tuesday. The pair trades firmly as the Japanese Yen (JPY) underperforms across the board, even as Bank of Japan (BoJ) Governor Kazuo Ueda has signaled that there will be more interest rate hikes in the near term.
The table below shows the percentage change of Japanese Yen (JPY) against listed major currencies today. Japanese Yen was the weakest against the New Zealand Dollar.
| USD | EUR | GBP | JPY | CAD | AUD | NZD | CHF | |
|---|---|---|---|---|---|---|---|---|
| USD | -0.06% | -0.05% | 0.05% | 0.02% | -0.17% | -0.18% | -0.03% | |
| EUR | 0.06% | 0.02% | 0.09% | 0.08% | -0.10% | -0.12% | 0.03% | |
| GBP | 0.05% | -0.02% | 0.08% | 0.07% | -0.12% | -0.13% | 0.01% | |
| JPY | -0.05% | -0.09% | -0.08% | -0.03% | -0.21% | -0.23% | -0.08% | |
| CAD | -0.02% | -0.08% | -0.07% | 0.03% | -0.18% | -0.20% | -0.05% | |
| AUD | 0.17% | 0.10% | 0.12% | 0.21% | 0.18% | -0.01% | 0.13% | |
| NZD | 0.18% | 0.12% | 0.13% | 0.23% | 0.20% | 0.01% | 0.14% | |
| CHF | 0.03% | -0.03% | -0.01% | 0.08% | 0.05% | -0.13% | -0.14% |
The heat map shows percentage changes of major currencies against each other. The base currency is picked from the left column, while the quote currency is picked from the top row. For example, if you pick the Japanese Yen from the left column and move along the horizontal line to the US Dollar, the percentage change displayed in the box will represent JPY (base)/USD (quote).
“BoJ expected to continue raising interest rates if economy and prices move in line with our forecast,” Governor Ueda said on Monday, and added that adjusting the degree of monetary support will help achieve “sustained growth and stable inflation”.
This week, investors will focus on the Overall Household Spending data for November, which will be published on Friday. The data is expected to have declined at a moderate pace of 1% against a 3% contraction in October.
Meanwhile, the Pound Sterling (GBP) trades higher against its peers, except antipodeans, as the market sentiment turns positive after the risks of a United States (US)-Venezuela clash subsiding. The British currency is expected to be majorly driven by market expectations for the Bank of England’s (BoE)monetary policy outlook amid a light United Kingdom (UK) economic calendar week.
In the daily chart, GBP/JPY trades at 211.92 as of writing. The 20-day Exponential Moving Average (EMA) rises and provides support at 210.04. Price holds above this rising gauge, preserving the bullish bias.
The 14-day Relative Strength Index (RSI) at 70.84 is positive but carries risks of stretched momentum.
As long as the pair remains above the ascending 20-day EMA, the trend is positive and could extend towards 215.00. While a close below 210.04 could invite a corrective pullback towards the December 19 low of 208.00.
(The technical analysis of this story was written with the help of an AI tool.)
The Bank of Japan (BoJ) is the Japanese central bank, which sets monetary policy in the country. Its mandate is to issue banknotes and carry out currency and monetary control to ensure price stability, which means an inflation target of around 2%.
The Bank of Japan embarked in an ultra-loose monetary policy in 2013 in order to stimulate the economy and fuel inflation amid a low-inflationary environment. The bank’s policy is based on Quantitative and Qualitative Easing (QQE), or printing notes to buy assets such as government or corporate bonds to provide liquidity. In 2016, the bank doubled down on its strategy and further loosened policy by first introducing negative interest rates and then directly controlling the yield of its 10-year government bonds. In March 2024, the BoJ lifted interest rates, effectively retreating from the ultra-loose monetary policy stance.
The Bank’s massive stimulus caused the Yen to depreciate against its main currency peers. This process exacerbated in 2022 and 2023 due to an increasing policy divergence between the Bank of Japan and other main central banks, which opted to increase interest rates sharply to fight decades-high levels of inflation. The BoJ’s policy led to a widening differential with other currencies, dragging down the value of the Yen. This trend partly reversed in 2024, when the BoJ decided to abandon its ultra-loose policy stance.
A weaker Yen and the spike in global energy prices led to an increase in Japanese inflation, which exceeded the BoJ’s 2% target. The prospect of rising salaries in the country – a key element fuelling inflation – also contributed to the move.
The Europe brain health supplements market size was valued at USD 2.54 billion in 2024 and is projected to reach USD 7.05 billion by 2033 from USD 2.84 billion in 2025, growing at a CAGR of 12.03%.
Brain health supplements refer to orally consumed dietary formulations containing bioactive compounds, such as omega 3 fatty acids phosphatidylserine bacopa monnieri and B vitamins designed to support cognitive function memory focus and neurological resilience, across the lifespan. These products are food supplements under Regulation EC No 1924 2006 and must comply with the European Food Safety Authority’s stringent assessments on health claims and ingredient safety. As per the Organisation for Economic Co-operation and Development, Europe is home to 110 million people aged 55 and over, a demographic projected to grow by 25% by 2035 by intensifying demand for scientifically backed cognitive support. Brain health supplements occupy a critical niche at the intersection of preventive nutrition regulatory science and consumer empowerment within Europe’s evolving health and wellness ecosystem.
The rapid aging demographic structure for sustained demand in brain health supplements, as individuals seek non pharmaceutical strategies to preserve cognitive function, which is driving the growth of Europe brain health supplements market. According to Eurostat, over 21% of the EU population was aged 65 or older in 2023 with projections indicating this will rise to 29% by 2050. Concurrently, the World Health Organization estimates that over 15.5 million Europeans live with mild cognitive impairment, a precursor to dementia with prevalence doubling 5 years after age 65. In response, consumers are proactively adopting nutritional interventions, where a 2023 survey by the European Consumer Organisation found that 58% of adults over 55 use omega 3 or B vitamin supplements specifically for memory support. National health agencies reinforce this trend, France’s National Agency for Food Safety recommends daily DHA intake of 250 milligrams for cognitive maintenance in older adults. This preventive mindset transforms brain health supplements from optional wellness products into essential components of healthy aging strategies across Europe’s graying population.
The younger generations are increasingly using brain health supplements to enhance focus academic performance and mental resilience in high pressure educational and professional environments. The growing mental performance expectations among younger people is additionally propelling the growth of Europe brain health supplements market. In the UK, the Office for National Statistics found that 31% of adults aged 18 to 35 purchased nootropic or adaptogenic supplements in 2023, including bacopa rhodiola and L theanine to manage cognitive fatigue and improve productivity. The rise of remote and hybrid work has further intensified this demand as professionals seek natural alternatives to stimulants for sustained mental clarity. Social media and digital wellness platforms amplify awareness with neuroscience backed content normalizing cognitive self-care.
The European Food Safety Authority’s rigorous scientific evaluation process severely limits the ability of brain health supplement manufacturers to communicate cognitive benefits to consumers. The stringent EFSA regulations restrict health claim substantiation is limiting the growth of Europe brain health supplements market. Under Regulation EC No 1924 2006, all health claims must undergo EFSA scrutiny and receive formal authorization before use in marketing. As per EFSA’s, public database over 95% of submitted cognitive health claims, including those for ginkgo biloba omega 3 and bacopa have been rejected due to insufficient human evidence or ambiguous wording. For instance, despite extensive research EFSA has not approved any claim linking DHA to memory improvement in healthy adults stating evidence is “not sufficiently substantiated.” This regulatory environment forces companies to use vague phrasing like “contributes to normal cognitive function” without specifying memory focus or mental clarity, significantly weakening consumer appeal. According to the European Federation of Associations of Health Product Manufacturers, 78% of supplement brands report that claim restrictions are the top barrier to product differentiation.
Many European consumers lack clear understanding of key brain health ingredients their mechanisms and realistic benefits leading to confusion and inconsistent usage is additionally impeding the growth of Europe brain health supplements market. The knowledge gap is exacerbated by inconsistent labelling products often list complex botanical names without explaining function or dosage relevance. In Italy, the National Institute of Health found that many supplement users discontinued brain health products within three months due to perceived lack of effect often because they used sub therapeutic doses or expected immediate results. Furthermore, the proliferation of unregulated “smart drugs” and exaggerated online claims has eroded trust in legitimate supplements. The European Commission’s 2023 Consumer Market Study confirmed that 47% of shoppers view brain health supplements as “marketing hype” due to unclear science communication. Until public health campaigns or digital tools bridge this literacy divide consumer adoption will remain fragmented and vulnerable to misinformation hindering the category’s mainstream credibility and growth potential.
The emergence of genetic testing wearable data and AI driven health apps for personalized brain health supplementation tailored to individual cognitive needs and biomarkers is creating new opportunities for the growth of Europe brain health supplements market. According to the European Institute of Innovation and Technology, many digital health startups in Europe launched cognitive wellness platforms in 2023 that combine cognitive assessments blood biomarker tracking and lifestyle data to recommend customized supplement regimens. In Sweden, the national digital health initiative “Vardval” piloted a program where users receive omega 3 or B vitamin formulations based on at home blood tests measuring homocysteine and DHA levels biomarkers linked to cognitive risk. Companies like MyFitnessPal and Lifesum now integrate brain health modules that adjust supplement suggestions based on sleep stress and cognitive performance tracked via wearables. The European Commission’s Digital Europe Programme has allocated 230 million euros to support such personalized nutrition services under its 2021 2027 health strategy. As consumers demand individualized solutions, over one size fits all products brain health supplements are evolving from static formulations to dynamic components of data driven cognitive wellness ecosystems creating high value engagement models.
Emerging scientific insights into hormonal impacts on cognition to position brain health supplements among women, particularly around menopause is also to expand the growth of the Europe brain health supplements market in coming years. According to the European Menopause and Andropause Society, over 52 million European women are in perimenopause or post menopause with 70% reporting “brain fog” memory lapses and reduced mental clarity linked to declining estrogen levels. Recent studies published in the European Journal of Clinical Nutrition confirm that omega 3 DHA and phosphatidylserine supplementation can mitigate these symptoms by supporting neuronal membrane fluidity and neurotransmitter function. In response, brands like Femal and MenoBalance have launched menopause specific cognitive formulas in Germany, France, and the UK, featuring clinically studied doses of these actives combined with adaptogens like ashwagandha. The UK’s National Health Service now includes nutritional guidance for cognitive symptoms in its menopause care pathways legitimizing the category.
The variable quality and authenticity of botanical ingredients in herbal nootropics like bacopa ginkgo and ashwagandha due to fragmented global supply chains and inadequate testing protocols kis significantly impeding the growth of Europe brain health supplements market. According to the European Directorate for the Quality of Medicines, many of herbal supplement samples tested in 2023 contained undeclared fillers substitutes or contaminants, including heavy metals and undeclared pharmaceuticals. In Germany, the Federal Office of Consumer Protection recalled 12 brain health products in 2023 after DNA barcoding revealed substitution of genuine bacopa with cheaper unrelated plants lacking active bacosides. The problem is exacerbated by the fact that many European supplement brands source raw materials from multiple countries without standardized cultivation or extraction practices. As per the European Botanical Forum, few of herbal suppliers provide full traceability from farm to finished product. This inconsistency undermines clinical efficacy studies show bacoside concentration in commercial bacopa extracts can vary by over 300% by leading to unreliable consumer experiences.
The absence of standardized dosing recommendations and validated cognitive endpoints for brain health supplements creates significant ambiguity in product development consumer expectations and regulatory evaluation across Europe. Unlike pharmaceuticals dietary supplements are not required to demonstrate dose response relationships or use clinically accepted cognitive assessment tools in their evidence dossiers. According to the European Food Safety Authority, submissions for cognitive claims often rely on heterogeneous study designs using different cognitive batteries durations and populations making cross product comparisons impossible. For example, omega 3 trials for memory support have used doses ranging from 200 to 2000 milligrams of DHA with outcomes measured by everything from simple word recall to complex executive function tests. The European Commission’s 2023 Scientific Committee on Health noted that this methodological inconsistency is a primary reason for claim rejections. Consequently, consumers cannot reliably compare products or anticipate results, leading to trial and error purchasing and high discontinuation rates. Until Europe adopts harmonized biomarkers clinical endpoints and minimum effective doses for key brain health ingredients the category will struggle to establish scientific credibility and consistent consumer trust across the single market.
|
REPORT METRIC |
DETAILS |
|
Market Size Available |
2024 to 2033 |
|
Base Year |
2024 |
|
Forecast Period |
2025 to 2033 |
|
CAGR |
12.03% |
|
Segments Covered |
By Product Type, Dosage Form, Distribution Channel, and Region |
|
Various Analyses Covered |
Global, Regional, & Country Level Analysis; Segment-Level Analysis; DROC, PESTLE Analysis; Porter’s Five Forces Analysis; Competitive Landscape; Analyst Overview of Investment Opportunities |
|
Regions Covered |
UK, France, Spain, Germany, Italy, Russia, Sweden, Denmark, Switzerland, Netherlands, Turkey, and the Czech Republic |
|
Market Leaders Profiled |
Teva Pharmaceutical Industries Ltd, Natural Factors Nutritional Products Ltd, HVMN, Onnit (Unilever), AlternaScript, Intelligent Labs, Mind Lab Pro, Reckitt Benckiser Group Plc, ReMind Brain Health Supplements, and Prepare Your Mood |
The nootropic supplements segment was accounted in holding 63.2% of the Europe brain health supplements market share in 2024 with the growing consumer preference for targeted cognitive enhancement over general multivitamin approaches. The rising demand for evidence backed botanical and bioactive ingredients that address specific cognitive concerns, such as memory focus and mental fatigue is also accelerating the growth of Europe brain health supplements market. Herbal extracts like bacopa monnieri and ginkgo biloba are also gaining traction, Germany’s Federal Institute for Risk Assessment reported a 34% increase in sales of standardized bacopa extracts between 2021 and 2023 due to emerging clinical data on memory support. Unlike generic vitamins nootropics offer perceived precision appealing to both aging populations seeking cognitive preservation and younger adults optimizing performance. The European Food Safety Authority’s acceptance of the claim that DHA “contributes to the maintenance of normal brain function” provides a rare sanctioned message that retailers leverage in labeling and education. This regulatory foothold combined with strong consumer interest in natural cognitive support ensures nootropic supplements remain the core of the European brain health market.
The herbal extracts segment is anticipated to witness a fastest CAGR of 10.6% from 2025 to 2033 with the renewed scientific validation of traditional botanicals and strong cultural acceptance across Southern and Central Europe. The accumulation of high quality clinical evidence supporting cognitive benefits of standardized herbal extracts is also to elevate the growth of Europe brain health supplements market. A 2023 meta-analysis published in the European Journal of Clinical Nutrition confirmed that bacopa monnieri extract with 55% bacosides significantly improved memory acquisition and retention in adults over 12 weeks. Similarly, ginkgo biloba EGb 761 has demonstrated neuroprotective effects in age related cognitive decline through multiple randomized controlled trials endorsed by the European Academy of Neurology. Unlike synthetic nootropics herbal extracts benefit from long standing traditional use in European phytotherapy in Germany, where Commission E monographs have recognized ginkgo for cognitive symptoms since 1987.
The capsules segment was the largest by accounting for 58.3% of the Europe brain health supplements market share in 2024. The perception of capsules as cleaner more precise and easier to swallow compared to tablets among older adults, who constitute a significant portion of the brain health user base is majorly escalating the growth of segment. According to a 2023 Eurobarometer survey, many European supplement users aged 55 and over prefer capsules due to their smooth texture lack of aftertaste and absence of binders or disintegrants. Germany’s Federal Institute for Drugs and Medical Devices confirms that bioavailability of DHA from softgel capsules is 25 to 30% higher than from compressed tablets due to better lipid dissolution. Leading brands like Solgar and Pharma Nord exclusively use capsules for their premium brain formulas to ensure efficacy and consumer compliance. In retail, capsules also convey a premium aesthetic glass bottles of clear capsules signal purity and quality more effectively than opaque tablets, further driving selection in competitive shelf environments.

The softgels dosage form segment is likely to grow at a fastest CAGR of 12.1% from 2025 to 2033 with the rising use of lipid based nootropics and demand for enhanced bioavailability in premium cognitive formulations. The dominance of omega 3 fatty acids, like DHA in brain health regimens, which require oil based delivery for optimal absorption is also fuelling the growth of segment. Softgels encapsulate fish or algal oil in a sealed gelatin or plant-based shell that prevents oxidation rancidity and gastric reflux common issues with liquid or tablet alternatives. Clinical studies published in the European Journal of Clinical Nutrition confirm that DHA from softgels achieves 30% higher plasma concentrations than from emulsified tablets. Brands like Wiley’s Finest and Testa Omega 3 have leveraged this advantage by using nitrogen flushed softgels with enteric coatings to further enhance delivery by appealing to scientifically literate consumers. In Germany, and the Netherlands, where omega 3 usage is highest softgel penetration exceeds 80% among regular users as confirmed by national health surveys.
The drug stores and retail pharmacies segment was accounted in holding 47.3% of the Europe brain health supplements market share in 2024 from high consumer trust in pharmacist guidance strong in store education and regulatory legitimacy in a category, where efficacy claims are restricted. The consultative role of pharmacists in recommending evidence based cognitive support products for older adults managing age related memory concerns. According to the European Pharmaceutical Association, many of Europeans aged 55 and over consult a pharmacist before purchasing brain health supplements due to confusion about ingredient efficacy and safety. Retail pharmacy chains like DM Drogerie in Germany and Boots in the UK train staff to explain the limited EFSA approved claims and differentiate clinically studied brands from generic alternatives. The physical presence of supplements alongside regulated health products also confers implicit credibility, unlike online or general retail channels where consumers face information overload and authenticity risks. This trust-based model ensures consistent high value sales particularly for premium nootropic and omega 3 brands that rely on professional endorsement rather than mass marketing.
The online distribution channel segment in the Europe brain health supplements market is projected to expand at a CAGR of 14.3% from 2025 to 2033 owing to the rise of direct to consumer brands that leverage digital storytelling clinical transparency and subscription models to build loyalty among younger health-conscious consumers. Companies like Heights in the UK and Nootrobox in Germany use online platforms to provide detailed ingredient sourcing third party test results and cognitive tracking tools by addressing the transparency gap that plagues traditional supplement marketing. Social media and influencer partnerships amplify awareness such as TikTok hashtags like #brainhealth and #nootropics generated over 1.2 billion views in Europe in 2023, as per platform analytics are driving traffic to e-commerce sites. The ability to offer sample kits personalized bundles and auto replenishment further enhances retention in a category requiring consistent use.
Germany was the top performer of the Europe brain health supplements market with 21.3% of share in 2024 with its strong phytotherapy tradition aging population and highly trusted pharmacy retail model. Germany is home to Europe’s oldest and most scientifically rigorous herbal medicine framework Commission E monographs, which includes ginkgo biloba for cognitive support, since 1987. The Federal Statistical Office reports that many adults over 60 use omega 3 or ginkgo supplements regularly with sales growing at 9% annually. Furthermore, Germany hosts leading supplement manufacturers like Dr Willmar Schwabe and Abtei that invest heavily in clinical research and GMP certified production.
The United Kingdom brain health supplements market was positioned second by holding 17.3% of share in 2024 with its high health literacy digital innovation and proactive aging population. According to the UK Office for National Statistics, 42% of adults aged 50 and over use brain health supplements with omega 3 and B vitamins as top choices. The National Health Service increasingly acknowledges nutrition’s role in cognitive aging with its “Midlife Health Check” program includes dietary advice for brain resilience. The UK is also Europe’s epicenter of direct-to-consumer nootropic brands like Heights and Nootropics Depot, which use subscription models and cognitive tracking apps to engage younger demographics.
France brain health supplements market growth is likely to grow with its centralized healthcare system pharmacist gatekeeping model and strong public awareness of cognitive aging. According to France’s National Agency for Medicines and Health Products Safety, pharmacists are legally required to counsel customers on supplement use making pharmacies the dominant sales channel for brain health products. The country’s “Alzheimer Plan 2021 2024” actively promotes preventive nutrition, including DHA and B vitamins, as part of national cognitive health strategy. The National Institute of Health and Medical Research confirms that some of French adults over 55 use supplements for memory support with ginkgo and omega 3 leading demand. Furthermore, France’s strict advertising laws prevent exaggerated claims fostering consumer trust in scientifically backed brands like Arkopharma and PiLeJe.
Italy brain health supplements market growth is fuelled by its herbal medicine heritage high elderly population and integration of brain health into Mediterranean diet messaging. According to Italy’s National Institute of Statistics, some of citizens are over 60, driving consistent demand for cognitive support supplements. The Ministry of Health actively promotes omega 3 from fish and olive polyphenols as brain protective elements of the Mediterranean diet legitimizing supplement use within a cultural dietary framework. Companies like Aboca and ESI, leverage Italy’s rich botanical tradition by cultivating ginkgo bacopa and rosemary in certified organic farms for standardized extracts. In 2023, the Italian Society of Neurology launched public campaigns linking nutrition to cognitive resilience further boosting supplement awareness.
Switzerland brain health supplements market growth is likely to grow with its high disposable income premium health culture and leadership in clinical validation of supplements. According to the Swiss Federal Statistical Office, over 55% of adults use dietary supplements regularly with brain health among the fastest growing categories. The country’s strict Swissmedic regulations require all supplements to meet pharmaceutical grade quality standards building exceptional consumer trust in efficacy and safety. Swiss brands like Nestle Health Science and Lonza develop brain health formulas backed by university led clinical trials often in collaboration with ETH Zurich and the University of Geneva. Switzerland’s neutrality also makes it a hub for international supplement companies seeking EU compliant production Lonza’s facility in Basel produces omega 3 softgels for over 30 European brands.
Competition in the Europe brain health supplements market is defined by a dual structure of established pharmaceutical and nutrition companies alongside agile direct to consumer brands. Large players like BASF, Nestle, Health Science, and Dr Willmar Schwabe compete on clinical validation regulatory compliance and pharmacist channel dominance leveraging decades of research and trusted professional relationships. In contrast, digital native brands such as Heights and Nootropics Depot focus on personalization transparent ingredient storytelling and subscription models to capture younger demographics through online channels. Fragmentation exists between Northern Europe’s science driven approach and Southern Europe’s traditional herbal preferences yet both segments demand authenticity and efficacy.
Some of the notable key players in the Europe brain health supplements market are
Key players in the Europe brain health supplements market prioritize scientific substantiation by funding human clinical trials and publishing results in peer reviewed journals to build credibility in a claim restricted environment. They invest in sustainable and traceable sourcing of key ingredients like omega 3 and herbal extracts to meet EU consumer expectations for transparency and environmental responsibility. Companies develop personalized cognitive wellness platforms integrating digital assessments biomarker testing and tailored formulations to enhance engagement and efficacy. Strategic partnerships with pharmacies universities and healthcare systems enable professional endorsement and integration into preventive care pathways. Additionally, they focus on clean label premium delivery formats such as plant based softgels to differentiate on quality and align with European clean eating and circular economy values.
This research report on the European brain health supplements market has been segmented and sub-segmented based on categories.
By Product Type
By Dosage Form
By Application
By Distribution Channel
By Country
Gold is looking to build on the previous over 2.5% rally early Tuesday, retaking the $4,450 level as prospects of further US Federal Reserve (Fed) interest rate cuts this year continue to act as a headwind to the US Dollar (USD) recovery.
Gold has found fresh buyers, sitting at weekly highs above $4,450, after having dipped to near the $4,430 region earlier on. The latest leg up in Gold could be attributed to the renewed selling interest around the USD amid improving risk sentiment.
Markets shrug off the US-Venezuela geopolitical tensions, now viewing the US intervention as limited, shifting their focus back toward the expectations surrounding future rate cuts by the Fed heading in the US labor data releases due later this week.
The dovish Fed bets returned to the fore on Monday and smashed the USD alongside the US Treasury bond yields after the US ISM Manufacturing PMI declined to 47.9 in December, against the forecast of 48.3.
Slowing US economic momentum and labor market conditions continue to remain a drag on the Greenback, as markets now eagerly await the US ADP monthly Employment Change and JOLTS Job Openings data due on Wednesday before Friday’s Nonfarm Payrolls showdown.
However, if the geopolitical tensions over the US and Venezuela gather steam again, a fresh bout of USD buying could re-emerge on safe haven flows, which will likely cap the Gold price upside. All eyes are on China’s and Russia’s response to the US military aggression.
Meanwhile, the overthrown Venezuelan President Nicolas Maduro pleaded not guilty before a New York Federal court on Monday to multiple charges.
US President Donald Trump’s capture of him on Saturday rattled world leaders and left officials in Caracas scrambling to regroup, per Reuters.
In the daily chart, the 21-day Simple Moving Average (SMA) climbs above the 50-, 100-, and 200-day SMAs, signaling firm bullish alignment. All SMAs advance and the price holds above them, reinforcing buyers’ control. The 21-day SMA at $4,349.26 supports the near-term bias, while the 50-day SMA at $4,201.11 underpins the broader trend.
The 14-day Relative Strength Index (RSI) stands at 64.41, positive and shy of overbought, suggesting momentum favors the upside. Should pullbacks emerge, the rising 21-day SMA could cap losses, while a deeper retracement would look toward the 100-day SMA at $3,985.64. The bullish tone would persist while XAU/USD trades above these moving averages.
(The technical analysis of this story was written with the help of an AI tool)
The ADP Employment Change is a gauge of employment in the private sector released by the largest payroll processor in the US, Automatic Data Processing Inc. It measures the change in the number of people privately employed in the US. Generally speaking, a rise in the indicator has positive implications for consumer spending and is stimulative of economic growth. So a high reading is traditionally seen as bullish for the US Dollar (USD), while a low reading is seen as bearish.
Next release:
Wed Jan 07, 2026 13:15
Frequency:
Monthly
Consensus:
45K
Previous:
-32K
Source:
ADP Research Institute


