The main category of All News Articles.
You can use the search box below to find what you need.
[wd_asp id=1]
The main category of All News Articles.
You can use the search box below to find what you need.
[wd_asp id=1]
Everyone who is sexually active is at risk for sexually transmitted infections (STIs). And knowing you have an STI can help you get timely treatment to protect you and your partner(s).
But too many women aren’t getting tested because they think they’re not at risk.
Our survey said:
2 out of 5 women haven’t been tested for STIs.
Testing is important because it helps:
A majority of women get STI testing because of symptoms
3 out of 5 women have had at least 1 vaginal symptom:
The most common symptom: vaginal discharge (46%)
Vaginitis — inflammation of the vagina — happens when there’s a change in the yeast or bacteria in the vagina. It can cause similar symptoms to STIs and can also be caused by some STIs.
STI mythbuster:
21% said all STIs cause symptoms.
You can get tested for STIs at many different places:
Nearly 7 out of 10 women surveyed would go to a healthcare provider’s office for vaginitis.
3 in 5 women identify at least 1 barrier to STI testing
Top reasons for not getting tested
It’s important not to let concerns like embarrassment or cost keep you from being tested.
If you get tested, you can get treatment. And treatment has many benefits:
STI treatments
Vaginitis treatments
Most women surveyed didn’t know about the benefits of vaginitis treatment — especially younger women (18–44) and women with lower incomes.
Remember: Not all STIs show symptoms, so if you’re having sex — get tested.
This educational resource was created with support from bioMérieux.
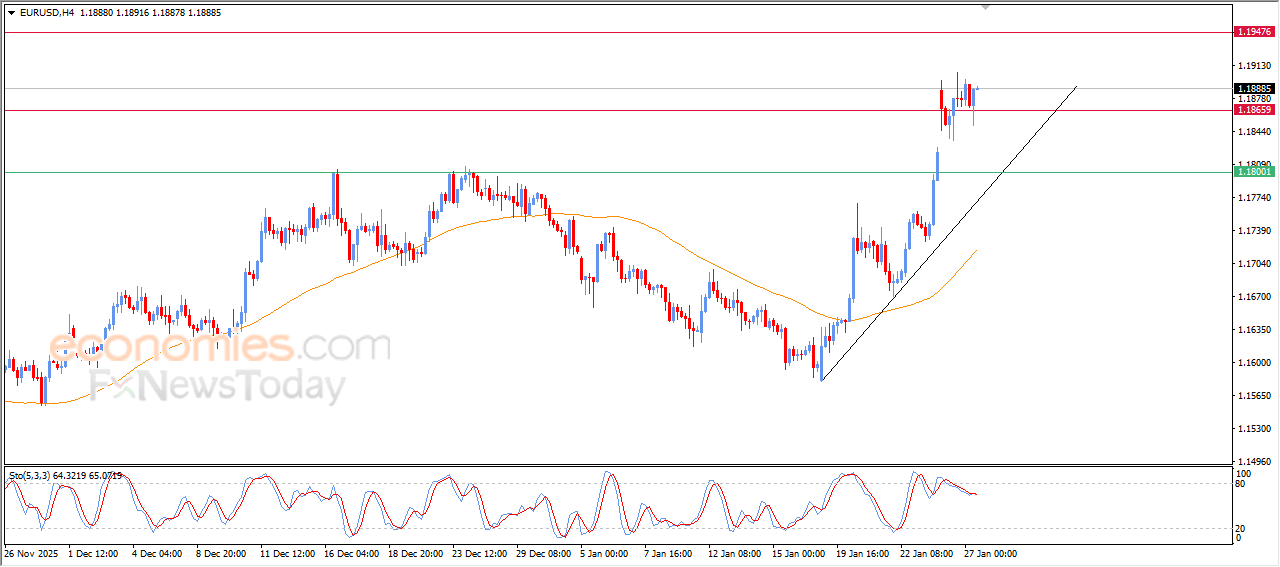
Based on recent performance, the EUR/USD pair has been witnessing a steady climb from its lows around 1.1610, following an ascending trendline that connects recent lows over the past month. According to reliable trading platforms, the pair recently touched a high of 1.1800 before retracing, and is currently testing a support level around 1.1730.
Simultaneously, Fibonacci levels drawn from the 1.1610 low to the 1.1800 high reveal potential support areas where the correction may find a floor:
The 38.2% Fibonacci level is at 1.1731.
The 50% level is at 1.1708.
A significant pullback could reach the 61.8% Fibonacci level at 1.1685, which nearly coincides with the ascending trendline support and may represent a crucial turning point for the bullish trend to continue. If any of these Fibonacci levels or the trendline support holds as a bottom, EUR/USD could resume its ascent toward its recent high or even record new levels above the 1.1800 psychological resistance. Conversely, breaking below the 61.8% level and the trendline would signal weakening bullish momentum and could lead to a deeper retreat.
Additionally, The Stochastic oscillator is trending downwards from overbought territory, indicating that sellers are gaining some momentum after the recent rally. However, the indicator is approaching the neutral 50 level and still has considerable room to fall before reaching oversold territory, meaning the correction could extend further before buyers return.
Meanwhile, yhe Relative Strength Index (RSI) is moving downwards from its recent highs and is currently hovering around the 50 level. The index still has considerable room to maneuver before reaching oversold territory, so the price may continue to move accordingly as sellers dominate market movements in the near term.
We recommend selling the EUR/USD pair from above the 1.1800 resistance level without risk, while always diversifying your investment portfolio with several trading products in addition to the EUR/USD.
During today’s forex trading, the EUR/USD pair may be affected by the European Central Bank’s (ECB) anticipated decision. It is widely expected that the ECB will maintain its current monetary policy, emphasizing its cautious, data-driven approach to any changes. However, any significant shift in its rhetoric could impact monetary policy expectations and the direction of the single European currency. EUR/USD trading today will also be influenced by the release of Eurozone inflation figures at 12:00 PM Egypt time, which will, in turn, affect the ECB’s policy direction. Regarding currency performance, the US dollar weakened after the highly anticipated US jobs report confirmed a slowdown in the labor market. While the US economy added 64,000 jobs in November, exceeding expectations of 50,000, this positive figure was the limit. The revised October report showed a loss of 105,000 jobs, while the unemployment rate rose to 4.6%.
The adjusted three-month job creation rate was only 22,000, highlighting the extent of the economic downturn and justifying the Federal Reserve’s interest rate cuts in an attempt to support the economy. Although the economy appears outwardly robust, the weakness in the labor market indicates an uneven pace of economic growth. Overall, the Federal Reserve’s further interest rate cuts reinforce expectations of a weaker US dollar in the coming weeks.
Ready to trade our EUR/USD daily forecast? Here’s a list of some of the top forex brokers in Europe to check out.
Vitamin D is an essential nutrient you mainly get from sun exposure. If you don’t get enough of it, some research suggests you could be at a higher risk of experiencing depression. However, research on whether supplementing with vitamin D can relieve depressive symptoms is mixed.
Vitamin D deficiency is common—affecting about 35% of adults in the United States—and is associated with several health problems.
For instance, lack of vitamin D is linked to cancer, cardiovascular disease, diabetes, multiple sclerosis, and autoimmune diseases. More recently, vitamin D has emerged as a possible cause of depression.
However, researchers have not determined definitively that vitamin D deficiency causes depression, though the two are linked. One large population-based study found an association between vitamin D status and depression in middle-aged adults.
The study results suggest that vitamin D deficiency and insufficiency may help identify adults who are at an increased risk of developing depression. Deficiency may also serve as a biomarker for people with depression whose symptoms persist despite treatment, meaning monitoring deficiency levels may help with depression diagnosis and tracking treatment progress.
Vitamin D supports several body functions and is essential for overall health. The vitamin helps your body absorb calcium and is an important component in developing strong bones and teeth.
Together, calcium and vitamin D help protect your body from developing osteoporosis. This condition causes your bones to weaken and become brittle, making them more likely to break. Low vitamin D also makes you more susceptible to osteomalacia, a condition causing bones to soften, leading to bone pain, muscle weakness, and bone deformities like rickets.
However, vitamin D’s role is not limited to bone health. It also has anti-inflammatory, antioxidant, and brain-protective properties and supports several other bodily functions.
For instance, having adequate amounts of vitamin D can boost your immune system’s ability to fight off viruses and other germs. Your muscles rely on vitamin D to move, and your nerves utilize vitamin D to send messages between your brain and your body.
Depression is a mood disorder that affects how a person feels, thinks, and handles daily activities, such as sleeping, eating, or working.
People who have depression often experience one or more of the following symptoms nearly daily for at least two weeks:
Everyone who is depressed experiences this condition differently and will not have every symptom listed above. If you or someone you love is showing signs of depression, contact the Substance Abuse and Mental Health Services Administration (SAMHSA) National Helpline at 1-800-662-4357 for information on support and treatment facilities in your area.
Several small studies have found that people who are depressed experience improvements in their symptoms after they start taking vitamin D supplements.
However, other research shows that supplementing with vitamin D does not affect symptoms of depression. For example, a large study including more than 18,000 people with depression found that taking 2,000 international units (IU) daily of vitamin D for five years did not change depression scores compared with taking a placebo. Several other studies came to similar conclusions.
Vitamin D is not included in the guidelines for treating mood disorders. More research is needed to determine the effectiveness of vitamin D for depression, as well as what blood levels are needed and how to supplement when a person is depressed.
If you have depression and suspect that your vitamin D levels are low, the best thing you can do is to talk with a healthcare provider. They may order a blood test to determine your vitamin D status. This will give you a baseline measurement of your vitamin D levels before you begin supplementation.
If you cannot afford testing, you may be able to supplement without testing as long as you stay within the recommended daily intake of vitamin D, which is 600-800 IU for adults. Some health experts maintain that taking vitamin D without testing is safe, especially if you know you aren’t getting adequate sunlight or eating fortified foods.
Your exact vitamin D needs are based on your age, health status, and skin color; non-Hispanic Black Americans, women, and people 20-29 years old are particularly at risk for vitamin D deficiency.
When taking vitamin D, be aware of how much you consume and avoid taking too much. Because vitamin D is fat-soluble, it has the potential to build up in your system and can result in vitamin D toxicity.
People with vitamin D toxicity may develop kidney stones (mineral clusters in urine that are difficult and painful to pass through the urinary tract).
Other symptoms include:
Extremely high vitamin D levels may cause irregular heartbeat, kidney failure, and death.
Vitamin D toxicity is almost always caused by supplementation. You cannot get too much vitamin D from the sun. Your skin naturally limits the amount of vitamin D it makes from sunshine.
Research indicates that symptoms of vitamin D toxicity are most likely to occur when your daily intake is at least 10,000 IU. However, amounts less than the tolerable upper intake level of 4,000 IU could also have a negative impact over time.
Vitamin D supplements may interact with some medications, including diuretics, statins, steroids, and Orlistat (a weight-loss drug). Some of these medications can also increase your risk of vitamin D toxicity. Talk to a healthcare provider before taking vitamin D supplements if you are taking any other medications or supplements.
Important DisclaimersFXEmpire is owned and operated by Empire Media Network LTD., Company Registration Number 514641786, registered at 7 Jabotinsky Road, Ramat Gan 5252007, Israel. The content provided on this website includes general news and publications, our personal analysis and opinions, and materials provided by third parties. This content is intended for educational and research purposes only. It does not constitute, and should not be interpreted as, a recommendation or advice to take any action, including making any investment or purchasing any product. Before making any financial decision, you should conduct your own due diligence, exercise your own discretion, and consult with competent advisors. The content on this website is not personally directed to you, and we do not take into account your individual financial situation or needs. The information contained on this website is not necessarily provided in real time, nor is it guaranteed to be accurate. Prices displayed may be provided by market makers and not by exchanges. Any trading or other financial decision you make is entirely your own responsibility, and you must not rely solely on any information provided through the website. FXEmpire does not provide any warranty regarding the accuracy, completeness, or reliability of any information contained on the website and shall bear no responsibility for any trading losses you may incur as a result of using such information. The website may include advertisements and other promotional content. FXEmpire may receive compensation from third parties in connection with such content. FXEmpire does not endorse, recommend, or assume responsibility for the use of any third-party services or websites. Empire Media Network LTD., its employees, officers, subsidiaries, and affiliates shall not be liable for any loss or damage resulting from your use of the website or reliance on the information provided herein.Risk DisclaimersThis website contains information about cryptocurrencies, contracts for difference (CFDs), and other financial instruments, as well as about brokers, exchanges, and other entities trading in such instruments. Both cryptocurrencies and CFDs are complex instruments and involve a high risk of losing money. You should carefully consider whether you understand how these instruments work and whether you can afford to take the high risk of losing your money. FX Empire encourages you to conduct your own research before making any investment decision and to avoid investing in any financial instrument unless you fully understand how it works and the risks involved.
Overactive bladder (OAB) is the frequent and urgent need to pee.
At least 4 in 10 women have OAB.
More than 1 in 2 women think that symptoms of OAB are normal signs of aging — but they’re not.
OAB can be treated, but it won’t go away on its own.
Symptoms of Overactive Bladder
If OAB isn’t treated, symptoms can get worse.
3 in 4 women with OAB report some negative impact from the condition, including:
Getting a bad night’s sleep
Interference with social activities
Concerns about intimacy
Who Can Help with Overactive Bladder
Primary care provider or gynecologist
Urologists
Urogynecologists
Pelvic floor therapists
Treatments for Overactive Bladder
One treatment option alone might be enough for you. Or you might need to try a few treatments together.
Treatments include
Lifestyle changes
Medications
Nerve stimulation
Electrical pulses can help the nerve signals between your brain and bladder communicate better.
New implantable and wearable devices allow more options for at-home nerve stimulation treatment.
Surgery
In very serious cases, your healthcare provider might recommend surgery to make your bladder bigger or to reroute the flow of pee.
Got symptoms? Get treated.
This educational resource was created with support from Sumitomo Pharma America Inc.
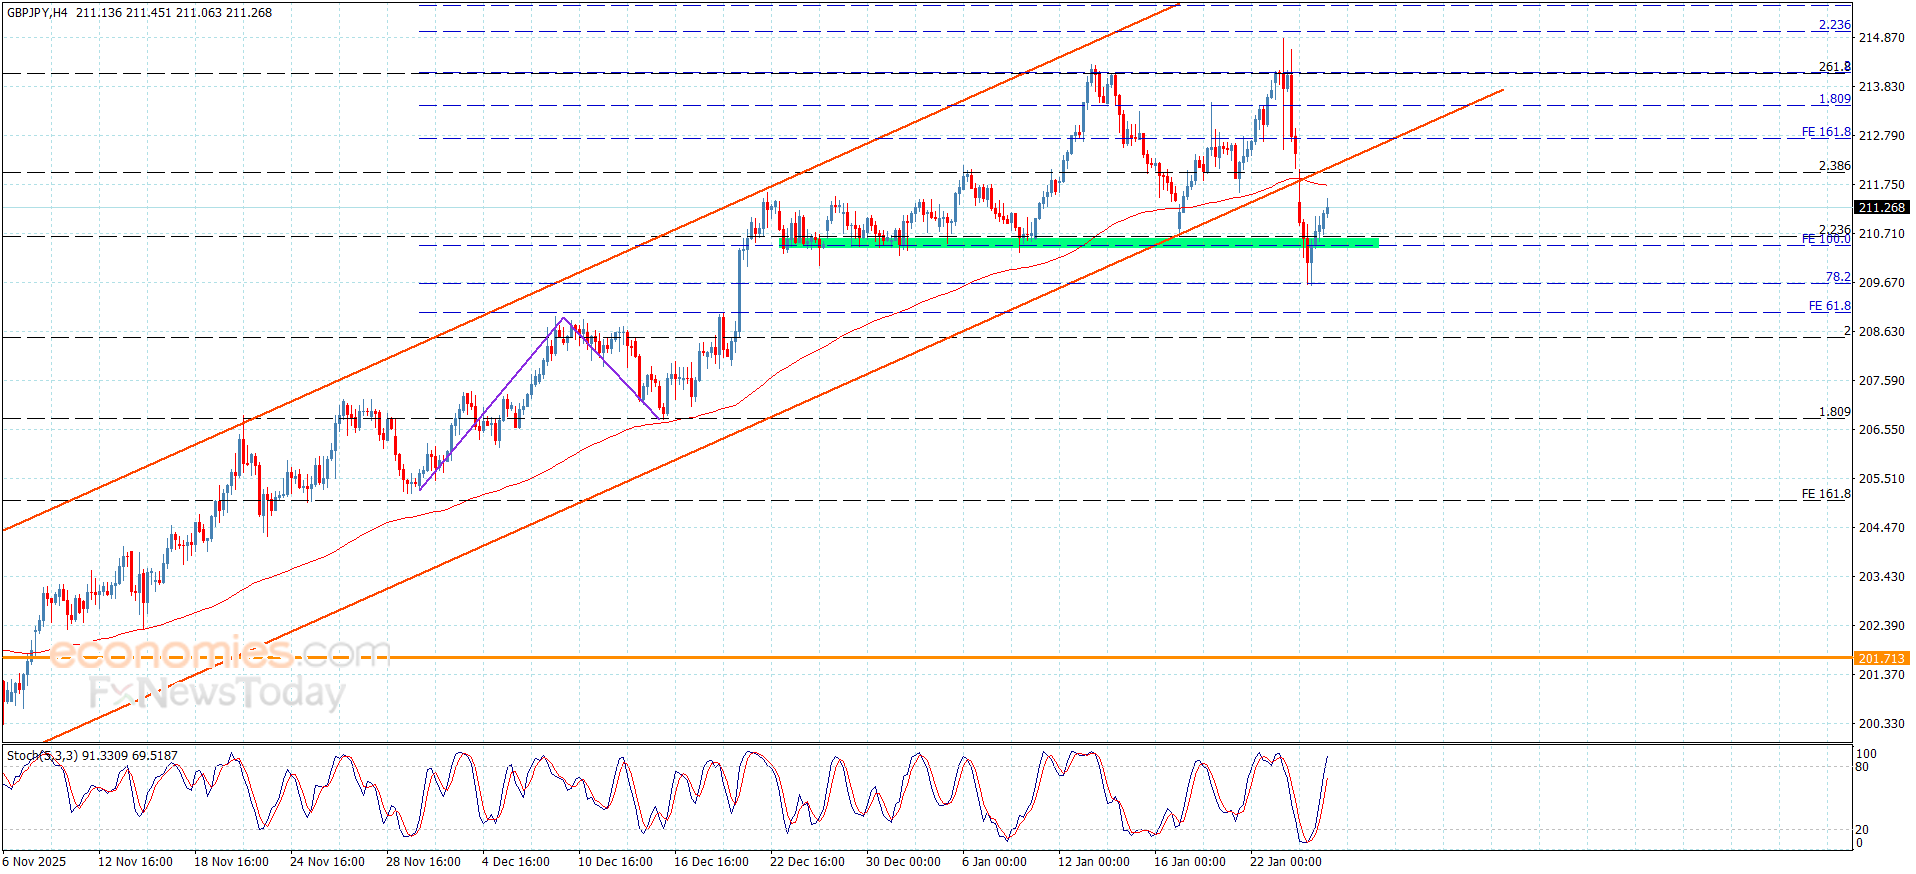
The British Pound (GBP) trims earlier losses against the Japanese Yen (JPY) on Wednesday after an initial sell-off triggered by softer-than-expected UK inflation data. At the time of writing, GBP/JPY is trading around 207.80, rebounding after buyers stepped in near the 207.00 psychological level.
The recovery, however, lacks conviction and appears driven by short-term repositioning, as traders remain reluctant to take aggressive bets ahead of the interest rate decisions from both the Bank of England (BoE) and the Bank of Japan (BoJ).
Looking ahead, most of the policy outcome is already priced in. The BoJ is expected to raise interest rates, while the BoE is seen cutting rates, leaving the focus firmly on forward guidance that could play a key role in setting the next move for GBP/JPY.
From a technical perspective, GBP/JPY remains in a strong uptrend on the daily chart, marked by a clear sequence of higher highs and higher lows. Prices continue to trade comfortably above key moving averages, reinforcing the broader bullish bias.
On the upside, the 208.00 psychological level acts as immediate resistance. A sustained break above this barrier could open the door for another leg higher toward a fresh year-to-date high above 209.00, with scope for further gains if bullish momentum strengthens.
On the downside, immediate support is seen near 207.00, which aligns with the 21-day Simple Moving Average (SMA). A break below this level would weaken the near-term outlook and expose the 204.00–205.00 support zone near the 50-day SMA. A decisive drop below the 50-day SMA would shift the tone toward a deeper corrective phase, with the 100-day SMA around 201.00 coming into focus.
Momentum indicators remain supportive, with the Relative Strength Index (RSI) holding near 60 and staying above its midline, suggesting that bullish momentum is still intact.
The Bank of Japan (BoJ) announces its interest rate decision after each of the Bank’s eight scheduled annual meetings. Generally, if the BoJ is hawkish about the inflationary outlook of the economy and raises interest rates it is bullish for the Japanese Yen (JPY). Likewise, if the BoJ has a dovish view on the Japanese economy and keeps interest rates unchanged, or cuts them, it is usually bearish for JPY.
Next release:
Fri Dec 19, 2025 03:00
Frequency:
Irregular
Consensus:
0.75%
Previous:
0.5%
Source:
Bank of Japan
ORLANDO, Fla., Dec. 17, 2025 /PRNewswire/ — Swisse – a premier brand of the Certified B Corp , Health & Happiness (H&H) Group, and a global leader in premium, science-backed wellness supplements, is expanding its portfolio with Glam Bites — a groundbreaking new line that supports beauty from within and makes daily self-care effortless for today’s busy woman.
Swisse premium supplement brand introduces Glam Bites – delicious zero sugar beauty gummies made with ingredients backed by science without the junk. Pictured from left to right: Swisse Beauty Glow Skin, Hair Skin Nails and Skin Defense Glam Bites are all crafted with zero sugar, no sugar alcohols, no artificial flavors, colors or sweeteners and are free from gluten and major allergens.1 (1) Major allergens include milk, eggs, fish, crustacean shellfish, peanuts, wheat, soybeans, sesame.
Crafted with zero-sugar, no sugar alcohols, no artificial flavors, colors or sweeteners and free from gluten and major allergens1, Swisse Beauty Glam Bites are a guilt-free addition to one’s daily beauty routine: just bite, nourish and glow from the inside out!
“Swisse Beauty Glam Bites are a simple and clean addition to your beauty routine” said leading dietitian, Dana. A. White. “They deliver powerful, science-driven beauty benefits through a precisely balanced blend of micronutrients in a zero-sugar gummy that has no artificial colors, flavors, or sweeteners – all with unique flavor profiles and great taste.”
Swisse Beauty Glam Bites are available now, arriving just in time for a fresh New Year beauty routine:
Research shows that 45% of Gen Z and 31% or millennials favor gummy supplements.2 What’s more, 74% of U.S. personal care buyers agree that skin health is a reflection of their overall health 3.
Born in Australia in 1969, Swisse has become a leader in wellness, inspiring millions around the world to enhance their health and wellbeing and celebrate life every day. Now available globally, Swisse products are made with ingredients backed by scientific research and adhere to world-class manufacturing standards, using only the best ingredients sourced from around the world.
Shop for Swisse on Amazon or at https://swisse.us/collections/glam-bites. For more information, visit https://swisse.us/.
*These statements have not been evaluated by the Food and Drug Administration. These products are not intended to diagnose, treat, cure, or prevent any disease.
(1) Major allergens include milk, eggs, fish, crustacean shellfish, peanuts, wheat, soybeans, sesame.
(2) Source: National Business Journal
(3) Source: Kantor Profiles/Mintzel June: 2023; Mintzel GNPD May’19-Apr ’24 and Primary & Secondary Research and AMR Analysis 2023.
About H&H Group North America
H&H Group is a global health and nutrition company with three growing business segments in North America – Baby, Adult and Pet Nutrition and Care – supporting whole-family health and happiness through premium brands providing nutrition and wellness solutions with ingredients backed by science for both pets and people. The consumer brands include Solid Gold Pet, America’s first holistic pet nutrition company, Zesty Paws, a brand of pet supplements, and children’s nutrition brand, Biostime, as well as vitamin, supplement, and skincare brand, Swisse.
SOURCE Swisse
Cryptocurrency
markets are trading under pressure Wednesday as Bitcoin holds near $87,700,
down a marginal 0.2%, while Ethereum, XRP and Dogecoin face modest losses amid
regulatory uncertainty and consolidation fatigue. The entire crypto market is
stuck in a holding pattern ahead of the holiday period, with 75% of the top 100
coins now trading below key moving averages.
In this article, I answer
the question of why cryptocurrencies are falling and analyze the BTC/USDT,
ETH/USDT, XRP/USDT, and DOGE/USDT charts, drawing on more than ten years of
experience as a trader and analyst.
Global
risk-off sentiment and fading liquidity are dragging crypto lower as investors
await clarity on central bank policy and regulatory frameworks. The selloff
coincided with news that the US Senate Banking Committee has delayed work on
the long-awaited crypto market structure bill, pushing all hearings to early
2026.
“The decline also coincided
with news that the U.S. Senate Banking Committee had delayed work on the
long-awaited bill addressing the structure of the cryptocurrency market,
postponing any hearings until early 2026,” explains Michał Stajniak, an analyst
at XTB. Although XTB is primarily known as a CFD broker, it
is currently working on introducing spot cryptocurrency trading.
The
committee failed to finalize a bipartisan agreement before the end of the year.
The office of Chairman Tim Scott emphasized that negotiations with Democrats
are still ongoing, but issues related to financial stability, market integrity,
and ethical standards continue to slow progress.
Adding
complexity, 2026 begins with a tight legislative calendar focused on government
funding, followed by November midterm elections that could push crypto
legislation even further back.
Bitcoin (BTC)
on Wednesday costs $87,700 and is losing a negligible 0.2%, continuing to hold
within the same consolidation range it entered in mid-November. According to my
technical analysis, the resistance sits in the $92,000–94,000 range, reinforced
by 100% Fibonacci retracement and the 50-day exponential moving average, while
the lower boundary extends from $85,600 to $84,000, providing a temporary rest
stop for bulls.
Why Bitcoin price is going down today? Source: Tradingview.com
Why
temporary? Because as I have written in many earlier analyses, I am currently
targeting a move down to this year’s lows around the $74,000 level. There are
many reasons for this, including a death cross drawn on the daily Bitcoin chart
a month ago.
What can we
expect in the coming days before the holidays? I don’t anticipate anything
spectacular, rather a continuation of this sideways trend followed by further
downside, and only a reset and washout near this year’s lows will allow for a
stronger rally and re-accumulation at lower prices, with a medium-term return
to all-time highs and higher.
The chart
of the second-largest cryptocurrency by market cap, Ethereum (ETH), looks very
similar to Bitcoin’s chart. We also see a local range here and a lack of
conviction from buyers and sellers about which direction to move.
At the
moment, ETH is losing for a fourth consecutive session, though the declines are
modest at 0.5% today, and the cryptocurrency is changing hands at $2,950.
The main
resistance zone is located between $3,350 and $3,435, supported by a grid of
moving averages, while support is the 61.8% Fibonacci retracement and
November-December lows around the $2,700 level. Here too I maintain a bearish
stance due to the ongoing downtrend, and I do not rule out a move toward
$2,200, the June low, and ultimately even $1,400, the April minimum.
Why Ethereum price is going down today? Source: Tradingview.com
For one XRP
you currently pay $1.92, and the quotes are standing for another session at the
height of a local support level marked by November lows, last tested also in
June. Once again, as on the two previous charts, we see roughly a month-long
consolidation whose upper boundary is the current range between $2.20 and
$2.30, additionally supported by the 50-day moving average.
The
arrangement of moving averages is practically the same, with a death cross
drawn in November and a dominant downtrend. A breakout of the local support
would open the way to the April lows near $1.61, and further to $1.25 where
price was last located during the October flash crash and earlier over a year
ago in late November 2024.
Why XRP price is going down today? Source: Tradingview.com
For dessert
I saved the precursor of the meme coin market, namely Dogecoin (DOGE), which has
already permanently broken the support zone I set earlier in the year around
0.14 and 0.15 dollars, as well as its deepening from the beginning of this
month.
As a
result, the price is still being held in check by the April 7, 2025 lows. If
this level is also broken, we will be heading below 0.10 dollars, targeting the
October flash crash minimums around 0.09 dollars, levels last observed in
September 2024.
Dogecoin
trades near $0.13 Wednesday, illustrating high-beta, sentiment-driven behavior
where thin liquidity and fading risk appetite drive exaggerated percentage
moves.
Why Dogecoin price is going down today? Source: Tradingview.com
“Most
are surprised by the lack of follow-through despite so many positive
catalysts,” said Pratik Kala, a portfolio manager at hedge fund Apollo
Crypto. This sentiment reflects broader market frustration with the inability
of Bitcoin and altcoins to break higher despite constructive regulatory
developments and ETF approvals.
If current
support breaks, the next major zone for Bitcoin lies near the $74,000 area I
have outlined. For Ethereum, a deeper correction toward $2,200 or even $1,400
cannot be ruled out if macro conditions worsen. For XRP and Dogecoin, downside
can be amplified due to thinner liquidity and higher volatility, with targets
at $1.61 and $0.09 respectively.
Bitcoin is
falling because it remains trapped in a month-long consolidation range with
resistance at $92,000-$94,000 and weakening momentum signaled by a death cross
formation on the daily chart. According to my technical analysis, BTC is
targeting a move down to this year’s lows around $74,000 as the sideways
pattern resolves to the downside.
Ethereum is
not crashing but declining modestly for a fourth consecutive session, down 0.5%
to $2,950, as it mirrors Bitcoin’s sideways consolidation pattern. The bearish
technical setup includes resistance at $3,350-$3,435 and support at $2,700,
with my analysis targeting potential moves toward $2,200 or even $1,400 if the
downtrend continues.
XRP is
dropping because it’s testing local support at November lows near $1.90 after
failing to break resistance at $2.20-$2.30, while regulatory delays add
uncertainty. My technical analysis shows a death cross formation and dominant
downtrend that could push XRP toward $1.61 and ultimately $1.25 if current
support breaks.
Dogecoin is
going down because it has already broken key support zones at $0.14-$0.15 and
is now testing April lows as a high-beta meme coin amplifies broader market
weakness. Trading near $0.13, DOGE faces potential further decline toward $0.09
if sentiment remains negative and liquidity continues to thin.
Crypto can
recover if equity markets stabilize, central banks provide clearer easing
guidance, and forced liquidations subside, allowing spot buyers and long-term
holders to return. According to my analysis, a washout near this year’s lows
would create healthier conditions for re-accumulation and a medium-term return
to all-time highs.
Cryptocurrency
markets are trading under pressure Wednesday as Bitcoin holds near $87,700,
down a marginal 0.2%, while Ethereum, XRP and Dogecoin face modest losses amid
regulatory uncertainty and consolidation fatigue. The entire crypto market is
stuck in a holding pattern ahead of the holiday period, with 75% of the top 100
coins now trading below key moving averages.
In this article, I answer
the question of why cryptocurrencies are falling and analyze the BTC/USDT,
ETH/USDT, XRP/USDT, and DOGE/USDT charts, drawing on more than ten years of
experience as a trader and analyst.
Global
risk-off sentiment and fading liquidity are dragging crypto lower as investors
await clarity on central bank policy and regulatory frameworks. The selloff
coincided with news that the US Senate Banking Committee has delayed work on
the long-awaited crypto market structure bill, pushing all hearings to early
2026.
“The decline also coincided
with news that the U.S. Senate Banking Committee had delayed work on the
long-awaited bill addressing the structure of the cryptocurrency market,
postponing any hearings until early 2026,” explains Michał Stajniak, an analyst
at XTB. Although XTB is primarily known as a CFD broker, it
is currently working on introducing spot cryptocurrency trading.
The
committee failed to finalize a bipartisan agreement before the end of the year.
The office of Chairman Tim Scott emphasized that negotiations with Democrats
are still ongoing, but issues related to financial stability, market integrity,
and ethical standards continue to slow progress.
Adding
complexity, 2026 begins with a tight legislative calendar focused on government
funding, followed by November midterm elections that could push crypto
legislation even further back.
Bitcoin (BTC)
on Wednesday costs $87,700 and is losing a negligible 0.2%, continuing to hold
within the same consolidation range it entered in mid-November. According to my
technical analysis, the resistance sits in the $92,000–94,000 range, reinforced
by 100% Fibonacci retracement and the 50-day exponential moving average, while
the lower boundary extends from $85,600 to $84,000, providing a temporary rest
stop for bulls.
Why Bitcoin price is going down today? Source: Tradingview.com
Why
temporary? Because as I have written in many earlier analyses, I am currently
targeting a move down to this year’s lows around the $74,000 level. There are
many reasons for this, including a death cross drawn on the daily Bitcoin chart
a month ago.
What can we
expect in the coming days before the holidays? I don’t anticipate anything
spectacular, rather a continuation of this sideways trend followed by further
downside, and only a reset and washout near this year’s lows will allow for a
stronger rally and re-accumulation at lower prices, with a medium-term return
to all-time highs and higher.
The chart
of the second-largest cryptocurrency by market cap, Ethereum (ETH), looks very
similar to Bitcoin’s chart. We also see a local range here and a lack of
conviction from buyers and sellers about which direction to move.
At the
moment, ETH is losing for a fourth consecutive session, though the declines are
modest at 0.5% today, and the cryptocurrency is changing hands at $2,950.
The main
resistance zone is located between $3,350 and $3,435, supported by a grid of
moving averages, while support is the 61.8% Fibonacci retracement and
November-December lows around the $2,700 level. Here too I maintain a bearish
stance due to the ongoing downtrend, and I do not rule out a move toward
$2,200, the June low, and ultimately even $1,400, the April minimum.
Why Ethereum price is going down today? Source: Tradingview.com
For one XRP
you currently pay $1.92, and the quotes are standing for another session at the
height of a local support level marked by November lows, last tested also in
June. Once again, as on the two previous charts, we see roughly a month-long
consolidation whose upper boundary is the current range between $2.20 and
$2.30, additionally supported by the 50-day moving average.
The
arrangement of moving averages is practically the same, with a death cross
drawn in November and a dominant downtrend. A breakout of the local support
would open the way to the April lows near $1.61, and further to $1.25 where
price was last located during the October flash crash and earlier over a year
ago in late November 2024.
Why XRP price is going down today? Source: Tradingview.com
For dessert
I saved the precursor of the meme coin market, namely Dogecoin (DOGE), which has
already permanently broken the support zone I set earlier in the year around
0.14 and 0.15 dollars, as well as its deepening from the beginning of this
month.
As a
result, the price is still being held in check by the April 7, 2025 lows. If
this level is also broken, we will be heading below 0.10 dollars, targeting the
October flash crash minimums around 0.09 dollars, levels last observed in
September 2024.
Dogecoin
trades near $0.13 Wednesday, illustrating high-beta, sentiment-driven behavior
where thin liquidity and fading risk appetite drive exaggerated percentage
moves.
Why Dogecoin price is going down today? Source: Tradingview.com
“Most
are surprised by the lack of follow-through despite so many positive
catalysts,” said Pratik Kala, a portfolio manager at hedge fund Apollo
Crypto. This sentiment reflects broader market frustration with the inability
of Bitcoin and altcoins to break higher despite constructive regulatory
developments and ETF approvals.
If current
support breaks, the next major zone for Bitcoin lies near the $74,000 area I
have outlined. For Ethereum, a deeper correction toward $2,200 or even $1,400
cannot be ruled out if macro conditions worsen. For XRP and Dogecoin, downside
can be amplified due to thinner liquidity and higher volatility, with targets
at $1.61 and $0.09 respectively.
Bitcoin is
falling because it remains trapped in a month-long consolidation range with
resistance at $92,000-$94,000 and weakening momentum signaled by a death cross
formation on the daily chart. According to my technical analysis, BTC is
targeting a move down to this year’s lows around $74,000 as the sideways
pattern resolves to the downside.
Ethereum is
not crashing but declining modestly for a fourth consecutive session, down 0.5%
to $2,950, as it mirrors Bitcoin’s sideways consolidation pattern. The bearish
technical setup includes resistance at $3,350-$3,435 and support at $2,700,
with my analysis targeting potential moves toward $2,200 or even $1,400 if the
downtrend continues.
XRP is
dropping because it’s testing local support at November lows near $1.90 after
failing to break resistance at $2.20-$2.30, while regulatory delays add
uncertainty. My technical analysis shows a death cross formation and dominant
downtrend that could push XRP toward $1.61 and ultimately $1.25 if current
support breaks.
Dogecoin is
going down because it has already broken key support zones at $0.14-$0.15 and
is now testing April lows as a high-beta meme coin amplifies broader market
weakness. Trading near $0.13, DOGE faces potential further decline toward $0.09
if sentiment remains negative and liquidity continues to thin.
Crypto can
recover if equity markets stabilize, central banks provide clearer easing
guidance, and forced liquidations subside, allowing spot buyers and long-term
holders to return. According to my analysis, a washout near this year’s lows
would create healthier conditions for re-accumulation and a medium-term return
to all-time highs.
DeFi Technologies has marked a significant milestone in its global expansion strategy by entering Brazil, a leading cryptocurrency market. Starting today, Brazilian Depositary Receipts (BDRs) representing the company’s shares, alongside several crypto-focused exchange-traded products (ETPs) from its subsidiary, will be listed for trading on São Paulo’s B3 exchange.
The company’s move targets Latin America’s largest and most integrated financial market. Brazil’s unified regulatory and capital market system encompasses over 213 million people. The nation’s crypto economy is particularly dynamic, with an estimated $318.8 to $319 billion in cryptocurrency transaction volume recorded between July 2024 and June 2025. This figure represents nearly one-third of all regional crypto activity.
Johan Wattenström, CEO and Executive Chairman of DeFi Technologies, characterized the B3 listing of the DEFT31 BDRs as a “critical next step” in the firm’s international capital markets strategy. He highlighted Brazil as one of the most progressive and rapidly expanding markets for digital assets, noting that the BDRs provide local institutional investors with a straightforward, domestically traded avenue to access the company’s growth narrative.
The Brazilian Securities Commission (CVM) and B3 have granted approval for the listings, which involve two parallel initiatives:
BDR Listing: Trading for the BDRs, ticker symbol DEFT31, commences today. These instruments enable Brazilian institutional investors to gain exposure to DeFi Technologies’ share performance using the local currency, the Brazilian Real (BRL). A ceremonial Closing Bell event is scheduled at B3 for December 17 to mark the launch.
Valour ETP Launch: Simultaneously, the company’s subsidiary, Valour Inc., has received approval to list four of its digital asset ETPs on the same exchange. The products, available for trading immediately, are:
This dual offering grants Brazilian investors access to both the company’s equity and major cryptocurrency tokens through familiar domestic brokerage and custodial infrastructure.
Should investors sell immediately? Or is it worth buying DeFi Technologies?
DeFi Technologies operates as a Nasdaq-listed, specialized digital asset manager. Its ecosystem provides investor access to the decentralized economy through several business units:
* Valour: Issues regulated ETPs tracking over 100 digital assets.
* Stillman Digital: Offers prime brokerage services with a focus on institutional execution and custody.
* Reflexivity Research: A dedicated digital asset research platform.
* DeFi Alpha: Manages internal arbitrage and proprietary trading activities.
The company recently reported solid third-quarter 2025 results, generating $22.5 million in revenue and $9 million in operating income. As of September 30, 2025, Valour’s assets under management (AUM) for its ETPs stood at approximately $989.1 million. The corporation’s combined cash and digital asset position totaled $165.7 million.
However, alongside these results, management issued a substantial downward revision to its full-year 2025 revenue guidance. The forecast was adjusted from $218.6 million to approximately $116.6 million. This correction was attributed to delays within the DeFi Alpha arbitrage business and narrower trading spreads experienced in the second half of 2025.
This strategic expansion into Brazil coincides with a recent executive transition. In November 2025, co-founder Johan Wattenström assumed the roles of CEO and Executive Chairman. His predecessor, Olivier Roussy Newton, stepped down and moved into a strategic advisory position. These leadership changes were disclosed in conjunction with the Q3 2025 earnings report.
Securing a listing on B3 extends DeFi Technologies’ exchange presence to a pivotal Latin American hub. Coupled with the new Valour ETP listings, this development strengthens the firm’s global footprint in digital asset trading.
In the immediate term, market attention will center on the trading debut of the BDRs and the four crypto ETPs. Subsequently, the company’s operational performance—specifically progress in its arbitrage operations and Valour’s AUM growth—will serve as the next test for its updated annual revenue forecast.
Ad
DeFi Technologies Stock: Buy or Sell?! New DeFi Technologies Analysis from December 17 delivers the answer:
The latest DeFi Technologies figures speak for themselves: Urgent action needed for DeFi Technologies investors.
Is it worth buying or should you sell? Find out what to do now in the current free analysis from December 17.
DeFi Technologies: Buy or sell?
Read more here…
Gold (XAU/USD) is posting marginal gains on Wednesday, but price action remains contained within previous ranges. Upside attempts remain capped below all-time highs at $4,350, and bears are contained above the $4,260-$4,270 so far. The doji candles in the daily chart highlight a hesitant market.
The US Dollar Index (DXY) is trimming some losses on Wednesday, and that is limiting Gold upside attempts so far. US data released on Tuesday maintain fears about a deteriorating labour market intact, but traders are waiting for Thursday’s US Consumer Prices Index report to reassess their expectations of further interest rate cuts by the Fed.
XAU/USD trades at $4,316.73, little changed daily, with recent price action forming a triangle pattern roughly around the $4,300 level, with an ascending parallel channel framing the broader uptrend. Triangles are considered continuation patterns and, in this case, they would signal a positive outcome.
Technical indicators, however, show mixed signals. The Moving Average Convergence Divergence (MACD) remains below zero with the histogram contracting, suggesting fading bearish pressure, while the Relative Strength Index (RSI) prints 57.77, maintaining a modest bullish tone.
Immediate resistance is at the top of the triangle, at $4,340 area and the December 12 and 15 highs, at $4,350 area. Further up, the top of the ascending channel, now around $4,385, emerges as the next target. Supports are at the $4,300 intraday low, ahead of the triangle bottom of $4,280 and the base of the channel, near $4,240.
(The technical analysis of this story was written with the help of an AI tool.)
Gold has played a key role in human’s history as it has been widely used as a store of value and medium of exchange. Currently, apart from its shine and usage for jewelry, the precious metal is widely seen as a safe-haven asset, meaning that it is considered a good investment during turbulent times. Gold is also widely seen as a hedge against inflation and against depreciating currencies as it doesn’t rely on any specific issuer or government.
Central banks are the biggest Gold holders. In their aim to support their currencies in turbulent times, central banks tend to diversify their reserves and buy Gold to improve the perceived strength of the economy and the currency. High Gold reserves can be a source of trust for a country’s solvency. Central banks added 1,136 tonnes of Gold worth around $70 billion to their reserves in 2022, according to data from the World Gold Council. This is the highest yearly purchase since records began. Central banks from emerging economies such as China, India and Turkey are quickly increasing their Gold reserves.
Gold has an inverse correlation with the US Dollar and US Treasuries, which are both major reserve and safe-haven assets. When the Dollar depreciates, Gold tends to rise, enabling investors and central banks to diversify their assets in turbulent times. Gold is also inversely correlated with risk assets. A rally in the stock market tends to weaken Gold price, while sell-offs in riskier markets tend to favor the precious metal.
The price can move due to a wide range of factors. Geopolitical instability or fears of a deep recession can quickly make Gold price escalate due to its safe-haven status. As a yield-less asset, Gold tends to rise with lower interest rates, while higher cost of money usually weighs down on the yellow metal. Still, most moves depend on how the US Dollar (USD) behaves as the asset is priced in dollars (XAU/USD). A strong Dollar tends to keep the price of Gold controlled, whereas a weaker Dollar is likely to push Gold prices up.