The main category of All News Articles.
You can use the search box below to find what you need.
[wd_asp id=1]
The main category of All News Articles.
You can use the search box below to find what you need.
[wd_asp id=1]
– Written by
Ben Hughes
STORY LINK Pound Sterling to Dollar Forecast: GBP/USD Tests Upper Ranges
The Pound-to-Dollar exchange rate (GBP/USD) has pushed to 1.3535, as foreign exchange analysts at ING and MUFG argue that confidence in US policymaking has not fully recovered, keeping the risk of renewed “Sell America” flows alive despite calmer headlines.
The Pound to Dollar (GBP/USD) exchange rate has been held in relatively narrow ranges and trading around 1.3440 after again finding support near 1.34 with Pound support from a boost to risk appetite offset by a firmer dollar.
According to UoB; “we continue to expect range-trading today, most likely between 1.3400 and 1.3460.”
Given major global pressure points, it is dangerous to assume that narrow ranges will prevail.
According to ING; “Some downside risks for the dollar persist: more volatility in JGBs spilling into Treasuries, scrutiny on upcoming US tech earnings, reignition in geopolitical/tariff risk. But the macro picture should favour a bit more dollar strength in the coming days, in our view.”
Risk appetite secured an initial boost on Wednesday following President Trump’s comments that he would not use force to secure a deal on Greenland.
Get better rates and lower fees on your next international money transfer.
Compare TorFX with top UK banks in seconds and see how much you could save.
There was a further boost to confidence after the European close after Trump stated that a deal on Greenland had been reached with NATO Secretary-General Rutte and that the threatened tariffs on eight European countries from February 1st would not go ahead.
Markets were concerned that US threats would trigger selling in US bonds and equities which would hurt the dollar. With the immediate threat easing, there was a rebound in the dollar.
Commerzbank forex strategist Volkmar Baur commented; “From a European perspective, it is too early to rejoice.”
He added; “However, the most likely outcome is still that the next wave of excitement will pass us by after a brief period of volatility and that the market will refocus on central banks and interest rate differentials.”
ING considers that attention will turn towards the Federal Reserve policy decision next week.
According to the bank; “We discussed last week how Powell’s fierce response to the criminal investigation signalled upside risks to the dollar, as he and other members could have turned more hawkish in a meeting without any rate change to reinforce the independence message.”
The Supreme Court also held a hearing on the US Administration case to dismiss Fed Governor Cook. The initial signs are that the court is not mindful to back Trump due to the threat to Fed independence.

MUFG still sees dollar risks, but added; “The loss of confidence in US policymaking is likely to remain a headwind for the US dollar as we have seen at the start of this year. However, the risk of a sharper US dollar sell-off has diminished after President Trump’s quick climb down over Greenland, and early indications from the Supreme Court overnight that they are likely to rule against President Trump’s decision to fire Fed Governor Lisa Cook.”
International Money Transfer? Ask our resident FX expert a money transfer question or try John’s new, free, no-obligation personal service! ,where he helps every step of the way,
ensuring you get the best exchange rates on your currency requirements.
TAGS: Pound Dollar Forecasts
Natural gas price continued forming strong bullish waves since yesterday, to notice achieving the suggested targets by reaching $4.00 level, to reach the support of the broken bullish channel’s support, which represents a key resistance.
Noticing that stochastic begins to exit the oversold level, attempting to provide a new bullish momentum, to increase the chances of surpassing the current resistance, and its stability above this level will confirm its readiness to record new gains by its rally towards $4.185, while the failure to breach it will support the dominance of the sideways bias in the current trading, and there is a chance to retest $3.620 level before reaching extra bullish target.
The expected trading range for today is between $3.780 and $4.185
Trend forecast: Bullish
Important DisclaimersFXEmpire is owned and operated by Empire Media Network LTD., Company Registration Number 514641786, registered at 7 Jabotinsky Road, Ramat Gan 5252007, Israel. The content provided on this website includes general news and publications, our personal analysis and opinions, and materials provided by third parties. This content is intended for educational and research purposes only. It does not constitute, and should not be interpreted as, a recommendation or advice to take any action, including making any investment or purchasing any product. Before making any financial decision, you should conduct your own due diligence, exercise your own discretion, and consult with competent advisors. The content on this website is not personally directed to you, and we do not take into account your individual financial situation or needs. The information contained on this website is not necessarily provided in real time, nor is it guaranteed to be accurate. Prices displayed may be provided by market makers and not by exchanges. Any trading or other financial decision you make is entirely your own responsibility, and you must not rely solely on any information provided through the website. FXEmpire does not provide any warranty regarding the accuracy, completeness, or reliability of any information contained on the website and shall bear no responsibility for any trading losses you may incur as a result of using such information. The website may include advertisements and other promotional content. FXEmpire may receive compensation from third parties in connection with such content. FXEmpire does not endorse, recommend, or assume responsibility for the use of any third-party services or websites. Empire Media Network LTD., its employees, officers, subsidiaries, and affiliates shall not be liable for any loss or damage resulting from your use of the website or reliance on the information provided herein.Risk DisclaimersThis website contains information about cryptocurrencies, contracts for difference (CFDs), and other financial instruments, as well as about brokers, exchanges, and other entities trading in such instruments. Both cryptocurrencies and CFDs are complex instruments and involve a high risk of losing money. You should carefully consider whether you understand how these instruments work and whether you can afford to take the high risk of losing your money. FX Empire encourages you to conduct your own research before making any investment decision and to avoid investing in any financial instrument unless you fully understand how it works and the risks involved.
Gold’s (XAU/USD) is trading at $4,915 at the time of writing, practically flat on the daily chart following a 4-day rally that brought price action to a fresh all-time high of $4,967. The precious metal, however, maintains its broad bullish tone intact, on track for a 6.5% weekly gain.
Precious metals remain underpinned by a weak US Dollar, as the deterioration of the US-EU relationship amid the Greenland feud has eroded the US’s image as a global leader, triggering a “Sell America” trade. Trump eased the tone toward Europe at the Davos Forum and touted an agreement with NATO on the Arctic Island, but restoring the confidence of the US’s main trade partner will be difficult.
XAU/USD has pulled back from its highs but remains above previous highs, at the $4,880 area. Technical indicators are turning lower, yet still at levels consistent with bullish momentum, with the 100-period Simple Moving Average (SMA) rising steadily, with price holding well above it.
The Moving Average Convergence Divergence (MACD) histogram in the 4-hour chart remains positive despite a moderate contraction. The Relative Strength Index (RSI) eases, pulling back from overbought levels, all in all pointing to a healthy correction following the recent sharp rally.
Bulls have been halted at the 127.2% Fiboonacci expansion of the January 16-21 rally, at the $4,970 area, ahead of the $5,000 psychological level, which is likely to challenge the strength of the current rally. On the downside, immediate support is the previous record high, at $4,888, ahead of the January 21 low of $4,775.
(The technical analysis of this story was written with the help of an AI tool.)
The table below shows the percentage change of US Dollar (USD) against listed major currencies this week. US Dollar was the strongest against the Japanese Yen.
| USD | EUR | GBP | JPY | CAD | AUD | NZD | CHF | |
|---|---|---|---|---|---|---|---|---|
| USD | -1.31% | -1.29% | 0.28% | -0.94% | -2.64% | -2.78% | -1.29% | |
| EUR | 1.31% | 0.02% | 1.60% | 0.37% | -1.35% | -1.49% | 0.02% | |
| GBP | 1.29% | -0.02% | 1.35% | 0.36% | -1.37% | -1.51% | 0.00% | |
| JPY | -0.28% | -1.60% | -1.35% | -1.20% | -2.89% | -3.02% | -1.54% | |
| CAD | 0.94% | -0.37% | -0.36% | 1.20% | -1.69% | -1.84% | -0.35% | |
| AUD | 2.64% | 1.35% | 1.37% | 2.89% | 1.69% | -0.14% | 1.39% | |
| NZD | 2.78% | 1.49% | 1.51% | 3.02% | 1.84% | 0.14% | 1.54% | |
| CHF | 1.29% | -0.02% | -0.01% | 1.54% | 0.35% | -1.39% | -1.54% |
The heat map shows percentage changes of major currencies against each other. The base currency is picked from the left column, while the quote currency is picked from the top row. For example, if you pick the US Dollar from the left column and move along the horizontal line to the Japanese Yen, the percentage change displayed in the box will represent USD (base)/JPY (quote).
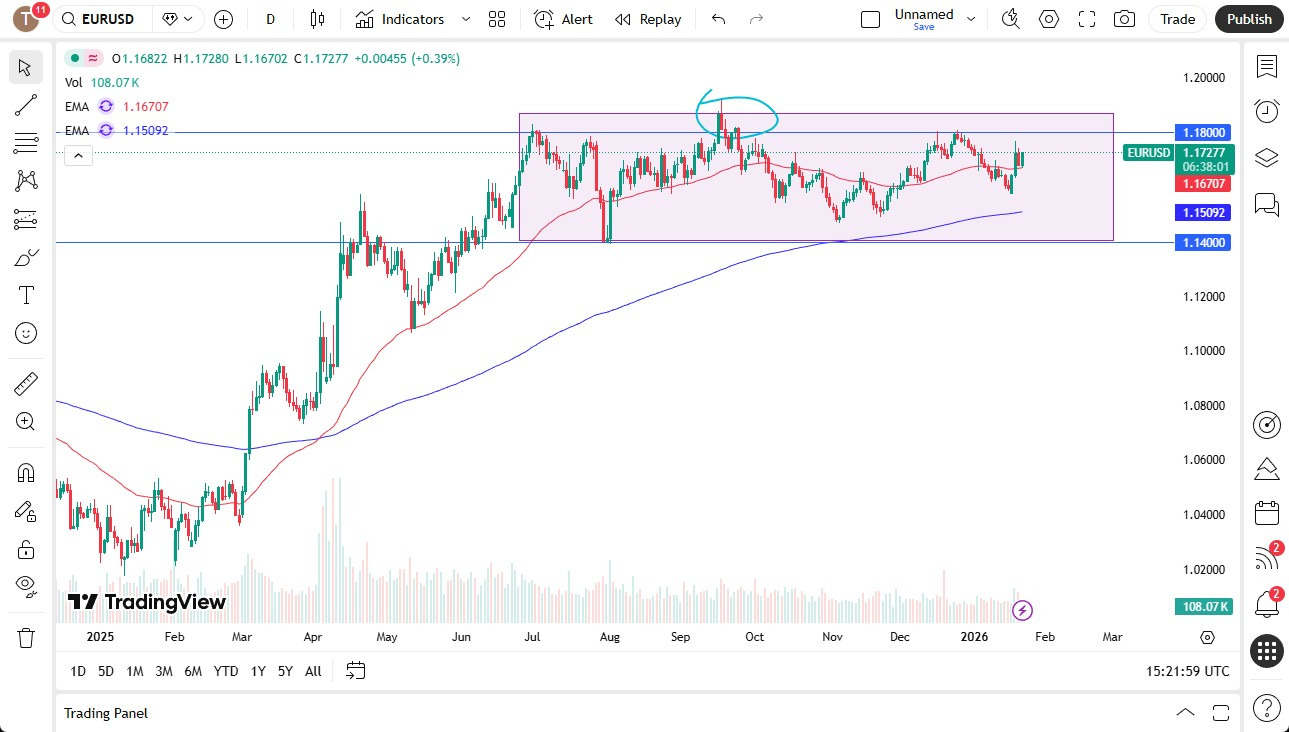
The Euro has rallied slightly during the trading session on Thursday as we continue to see a lot of consolidation just above the 50-day EMA. The question at this point in time is whether or not the US dollar will crumble, and I think there is a specific trigger price that you will more likely than not have to pay attention to.
This would be the 1.1850 level. The recent swing high and the spot on the chart that I have circled from the September Federal Reserve interest rate decision. That was when we started to get the idea that perhaps the Americans were not going to aggressively cut as everybody had anticipated.

If we can break above there, that would be a very strong sign, but as things stand right now, this is more or less a market that is stuck in a range between 1.14 and 1.1850. I do think that you are looking for signs of exhaustion to start fading again.
But if we get that move above 1.1850, then the Euro is likely to go looking to the 1.20 level after that. All things being equal, this is a market that moves very little most of the time, so the fact that it is range-bound should not be a huge surprise.
That being said, also, you could also look at this as a very well-defined range that you can play in both directions. It is worth noting that the most recent dip doesn’t seem to have been as negative as previous ones, so maybe we’re starting to lean more in the direction of the Euro. But we’ll just have to wait and see.
A lot of this will come down to US economic data, which recently has been a little softer than previously but still fairly resilient.
Ready to trade our EUR/USD analysis and predictions? Here are the best European brokers to choose from.
Christopher Lewis has been trading Forex and has over 20 years experience in financial markets. Chris has been a regular contributor to Daily Forex since the early days of the site. He writes about Forex for several online publications, including FX Empire, Investing.com, and his own site, aptly named The Trader Guy. Chris favours technical analysis methods to identify his trades and likes to trade equity indices and commodities as well as Forex. He favours a longer-term trading style, and his trades often last for days or weeks.
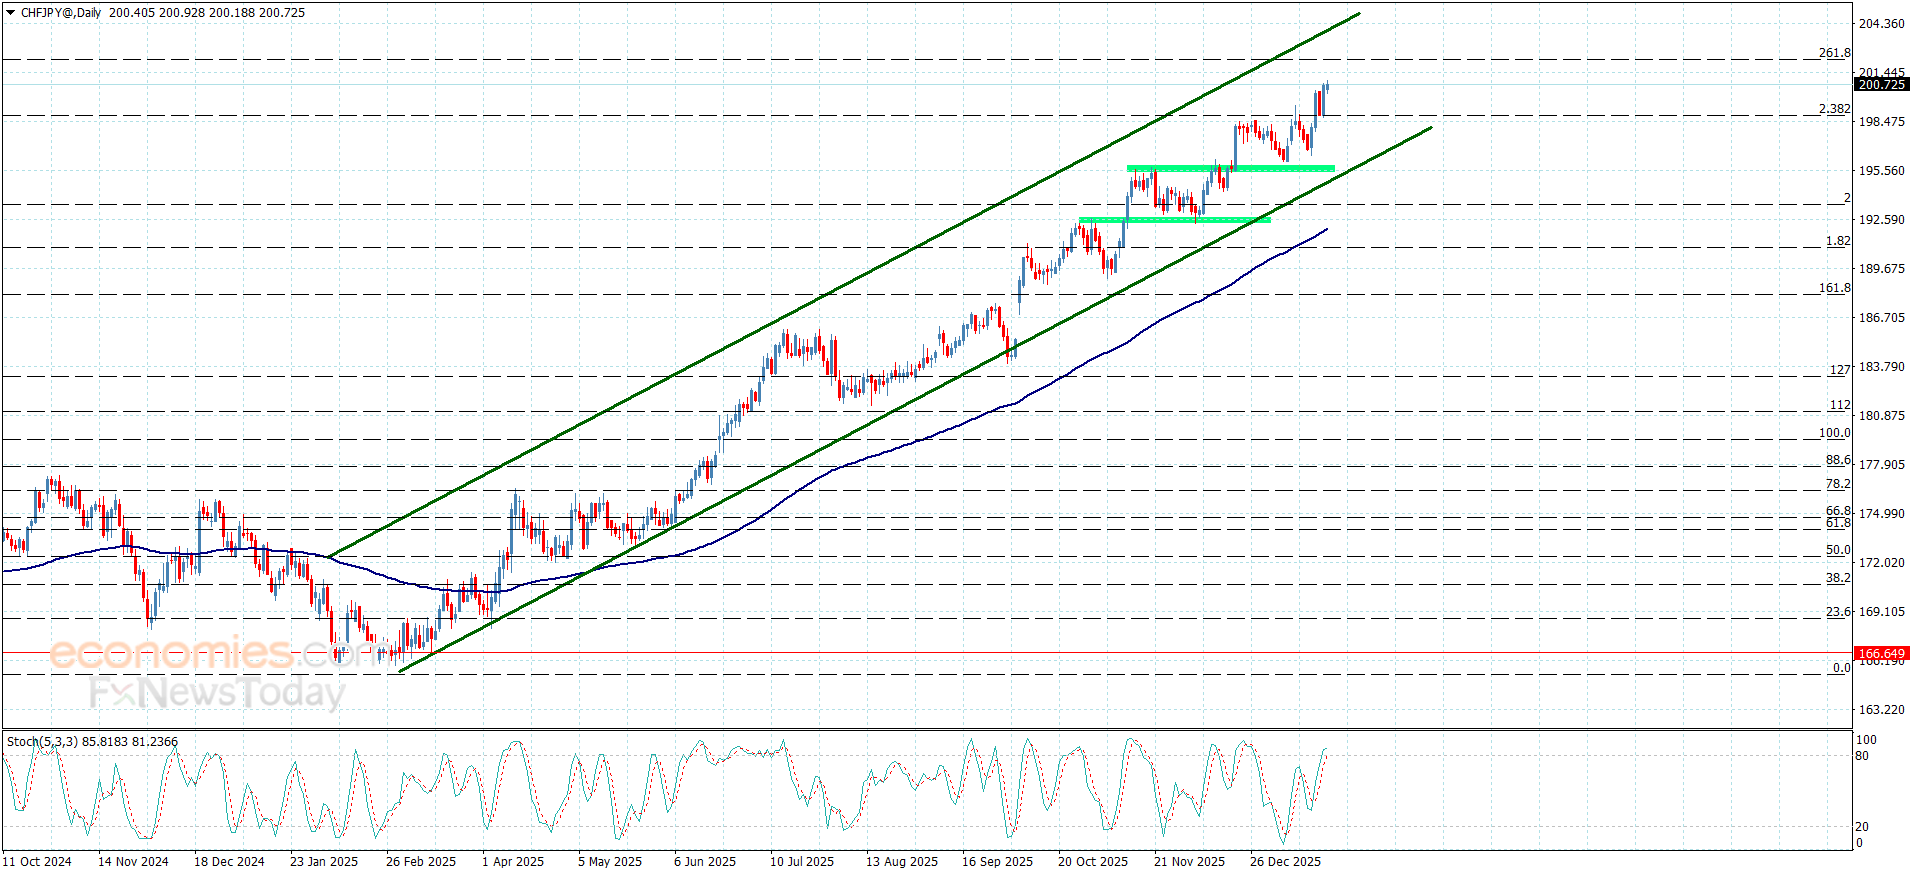
The CHFJPY succeeded in resuming the bullish trend, taking advantage of its repeated stability within the bullish channel’s levels that appears in the above image, to surpass 198.80 then targeting new historical stations by reaching 200.90 directly.
The continuation of providing bullish momentum will provide a chance for resuming the bullish attack in the near period, to expect reaching 202.15 level to form initial extra target in the current trading, where surpassing it will push the price to reach the bullish channel’s resistance at 206.65.
The expected trading range for today is between 199.35 and 2202.15
Trend forecast: Bullish
Copper price reached the initial corrective target at $5.6200, to begin forming new bullish waves, taking advantage of providing bullish momentum by stochastic, the price might begin building some bullish waves, depending on forming initial main support at $5.5100 level, which increases the chances of surpassing the barrier at $5.9700, then achieving new all time highs by its rally towards $6.1200 and $6.2100.
While the price declines below $5.5100 and holding below it will force it to provide bearish corrective trading, which forces it to suffer extra losses by reaching $5.3900 initially.
The expected trading range for today is between $5.6500 and $5.9700
Trend forecast: Bullish
Silver price (XAG/USD) extends its gains for the second successive session, trading around $99.10 per troy ounce during the Asian hours on Friday. The XAG/USD pair hit a fresh high of $99.39 amid persistent bullish bias, indicated by the technical analysis of the daily chart timeframe, as the price of the precious metal rises to near the upper boundary of the ascending channel pattern.
Silver price holds above the rising nine-day EMA, while the 50-day EMA continues to advance and underpins the medium-term trend. Trend strength is confirmed by the widening gap between the 9-day EMA and 50-day EMA, keeping bulls in control.
The 14-day Relative Strength Index (RSI) at 74.66 (overbought) flags stretched momentum that could precede consolidation. Overbought conditions could trigger a pause, but the uptrend remains intact while above the short-term average. A defended dip would keep the topside bias intact and open scope for extension above the upper ascending channel boundary around $99.80, followed by the psychological level of $100.00.
Should price pull back, initial demand could emerge near the nine-day EMA at $92.42. A daily close below the short-term average would risk a correction toward the lower boundary of the ascending channel around $82.00. Further declines would put downward pressure on the Silver price to navigate the region around the 50-day EMA at $73.14.
(The technical analysis of this story was written with the help of an AI tool.)
Silver is a precious metal highly traded among investors. It has been historically used as a store of value and a medium of exchange. Although less popular than Gold, traders may turn to Silver to diversify their investment portfolio, for its intrinsic value or as a potential hedge during high-inflation periods. Investors can buy physical Silver, in coins or in bars, or trade it through vehicles such as Exchange Traded Funds, which track its price on international markets.
Silver prices can move due to a wide range of factors. Geopolitical instability or fears of a deep recession can make Silver price escalate due to its safe-haven status, although to a lesser extent than Gold’s. As a yieldless asset, Silver tends to rise with lower interest rates. Its moves also depend on how the US Dollar (USD) behaves as the asset is priced in dollars (XAG/USD). A strong Dollar tends to keep the price of Silver at bay, whereas a weaker Dollar is likely to propel prices up. Other factors such as investment demand, mining supply – Silver is much more abundant than Gold – and recycling rates can also affect prices.
Silver is widely used in industry, particularly in sectors such as electronics or solar energy, as it has one of the highest electric conductivity of all metals – more than Copper and Gold. A surge in demand can increase prices, while a decline tends to lower them. Dynamics in the US, Chinese and Indian economies can also contribute to price swings: for the US and particularly China, their big industrial sectors use Silver in various processes; in India, consumers’ demand for the precious metal for jewellery also plays a key role in setting prices.
Silver prices tend to follow Gold’s moves. When Gold prices rise, Silver typically follows suit, as their status as safe-haven assets is similar. The Gold/Silver ratio, which shows the number of ounces of Silver needed to equal the value of one ounce of Gold, may help to determine the relative valuation between both metals. Some investors may consider a high ratio as an indicator that Silver is undervalued, or Gold is overvalued. On the contrary, a low ratio might suggest that Gold is undervalued relative to Silver.
Copper price reached the initial corrective target at $5.6200, to begin forming new bullish waves, taking advantage of providing bullish momentum by stochastic, the price might begin building some bullish waves, depending on forming initial main support at $5.5100 level, which increases the chances of surpassing the barrier at $5.9700, then achieving new all time highs by its rally towards $6.1200 and $6.2100.
While the price declines below $5.5100 and holding below it will force it to provide bearish corrective trading, which forces it to suffer extra losses by reaching $5.3900 initially.
The expected trading range for today is between $5.6500 and $5.9700
Trend forecast: Bullish
On January 20, 2026, crude oil trades nervously as WTI and Brent react to fresh geopolitical tensions and supply signals, sharpening Crude Oil Price Risk.
In early European and US trading, major benchmarks are oscillating rather than trending, with WTI and Brent both struggling to hold clear direction. This choppy tape means that a trader who is “right” on the bigger picture can still be forced out by intraday volatility if position size and margin are not handled with extreme discipline.
For risk-takers: Trade Oil volatility now
Todays oil market tone is being driven primarily by fresh news flow around supply expectations and geopolitical risk. Market participants are dissecting the latest indications from OPEC+ members about their production discipline and output plans, while also watching for any surprise commentary that could shift the balance between tightness and surplus in the months ahead. Even when there is no formal OPEC+ meeting, off-the-cuff remarks from key producers can move prices quickly as algorithms instantly re-price forward supply curves.
At the same time, traders are bracing for the next round of US inventory data, particularly crude and gasoline stockpile figures. Recent weeks have shown that surprise builds can rapidly cap rallies, while unexpected draws reignite fears of undersupply. That dynamic is visible again today in options pricing and intraday spreads: the market is clearly positioned for volatility around the next inventory release, and that uncertainty is feeding directly into intraday swings in both WTI and Brent.
Layered on top are ongoing geopolitical tensions in key producing and transit regions. Even without a fresh headline shock today, the risk premium from earlier disruptions and security concerns remains embedded in prices, keeping traders on edge. Shipping routes, infrastructure security, and sanctions policy are all under continuous scrutiny, and markets know that a single unexpected event can add dollars to the barrel price within minutes.
Many traders come into days like this armed with an Oil Price Forecast based on macro data, central bank expectations, and seasonal demand patterns. However, today underlines how fragile those forecasts can be when they meet real-time order flow, OPEC+ comments, and inventory surprises. A forecast that looked sensible yesterday evening can be out of date within hours if the next headline shifts expectations for supply or demand.
Energy Trading desks are therefore focusing less on fixed directional calls and more on risk management and scenario planning. Key questions include: how will prices react if US stockpiles show a larger-than-expected build, or if a major producer signals discomfort with current price levels? What happens to spread relationships between WTI and Brent if regional disruptions hit one benchmark harder than the other? The answers will not just move outright prices; they will also ripple through refining margins, crack spreads, and correlated assets such as energy equities and high-yield credit.
For those looking to Buy WTI Oil or trade Brent Price Live, today is an object lesson that direction alone is not enough. Volatility itself has become the core product, and effective participation requires precise control of leverage, stop-loss discipline, and realistic expectations about intraday drawdowns.
Crude oil is structurally exposed to sudden, binary geopolitical events. Attacks on infrastructure, unexpected sanctions decisions, or abrupt policy shifts by key producers can all trigger market gaps price jumps that occur between sessions or across illiquid periods, offering no chance to exit at intermediate levels. In such conditions, stops may fill far worse than expected, or not at all at the desired price, especially in highly leveraged CFD or derivative positions.
That gap risk is a central feature of Crude Oil Price Risk, not a rare exception. Even on a day like today, when markets may appear merely choppy rather than outright panicked, traders are effectively sitting on optionality: the constant possibility that a headline emerging from the Middle East, Eastern Europe, or a key shipping chokepoint could instantly reprice both WTI and Brent. This is doubly relevant for Energy Trading strategies that are heavily margined or concentrated in a single direction.
Because CFDs and other leveraged products magnify both gains and losses, a relatively modest adverse move in the underlying can wipe out the entire margin posted for the position. In volatile days, that margin can be consumed in minutes. Traders who ignore position sizing, correlation risk, and basic scenario analysis are effectively exposed to the possibility of a Total Loss of their invested capital.
Prudent participants therefore treat todays environment with caution: they stress-test positions against sudden $3$5 moves in crude, consider the impact of overnight gaps, and avoid assuming that current liquidity conditions will always allow a smooth exit. For those who instead want to embrace the turbulence, the key is to recognize that this is not a normal equity swing; crude oil is a globally strategic commodity whose price can be repriced by politics as quickly as by economics.
Ultimately, the combination of uncertain OPEC+ supply signals, upcoming inventory data, and ever-present geopolitical fragility means that Crude Oil Price Risk is elevated today, even if spot moves over the session end up looking modest on a percentage basis. The real story is the path, not just the destination and that path is jagged.
Risk Warning: Financial instruments, especially commodity CFDs, are complex and come with a high risk of losing money rapidly due to leverage. You should consider whether you understand how these instruments work and whether you can afford to take the high risk of losing your money. This content is for informational purposes only and does not constitute investment advice.