The main category of All News Articles.
You can use the search box below to find what you need.
[wd_asp id=1]
The main category of All News Articles.
You can use the search box below to find what you need.
[wd_asp id=1]
Bitcoin (BTC) price surged
past $93,000 on Monday, January 5, 2026, marking the fifth consecutive session
of gains across major cryptocurrencies. Ethereum climbed to $3,162, XRP tested
$2.14, and Dogecoin rallied following a breakout from its bearish channel.
The total
crypto market capitalization climbed above $3.01 trillion, driven by stronger
investor sentiment, slowing ETF outflows, and renewed interest from
institutional players. This early-2026 momentum shows a stark reversal from the
disappointing fourth-quarter performance that saw excessive leverage unwound
and sentiment reset.
Why are cryptocurrencies rising today? What are the
latest price forecasts, and what does technical analysis show for the BTC/USDT,
XRP/USDT, ETH/USDT, and DOGE/USDT charts? This article takes a closer look.
“Cryptocurrency
markets are in the green as investors add digital gold to their portfolios amid
positioning for the year ahead,” explains Petr Kozyakov, Co-Founder and
CEO at Mercuryo. The payment infrastructure leader notes that Bitcoin’s push
past $92,000 has led the market higher alongside gains in Ethereum and Solana.
Kozyakov
highlights a notable shift in market dynamics: “A shift in mood across the
digital token space has been underlined by a resurgence in interest in the meme
coin sector, with Shiba Inu and Pepe making a loud entry to 2026.” Beyond meme coin speculation, the cryptocurrency industry is experiencing a broader transformation as market structure reform and legislative architecture take precedence over pure price action, with stablecoin capitalization hitting $312.63 billion in December 2025.
Despite the
severe drop in sentiment during the final months of 2025, he emphasizes that
“fundamentals in the sector remain strong as the underlying infrastructure
evolves with assets such as stablecoins continuing to attract increasing levels
of liquidity.”
Joel
Kruger, crypto strategist at LMAX, provides important context for the recovery.
“The crypto market delivered an undeniably disappointing fourth-quarter
performance,” he acknowledges, noting frustration given that Bitcoin and
ETH had already reached fresh record highs earlier in 2025 alongside
significant regulatory and adoption progress.
However,
Kruger views the pullback constructively: “The weaker headline performance
can also be viewed as a healthy reset. The pullback helped unwind overleveraged
positions and clear excess froth, a necessary process that often improves
market structure and supports more sustainable upside over time.”
It’s also certainly relevant what’s happening in Venezuela and Donald Trump’s “war on oil.” But what do the charts say?
Bitcoin
briefly touched $93,000 on Monday, with Yahoo Finance data showing an intraday
high of $93,155 and closing at $92,798. The world’s largest cryptocurrency is
trading at its highest level in nearly one month, up over 2% in the last 24
hours. However, my technical analysis reveals Bitcoin remains trapped in a
nearly two-month consolidation between $84,000 and $94,000.
Why Bitcoin
price is going up today? Source: Tradingview.com
|
Support Zones |
Resistance Zones |
|
$88,000 (major downside invalidation) |
$94,800-$95,500 (descending trendline) |
|
$90,000-$92,000 |
$100,000 (200 EMA, bull confirmation) |
|
$84,000-$87,000 (consolidation floor) |
$103,000 (trend separator) |
|
$74,000 (bear target, 161.8% Fibo) |
$126,000 (October ATH) |
The price
action shows Bitcoin testing the upper boundary of its range, defined by the
50-day moving average and 100% Fibonacci extension near $92,000-$94,000. On the
daily chart, Bitcoin continues moving in an increasingly narrowing wedge
pattern, with the lower boundary rising since mid-December from around $80,500.
“BTC
has been respecting a descending trendline for weeks. Price recently tested
this trendline near 94,800 and showed a reaction,” observes Areeb Khan
from Traders’ Hub. He identifies several key technical observations:
Khan’s Technical Breakdown:
Khan
provides specific levels to monitor: “Resistance: 94,800-95,500. Support:
92,000 going down to 90,000. Major downside invalidation below 88,000.” He
warns that “a clean breakout and hold above the trendline could shift
short-term structure bullish. Rejection here keeps BTC in a range-to-bearish
continuation setup.”
Despite the
bullish momentum, Bitcoin remains below its 200-day exponential moving average,
which resides above $103,000 and represents the separator between uptrend and
downtrend. My
bearish scenario targets $74,000, representing 2025 yearly lows last tested
in April and confirmed by the 161.8% Fibonacci extension.
If you like my work, please also check previous crypto analyses and follow me on X:
Ethereum (ETH) gained 0.7% on
Monday to reach $3,168, with CoinGecko data showing current trading at $3,162.
The second-largest cryptocurrency is testing its fifth consecutive rising
session and three-week highs, breaking above its 50-day exponential moving
average for the first time in nearly a month. Below is how I see it.
Why Ethereum
price is going up today? Source: Tradingview.com
Ethereum’s Technical Position:
The price
has stopped at local resistance around the 50% Fibonacci retracement level near
$3,200, which coincides with resistance formed by local lows from early
November. This represents a critical juncture, as Ethereum briefly traded close
to $3,010 at the start of 2026 before accelerating higher.
However,
medium-term technical factors remain bearish. Both
moving averages formed a death cross pattern in late November, and the
price continues moving below the 200-day EMA. The main resistance zone between
$3,350 and $3,400 remains untouched, representing a formidable barrier for
bulls.
Ethereum is
consolidating between this upper resistance zone and support defined by
November-December lows in the $2,650-$2,800 range, reinforced by the 61.8%
Fibonacci retracement.
In a
sideways movement, price can move both up and down, but the overall my chart
structure suggesting continuation of declines targets June lows at $2,200 and
ultimately 2025 yearly minimums around $1,400 last tested in April.
XRP is trading at $2.14,
marking its fifth consecutive rising session and the highest value since early
December. The cryptocurrency gained over 2% during Monday’s session, with
intraday highs testing $2.16 before pulling back slightly.
Why XRP
price is going up today? Source: Tradingview.com
The
positive development for XRP is its breakout from the bearish regression
channel drawn from July highs, which had been tested multiple times from both
below and above. This dynamic breakout saw the price distance itself
significantly from the channel, providing technical confirmation that selling
pressure may be exhausting.
|
Level |
Significance |
Status |
|
$2.35 |
200 EMA (ultimate confirmation) |
Not reached |
|
$2.20-$2.30 |
Resistance zone (breakout confirmation) |
Testing |
|
$2.14 |
Current price |
Fifth rising session |
|
$1.80-$1.83 |
Consolidation support |
Holding |
|
$1.61 |
April minimums (bear target) |
Risk level |
|
$1.25 |
Extreme scenario |
However,
caution is warranted. A similar breakout was observed in early October, but the
price subsequently returned to the channel range. The ultimate confirmation of
the breakout requires XRP to return above the resistance zone between $2.20 and
$2.30, and most importantly above the 200 EMA at $2.35.
XRP remains
in a trend structure similar to Bitcoin and Ethereum, moving below the 200 EMA
(downtrend) and in a consolidation drawn since late November at medium-term
lows.
Until the
breakout is confirmed, the possibility remains of a return to the lower
consolidation boundary with support at $1.80-$1.83.
If you want to trade Bitcoin, XRP and others, check out the 5 best CFD crypto brokers in 2026.
Dogecoin (DOGE) experienced
four consecutive days of gains, testing the highest level since late November
before pulling back 1.2% to $0.1477 at the time of writing.
The meme
coin has stopped at the upper boundary of its current consolidation at the
lowest levels since October 2024.
Why Dogecoin
price is going up today? Source: Tradingview.com
Dogecoin Technical Structure:
This
resistance level coincides with the 50 EMA and minimums from June, April, and
March 2025. The lower consolidation boundary is defined by lows from the turn
of 2025/2026 around $0.11-$0.12.
The meme
coin resurgence extends beyond Dogecoin. Market data shows renewed interest in
Shiba Inu and Pepe, with the broader meme coin sector experiencing a
retail-driven rally in early 2026 after languishing through much of 2025.
If current
resistance at $0.15 holds, my favored scenario is a downward movement and
retest of the $0.11 area, or
even $0.10 representing 2025 yearly minimums from the October flash crash.
Crypto is
surging due to year-ahead portfolio positioning, Q4 2025 sentiment reset
completion (deleveraging and excess froth clearing), meme coin sector
resurgence, strong fundamentals in infrastructure evolution, and stablecoin
liquidity growth. Kozyakov from Mercuryo notes investors are adding
“digital gold” to portfolios amid 2026 positioning. Bitcoin,
Ethereum, XRP and Dogecoin all posted fifth consecutive rising sessions on
January 5, 2026.
Bitcoin
tested $93,155 intraday, representing one-month highs, as traders positioned
for 2026 amid improved sentiment. The rally tests critical resistance at
$94,800-$95,000 where descending trendline and 50 MA converge, according to
Areeb Khan from Traders’ Hub. Joel Kruger identifies sustained hold above
$95,000 as key technical signal for broader uptrend resumption toward record
highs.
Ethereum’s
fifth rising session brought price to $3,168, testing 50% Fibonacci retracement
at $3,200 after breaking above 50 EMA for first time in nearly a month.
However, death cross remains active since late November, and major resistance
zone at $3,350-$3,400 stays untouched.
XRP gained
over 2% to test $2.16 intraday (fifth consecutive rising session), reaching
highest levels since early December after breaking bearish regression channel
from July highs. However, confirmation requires sustained move above
$2.20-$2.30 resistance and 200 EMA at $2.35, as similar October breakout proved
false.
Dogecoin
broke bearish regression channel dynamically, testing $0.1477 at upper
consolidation boundary representing late November highs. Mercuryo’s Kozyakov
notes meme coin sector experiencing resurgence with Shiba Inu and Pepe leading
2026 entry. However, resistance at $0.15 (50 EMA) remains untested with risk of
return to $0.11-$0.12 support zone.
Technical
analysis shows Bitcoin, Ethereum and XRP still in consolidation below 200 EMAs
with death crosses active for Bitcoin and Ethereum since late November. Kruger
from LMAX characterizes the Q4 pullback as a “healthy reset” that
unwound overleveraged positions and improved market structure, but sustained
breakouts above key resistance levels are needed for trend reversal
confirmation.
Bitcoin (BTC) price surged
past $93,000 on Monday, January 5, 2026, marking the fifth consecutive session
of gains across major cryptocurrencies. Ethereum climbed to $3,162, XRP tested
$2.14, and Dogecoin rallied following a breakout from its bearish channel.
The total
crypto market capitalization climbed above $3.01 trillion, driven by stronger
investor sentiment, slowing ETF outflows, and renewed interest from
institutional players. This early-2026 momentum shows a stark reversal from the
disappointing fourth-quarter performance that saw excessive leverage unwound
and sentiment reset.
Why are cryptocurrencies rising today? What are the
latest price forecasts, and what does technical analysis show for the BTC/USDT,
XRP/USDT, ETH/USDT, and DOGE/USDT charts? This article takes a closer look.
“Cryptocurrency
markets are in the green as investors add digital gold to their portfolios amid
positioning for the year ahead,” explains Petr Kozyakov, Co-Founder and
CEO at Mercuryo. The payment infrastructure leader notes that Bitcoin’s push
past $92,000 has led the market higher alongside gains in Ethereum and Solana.
Kozyakov
highlights a notable shift in market dynamics: “A shift in mood across the
digital token space has been underlined by a resurgence in interest in the meme
coin sector, with Shiba Inu and Pepe making a loud entry to 2026.” Beyond meme coin speculation, the cryptocurrency industry is experiencing a broader transformation as market structure reform and legislative architecture take precedence over pure price action, with stablecoin capitalization hitting $312.63 billion in December 2025.
Despite the
severe drop in sentiment during the final months of 2025, he emphasizes that
“fundamentals in the sector remain strong as the underlying infrastructure
evolves with assets such as stablecoins continuing to attract increasing levels
of liquidity.”
Joel
Kruger, crypto strategist at LMAX, provides important context for the recovery.
“The crypto market delivered an undeniably disappointing fourth-quarter
performance,” he acknowledges, noting frustration given that Bitcoin and
ETH had already reached fresh record highs earlier in 2025 alongside
significant regulatory and adoption progress.
However,
Kruger views the pullback constructively: “The weaker headline performance
can also be viewed as a healthy reset. The pullback helped unwind overleveraged
positions and clear excess froth, a necessary process that often improves
market structure and supports more sustainable upside over time.”
It’s also certainly relevant what’s happening in Venezuela and Donald Trump’s “war on oil.” But what do the charts say?
Bitcoin
briefly touched $93,000 on Monday, with Yahoo Finance data showing an intraday
high of $93,155 and closing at $92,798. The world’s largest cryptocurrency is
trading at its highest level in nearly one month, up over 2% in the last 24
hours. However, my technical analysis reveals Bitcoin remains trapped in a
nearly two-month consolidation between $84,000 and $94,000.
Why Bitcoin
price is going up today? Source: Tradingview.com
|
Support Zones |
Resistance Zones |
|
$88,000 (major downside invalidation) |
$94,800-$95,500 (descending trendline) |
|
$90,000-$92,000 |
$100,000 (200 EMA, bull confirmation) |
|
$84,000-$87,000 (consolidation floor) |
$103,000 (trend separator) |
|
$74,000 (bear target, 161.8% Fibo) |
$126,000 (October ATH) |
The price
action shows Bitcoin testing the upper boundary of its range, defined by the
50-day moving average and 100% Fibonacci extension near $92,000-$94,000. On the
daily chart, Bitcoin continues moving in an increasingly narrowing wedge
pattern, with the lower boundary rising since mid-December from around $80,500.
“BTC
has been respecting a descending trendline for weeks. Price recently tested
this trendline near 94,800 and showed a reaction,” observes Areeb Khan
from Traders’ Hub. He identifies several key technical observations:
Khan’s Technical Breakdown:
Khan
provides specific levels to monitor: “Resistance: 94,800-95,500. Support:
92,000 going down to 90,000. Major downside invalidation below 88,000.” He
warns that “a clean breakout and hold above the trendline could shift
short-term structure bullish. Rejection here keeps BTC in a range-to-bearish
continuation setup.”
Despite the
bullish momentum, Bitcoin remains below its 200-day exponential moving average,
which resides above $103,000 and represents the separator between uptrend and
downtrend. My
bearish scenario targets $74,000, representing 2025 yearly lows last tested
in April and confirmed by the 161.8% Fibonacci extension.
If you like my work, please also check previous crypto analyses and follow me on X:
Ethereum (ETH) gained 0.7% on
Monday to reach $3,168, with CoinGecko data showing current trading at $3,162.
The second-largest cryptocurrency is testing its fifth consecutive rising
session and three-week highs, breaking above its 50-day exponential moving
average for the first time in nearly a month. Below is how I see it.
Why Ethereum
price is going up today? Source: Tradingview.com
Ethereum’s Technical Position:
The price
has stopped at local resistance around the 50% Fibonacci retracement level near
$3,200, which coincides with resistance formed by local lows from early
November. This represents a critical juncture, as Ethereum briefly traded close
to $3,010 at the start of 2026 before accelerating higher.
However,
medium-term technical factors remain bearish. Both
moving averages formed a death cross pattern in late November, and the
price continues moving below the 200-day EMA. The main resistance zone between
$3,350 and $3,400 remains untouched, representing a formidable barrier for
bulls.
Ethereum is
consolidating between this upper resistance zone and support defined by
November-December lows in the $2,650-$2,800 range, reinforced by the 61.8%
Fibonacci retracement.
In a
sideways movement, price can move both up and down, but the overall my chart
structure suggesting continuation of declines targets June lows at $2,200 and
ultimately 2025 yearly minimums around $1,400 last tested in April.
XRP is trading at $2.14,
marking its fifth consecutive rising session and the highest value since early
December. The cryptocurrency gained over 2% during Monday’s session, with
intraday highs testing $2.16 before pulling back slightly.
Why XRP
price is going up today? Source: Tradingview.com
The
positive development for XRP is its breakout from the bearish regression
channel drawn from July highs, which had been tested multiple times from both
below and above. This dynamic breakout saw the price distance itself
significantly from the channel, providing technical confirmation that selling
pressure may be exhausting.
|
Level |
Significance |
Status |
|
$2.35 |
200 EMA (ultimate confirmation) |
Not reached |
|
$2.20-$2.30 |
Resistance zone (breakout confirmation) |
Testing |
|
$2.14 |
Current price |
Fifth rising session |
|
$1.80-$1.83 |
Consolidation support |
Holding |
|
$1.61 |
April minimums (bear target) |
Risk level |
|
$1.25 |
Extreme scenario |
However,
caution is warranted. A similar breakout was observed in early October, but the
price subsequently returned to the channel range. The ultimate confirmation of
the breakout requires XRP to return above the resistance zone between $2.20 and
$2.30, and most importantly above the 200 EMA at $2.35.
XRP remains
in a trend structure similar to Bitcoin and Ethereum, moving below the 200 EMA
(downtrend) and in a consolidation drawn since late November at medium-term
lows.
Until the
breakout is confirmed, the possibility remains of a return to the lower
consolidation boundary with support at $1.80-$1.83.
If you want to trade Bitcoin, XRP and others, check out the 5 best CFD crypto brokers in 2026.
Dogecoin (DOGE) experienced
four consecutive days of gains, testing the highest level since late November
before pulling back 1.2% to $0.1477 at the time of writing.
The meme
coin has stopped at the upper boundary of its current consolidation at the
lowest levels since October 2024.
Why Dogecoin
price is going up today? Source: Tradingview.com
Dogecoin Technical Structure:
This
resistance level coincides with the 50 EMA and minimums from June, April, and
March 2025. The lower consolidation boundary is defined by lows from the turn
of 2025/2026 around $0.11-$0.12.
The meme
coin resurgence extends beyond Dogecoin. Market data shows renewed interest in
Shiba Inu and Pepe, with the broader meme coin sector experiencing a
retail-driven rally in early 2026 after languishing through much of 2025.
If current
resistance at $0.15 holds, my favored scenario is a downward movement and
retest of the $0.11 area, or
even $0.10 representing 2025 yearly minimums from the October flash crash.
Crypto is
surging due to year-ahead portfolio positioning, Q4 2025 sentiment reset
completion (deleveraging and excess froth clearing), meme coin sector
resurgence, strong fundamentals in infrastructure evolution, and stablecoin
liquidity growth. Kozyakov from Mercuryo notes investors are adding
“digital gold” to portfolios amid 2026 positioning. Bitcoin,
Ethereum, XRP and Dogecoin all posted fifth consecutive rising sessions on
January 5, 2026.
Bitcoin
tested $93,155 intraday, representing one-month highs, as traders positioned
for 2026 amid improved sentiment. The rally tests critical resistance at
$94,800-$95,000 where descending trendline and 50 MA converge, according to
Areeb Khan from Traders’ Hub. Joel Kruger identifies sustained hold above
$95,000 as key technical signal for broader uptrend resumption toward record
highs.
Ethereum’s
fifth rising session brought price to $3,168, testing 50% Fibonacci retracement
at $3,200 after breaking above 50 EMA for first time in nearly a month.
However, death cross remains active since late November, and major resistance
zone at $3,350-$3,400 stays untouched.
XRP gained
over 2% to test $2.16 intraday (fifth consecutive rising session), reaching
highest levels since early December after breaking bearish regression channel
from July highs. However, confirmation requires sustained move above
$2.20-$2.30 resistance and 200 EMA at $2.35, as similar October breakout proved
false.
Dogecoin
broke bearish regression channel dynamically, testing $0.1477 at upper
consolidation boundary representing late November highs. Mercuryo’s Kozyakov
notes meme coin sector experiencing resurgence with Shiba Inu and Pepe leading
2026 entry. However, resistance at $0.15 (50 EMA) remains untested with risk of
return to $0.11-$0.12 support zone.
Technical
analysis shows Bitcoin, Ethereum and XRP still in consolidation below 200 EMAs
with death crosses active for Bitcoin and Ethereum since late November. Kruger
from LMAX characterizes the Q4 pullback as a “healthy reset” that
unwound overleveraged positions and improved market structure, but sustained
breakouts above key resistance levels are needed for trend reversal
confirmation.
Copper price kept the positive stability above $5.5100 support in the last trading, to rally towards the initial target at $5.8100, taking advantage of stochastic stability within the overbought level.
The continuation of the pressure on $5.8100 level might allow it find an exit for resuming the bullish attack, to expect breaching $5.9700 to extend the trading towards the bullish channel’s resistance at $6.1700 level.
The expected trading range for today is between $5.6100 and $5.9700
Trend forecast: Bullish
The EUR/USD pair ended the week in the red last week as many investors remained in a holiday mood. It was trading at 1.1720, down slightly from last year’s high of 1.1910 ahead of key events this week.

The EUR/USD exchange rate will likely be volatile this week as investors react to the upcoming US Non-Farm Payrolls (NFP) data, which are scheduled on Friday.
The report is expected to show that the American economy added over 55k jobs in December after adding 64k in the previous month. Most notably, the report is expected to show that manufacturing jobs continued falling, mostly because of Donald Trump’s tariffs.
Economists expect the upcoming report to show that the unemployment rate dropped to 4.5% in December from the previous 4.6%. The unemployment rate has jumped in the past few months because of Donald Trump’s policy to purge thousands of government workers.
The upcoming jobs report comes a week after the Federal Reserve published minutes of the last monetary policy meeting. These minutes showed that most officials hinted that they were supportive of interest rate cuts if the country’s inflation continues falling.
The EUR/USD pair will also react mildly to the weekend events in which Donald Trump invaded Venezuela, took its leader, and charged him in a New York court. While Venezuela has vast oil resources, the amount of oil it ships to other countries is relatively lower than other countries.
The other major catalysts for the EUR/USD pair will be the upcoming macro data from Europe and the United States. For example, the ISM will publish the latest manufacturing PMI numbers, which will provide more data on the state of the sector.
Also, Eurostat will release the latest consumer price index (CPI) data on Wednesday, which will provide more information about the state of inflation and hints on what to expect from the European Central Bank.
The weekly chart shows that the EUR/USD pair has remained in a tight range in the past few weeks. It was trading at 1.1720 on Friday, down slightly from last month’s high of 1.1806.
The pair has remained slightly above the 50-week and 25-week Exponential Moving Averages (EMA), a sign that the bullish trend will continue. It has also remained above the Supertrend indicator.
However, a closer look shows that it has formed a double-top pattern at 1.1800 and a neckline at 1.1466. It also remains at the ultimate resistance level of the Murrey Math Lines tool.
Therefore, there is a likelihood that the pair will retreat this week as investors price in geopolitical risks. If this happens, it may drop to the key support level at 1.1600. A move above the resistance at 1.1800 will invalidate the bearish outlook.
Ready to trade our Weekly Forex forecast? Check out our list of the best Forex brokers in the world.
Dr Neetu Kumra Taneja, Food Microbiologist and Biotechnologist, Associate Professor (Microbiology) and Associate Head Centre for Food Research and Analysis (CFRA), NIFTEM, Kundli
Are traditional fermented foods enough for gut health today?
They can be often very helpful but they’re not a one-size-fits-all solution. Traditional fermented foods (curd/yoghurt, kefir, lassi, fermented vegetables) supply live microbes, fermented metabolites and food matrix benefits (fiber, vitamins, peptides) that can modify the gut microbiome and improve bowel function and some health outcomes. Eating traditional fermented foods regularly is a low risky way to support gut health especially as part of a fiber-rich diet but may not replace targeted therapeutic approaches for specific clinical conditions.
Does India need daily supplementation or only therapeutic usage?
Most Indians do not universally require daily probiotic supplements, dietary approaches should come first, although targeted supplementation is appropriate for specific conditions or populations. Promote fermented foods and prebiotic fibers broadly; reserve daily probiotic supplements for therapeutic uses or when a clinician recommends them.
What do you think most Indians prefer right now? Curd or a capsule?
Curd/yoghurt (and fermented foods/drinks) remain more commonly consumed, but supplement use is the fastest-growing segment. If you’re designing an intervention or product in India, fermented-food formats reach broader audiences and supplements are attractive to niche/urban markets and growth investors.
Is curd/yogurt clinically comparable to a probiotic capsule?
Yes, sometimes for certain outcomes and no for others. It depends on strain, dose, product viability and the clinical endpoint. For general gut wellness, good-quality yogurt/curd helps and can be comparable; for targeted clinical therapy (specific strains/doses), capsules often offer better control.
Are CFU numbers just marketing?
No — CFU matters, but they’re only one part of the story and can be misused in marketing. A high CFU is meaningful if paired with proven strains, proper formulation, and clear shelf-life claims otherwise it can be marketing noise. One should look for (a) named strains, (b) clinical evidence for that strain/dose, and (c) a guaranteed CFU at end-of-shelf-life and not just a big CFU number on the label.
What format will dominate India in the next 5 years?
A mixed market, fermented foods and functional dairy will remain dominant in reach, while supplements and value-added functional beverages will grow fastest and gain market share in urban places.
Mainstream = food/dairy formats; fastest growth & investor interest = supplements and novel beverages.
Future of gut health — dairy + supplements coexist or compete?
Coexistence with complementary roles. Dairy and traditional ferments will continue as culturally embedded, affordable, daily strategies to support gut health. Supplements will grow as therapeutic, targeted, or convenience options.
Mansi Jamsudkar Padvekar
1: Why could Dogecoin hit a new low in early 2026?
Dogecoin faces pressure from weak market liquidity, high interest rates, fading hype, and selling risk from large holders.
2: Does Bitcoin affect Dogecoin price movement?
Dogecoin usually follows Bitcoin trends, and a weak Bitcoin market often leads to deeper losses for meme coins.
3: Is Dogecoin still popular among investors?
Dogecoin still has a strong community, but investor interest has slowed compared to earlier hype-driven cycles.
4: How does Dogecoin supply impact its price?
Dogecoin has no fixed supply cap, so new coins enter the market each year, adding ongoing selling pressure.
5: What could help Dogecoin avoid a new low?
A strong crypto market recovery, interest rate cuts, renewed hype, or large buying activity could support the price.
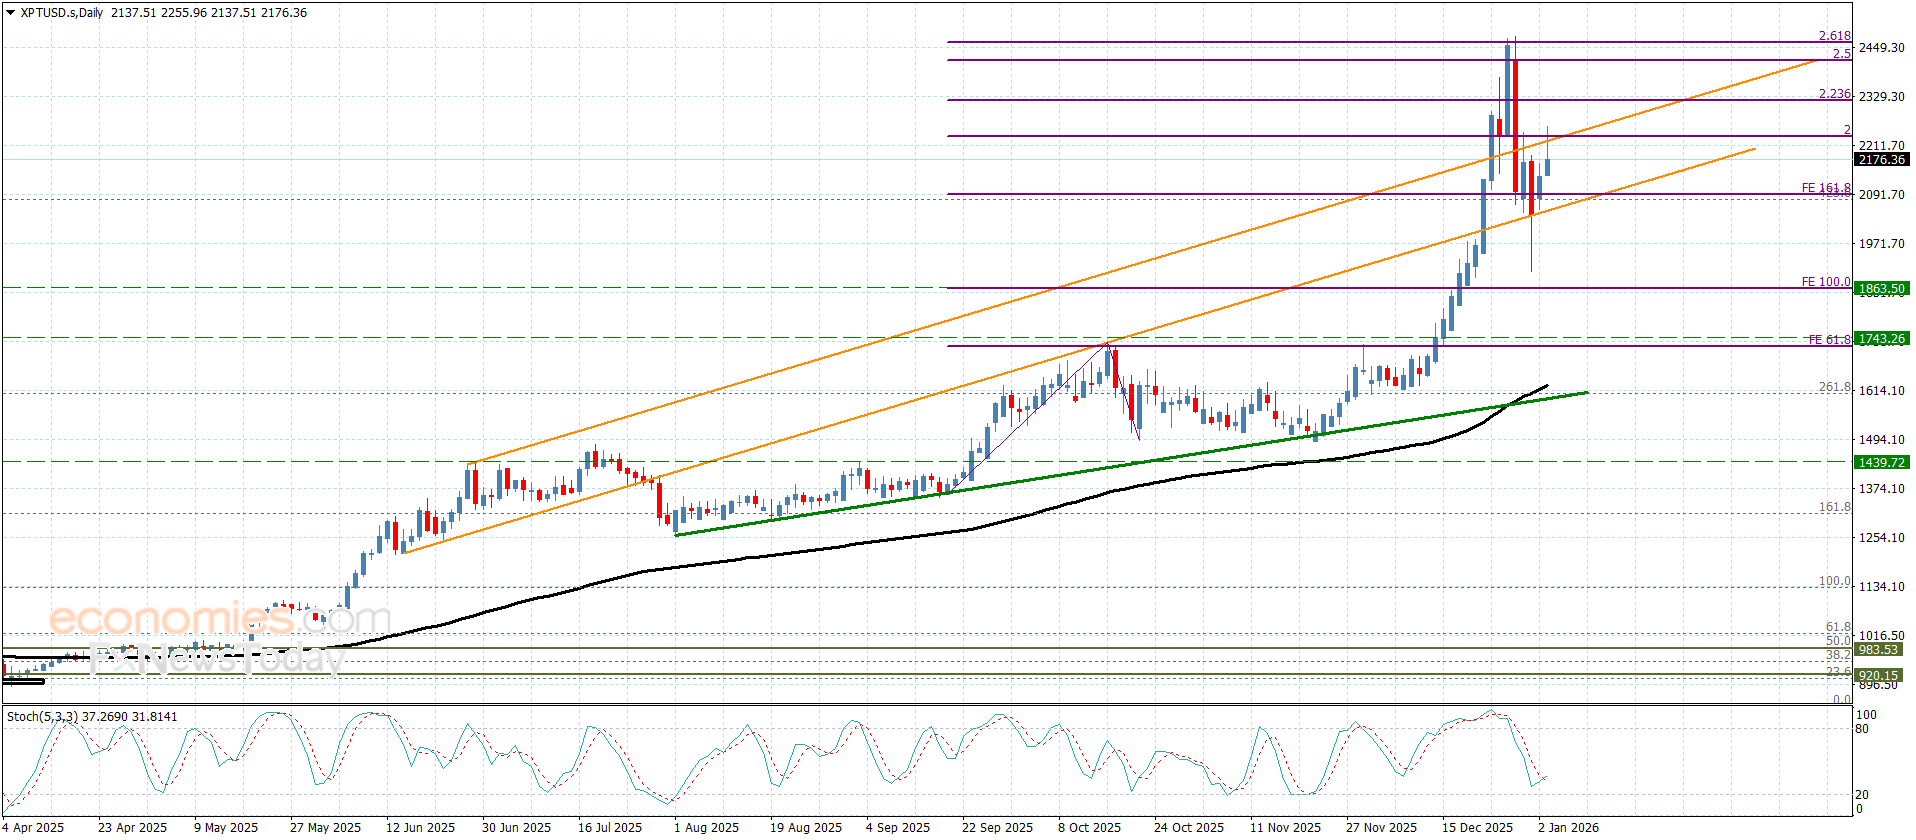
Platinum price ended the bearish corrective attack by targeting $1905.00 level, forming key liquidity sweep zones, enabling it to renew the bullish rally to reach $2255.00 level, announcing the continuation of the main bullish scenario.
To confirm gathering extra bullish momentum to ease the mission of holding above $2235.00 level is important to reinforce the chances of recording new gains by its rally towards $2325.00 reaching the next barrier near $2415.00.
The expected trading range for today is between $2095.00 and $2290.00
Trend forecast: Bullish
The Sterling has failed, once again, to break above the resistance area at 211.50, where it was capped on December 22 and 26, and is trading lower on Monday. Technical indicators hint at a weaker bullish momentum, although the pair has not shown a clear sign of a trend shift as of yet.
In the fundamental front, the Bank of Japan’s (BoJ) Governor, Kazuho Ueda, has reiterated the central bank’s commitment to keep tightening its monetary policy if its economic projections are met. This, coupled with a broader GBP weakness, is keeping the pair on the back foot on Monday.
In the 4-hour chart, GBP/JPY trades at 210.88, posting moderate losses on the daily chart after rejection at the 211.50 area on Friday.
Technical indicators show are heading lower. The Relative Strength Index (RSI) is testing levels below the key 50 line, showing some bearish divergence with price action. The Moving Average Convergence Divergence (MACD) turns marginally negative near the zero line, and the MACD line slips below the Signal line, highlighting a fading momentum.
Trendline support is now at the 210.50 area, but a decline below 210.05 (December 24 low) would be needed to confirm a triple top in the 211.50 area and signal a trend shift. The next downside targets would be the November 9 and 1o highs, at 208.90, and the December 19 low, near 208.00.
On the upside, above the long-term high, at 211.59 (December 22 high), the potential targets are the 127.2% Fibonacci extension of the December 15 to December 22 rally, at 212.75, and the 161.8% extension of the same cycle, at 214.38,.
(The technical analysis of this story was written with the help of an AI tool)
The table below shows the percentage change of British Pound (GBP) against listed major currencies today. British Pound was the strongest against the Canadian Dollar.
| USD | EUR | GBP | JPY | CAD | AUD | NZD | CHF | |
|---|---|---|---|---|---|---|---|---|
| USD | 0.25% | 0.21% | 0.05% | 0.28% | 0.24% | 0.25% | 0.24% | |
| EUR | -0.25% | -0.04% | -0.20% | 0.02% | -0.02% | -0.00% | -0.01% | |
| GBP | -0.21% | 0.04% | -0.17% | 0.07% | 0.03% | 0.04% | 0.03% | |
| JPY | -0.05% | 0.20% | 0.17% | 0.24% | 0.20% | 0.21% | 0.20% | |
| CAD | -0.28% | -0.02% | -0.07% | -0.24% | -0.04% | -0.03% | -0.04% | |
| AUD | -0.24% | 0.02% | -0.03% | -0.20% | 0.04% | 0.01% | 0.00% | |
| NZD | -0.25% | 0.00% | -0.04% | -0.21% | 0.03% | -0.01% | -0.01% | |
| CHF | -0.24% | 0.01% | -0.03% | -0.20% | 0.04% | -0.00% | 0.00% |
The heat map shows percentage changes of major currencies against each other. The base currency is picked from the left column, while the quote currency is picked from the top row. For example, if you pick the British Pound from the left column and move along the horizontal line to the US Dollar, the percentage change displayed in the box will represent GBP (base)/USD (quote).
Everyone loves the comfort of a warm cup held between cold hands during winters.
As the temperatures drop and daylight shortens, hot teas offer more than just warmth—they provide a sense of calm and even immune support.
From easing sore throats to offering quiet moments during busy days, the right tea can feel like a small act of self-care during the coldest months.
Here are five soothing teas that are especially comforting in the winters:
Ginger tea is a winter staple known for its warming properties. It helps improve circulation, eases digestion, and relieve nausea.
Its natural spiciness gently warms the body from within, making it ideal for cold mornings or after heavy meals.
Chamomile is best known for its calming effects.
During winter, when stress and sleep disturbances often increase, chamomile tea can help relax the nervous system and tense body. Its mild, floral flavor feels gentle and comforting before bedtime.
Peppermint tea offers a refreshing warmth that clears congestion and soothes headaches. It helps relieve sinus pressure and supports digestion, making it a good option during winter colds.
Cinnamon tea has a naturally sweet, spicy aroma that feels festive; however, it helps regulate blood sugar levels and has antioxidant properties. Its warmth makes it especially comforting on chilly evenings.
Green tea provides gentle energy, improving metabolism and supporting immune health during flu season because of being rich in antioxidants, while offering a light, earthy warmth perfect for winters.
Winter teas are more than beverages, for many they are symbols of comfort and relaxation. Whether you seek calmness, immune support, or simple warmth, these soothing teas can make the colder months feel a little softer and warmer, one cup at a time.
Cardano price is trading at a key technical turning point, with improving momentum and a downtrend break putting the $0.40 resistance and higher upside levels in focus.
After months of downside pressure, Cardano price is now trading at a level that could mark an important turning point. Momentum is beginning to improve beneath the surface, and participants are watching closely to see whether this move develops into a broader recovery or fades like previous rallies.
According to Sssebi, Cardano price is flashing a clear bullish divergence, with RSI forming higher lows while price previously printed lower lows. His chart highlights this momentum shift developing beneath the surface, often a sign that selling pressure is fading even before price confirms a breakout.
ADA shows a bullish RSI divergence as price tests the $0.40 resistance, hinting at fading selling pressure and a possible momentum shift. Source: Sssebi via X
While ADA is still testing the $0.40 resistance zone, the bullish divergence suggests downside momentum has weakened materially. Historically, similar RSI structures in Cardano have preceded trend reversals.
A more decisive technical signal comes from Jesse Peralta, who noted that Cardano price has broken its primary downtrend for the first time since October 2025. His chart illustrates a clear descending trendline that capped every major rally attempt throughout the correction, until now.

Cardano breaks its long-standing downtrend for the first time since October 2025, signaling a potential structural shift toward higher price targets. Source: Jesse Peralta via X
Peralta described the move as a “key breakout,” suggesting that Cardano could target the $0.50–$0.60 region if the breakout holds. From a structural standpoint, this marks a transition from persistent lower highs into a neutral-to-bullish framework.
Zooming out, RoccobullboTom highlighted a much broader formation developing on higher timeframes. His chart shows ADA consolidating above long-term ascending support, with price compressing beneath descending resistance.

Cardano continues to build a higher-timeframe base above long-term support. Source: RoccobullboTom via X
While his projection suggests ADA could eventually move above $1 in a favorable market environment, it’s important to note that such outcomes depend heavily on confirmation, volume expansion, and broader market participation. Still, the presence of a higher-timeframe base strengthens the long-term Cardano price prediction narrative.
Looking into 2026, Cardano’s upside potential largely depends on whether the current breakout attempt evolves into a sustained trend rather than another short-lived rally. From a structural perspective, ADA reclaiming and holding above the $0.40–$0.42 zone would be the first confirmation that the broader downtrend has transitioned into a recovery phase.

Cardano price is trading around $0.40, up 2.35% in the last 24 hours. Source: Brave New Coin
In a base-case scenario, continued acceptance above $0.40 could allow Cardano to gradually work towards the $0.50 to $0.60 region. In a stronger bullish scenario, where momentum builds alongside improving volume and broader market participation, Cardano price could extend beyond the $0.60 region and challenge higher resistance bands over time. Projections towards $1.00 and $2.00 remain possible but would require sustained accumulation, expanding liquidity, and confirmation across multiple timeframes.
As long as ADA holds above its reclaimed structure and avoids falling back below key support levels, upside scenarios remain technically valid.
Cardano’s recent price action reflects a meaningful improvement in structure, with trendline breaks, RSI divergence, and sustained support defense all pointing towards a potential shift in momentum. While confirmation is still required, the technical backdrop is notably stronger than in previous failed rallies.
For now, Cardano price remains focused on the $0.40 resistance as the primary inflection point. Whether ADA transitions into a sustained uptrend or revisits consolidation will depend on how price behaves around this level.
No news for GBPJPY pair until this moment due to its stability below 211.30 barrier, which forces it to provide new sideways fluctuated moves and delay the bullish rally in the current trading.
There are a chance for forming bearish corrective waves to target 210.40 level, reaching extra support near 209.70, while breaching the current barrier and holding above it, will provide a chance for a new bullish waves, to record extra gains by its rally towards 212.50 reaching the bullish channel’s resistance at 213.55.
The expected trading range for today is between 209.30 and 211.30
Trend forecast: Fluctuated within the bullish trend