The main category of All News Articles.
You can use the search box below to find what you need.
[wd_asp id=1]
The main category of All News Articles.
You can use the search box below to find what you need.
[wd_asp id=1]
Use left and right arrow keys to navigate between menu items.
Use escape to exit the menu.
Sign Up
Create a free account to access exclusive content, play games, solve puzzles, test your pop-culture knowledge and receive special offers.
Already have an account? Login
XRP has climbed back above the $2 mark, supported by improving ETF inflows, regulatory clarity, and technical support, fueling renewed bullish sentiment across the crypto market.
Analysts caution that while optimism is building, historical performance and past cycles do not guarantee future returns.
XRP price (XRPUSD pair) regained the $2.00 level on the daily chart after a volatile week that briefly pushed it near $1.83. According to on-chain analyst AbsGMCrypto, known for cycle-based models, institutional participation and U.S. regulatory clarity contributed to a modest rebound to $2.04 intraday.
XRP has reclaimed the $2.00 level, signaling renewed bullish momentum in the market. Source:Good Evening Crypto via X
Community sentiment reflects cautious optimism. Posts on social platforms labeled the rally a “boom,” although analysts stress that weekend price swings are common and short-term volatility should not be overinterpreted.
Some analysts have compared the recent corrective structure to XRP’s 2016–2017 cycle, when the asset fell to $0.0054 before rising dramatically. Macro-trader LunaMetrics, specializing in crypto market cycles, notes that while past events illustrate XRP’s resilience during downturns, the current macroeconomic environment, liquidity, and regulatory backdrop differ significantly.

XRP volatility persists, but ETFs, Ripple adoption, and U.S. crypto policy are fueling renewed bullish interest. Source: X Finance Bull via X
Disclaimer: Historical performance is not predictive. Current market conditions involve higher institutional participation and post-SEC legal clarity, unlike the 2016–2017 period.
XRP’s recent momentum has coincided with the launch of U.S.-listed XRP ETFs. According to preliminary filings and ETF flow trackers:
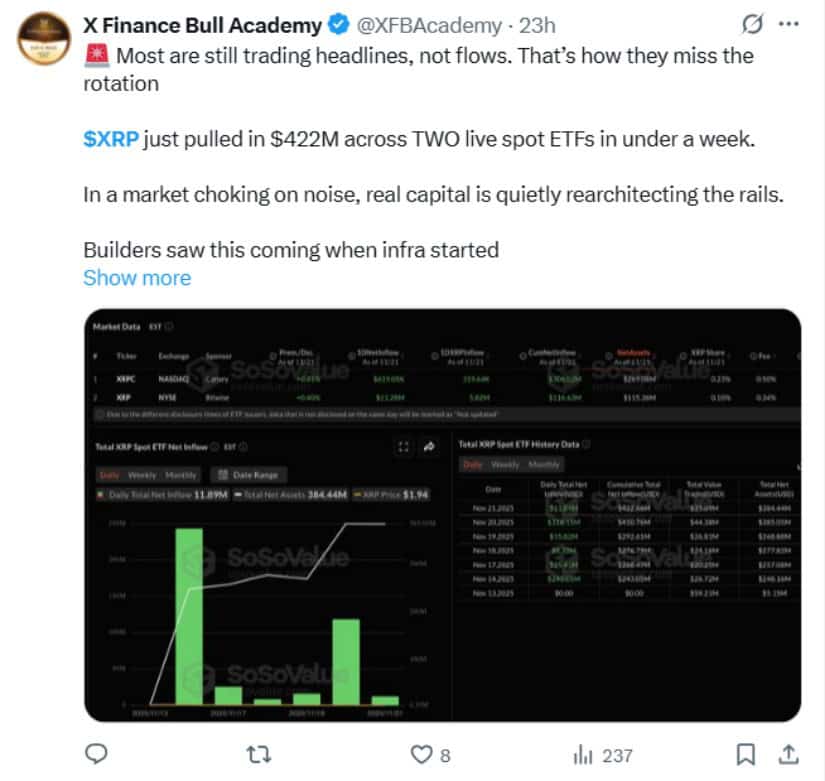
XRP has attracted $422M in two live spot ETFs this week, signaling a quiet liquidity shift from speculation to real utility-driven capital. Source: X Finance Bull Academy via X
These inflows mark growing institutional adoption, particularly for investors previously constrained by regulatory uncertainty. Analysts at Farside Investors, who track ETF performance metrics, note that these products provide new avenues for exposure while reinforcing confidence in XRP following legal developments.
However, on-chain dashboards like Santiment show that ~200 million XRP exited major exchanges within 48 hours of ETF launches, suggesting that short-term liquidity dynamics remain complex. Roughly 42% of circulating XRP is still held at a loss, influencing positioning for both retail and institutional holders.
The SEC vs. Ripple case concluded in 2025 with Judge Analisa Torres’s ruling clarifying that secondary-market sales of XRP are not securities. While banks and payment providers may now feel more comfortable exploring Ripple’s On-Demand Liquidity (ODL) solutions, analysts caution that adoption depends on internal compliance and risk policies.
Macro-trader EconCrypto Insights attributes XRP’s price moderation below $2.30 to broader risk-off sentiment, rising Treasury yields, and a cooling crypto market.
RippleNet’s messaging format is compatible with ISO 20022, enabling smoother integration with institutions using the global payment standard. Payments analyst ClaraFinTech notes this does not imply automatic adoption of XRP, but it strengthens the case for Ripple’s utility in cross-border transfers.
On the daily XRPUSD chart, the token remains within a descending channel established in August 2025. Indicators suggest short-term oversold conditions:
Daily RSI recently touched the lowest level since 2024, historically preceding minor rebounds.
MACD histogram (daily) has flattened, hinting at potential momentum shifts if buying pressure increases near $1.80.
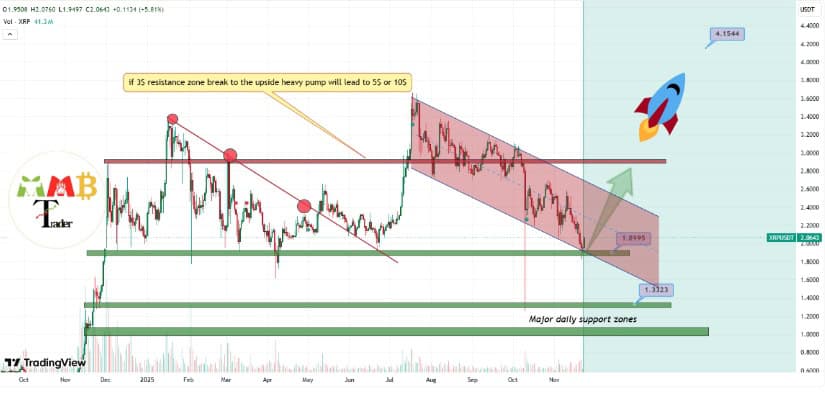
XRP is testing the lower boundary of a descending channel, with a potential reversal or breakout signaling a bullish move toward $4. Source: MMBTtrader on TradingView
Immediate resistance lies between $2.06 and $2.15, with a stronger barrier at $2.20–$2.30. A decisive breakout above this zone could enable a medium-term rally toward $4, according to technical strategist ChartProX, who specializes in altcoin momentum analysis.
ETF-driven inflows are complemented by in-kind creations for certain XRP products, which make net exposure less transparent. Analysts estimate ~$44M of long exposure on Canary Capital’s first day of trading.
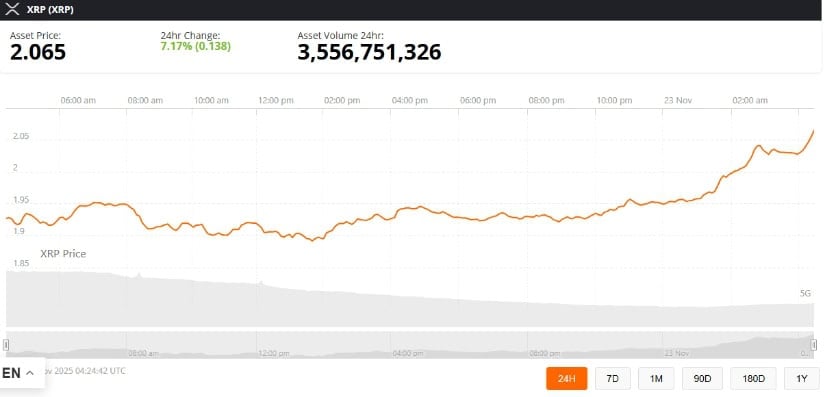
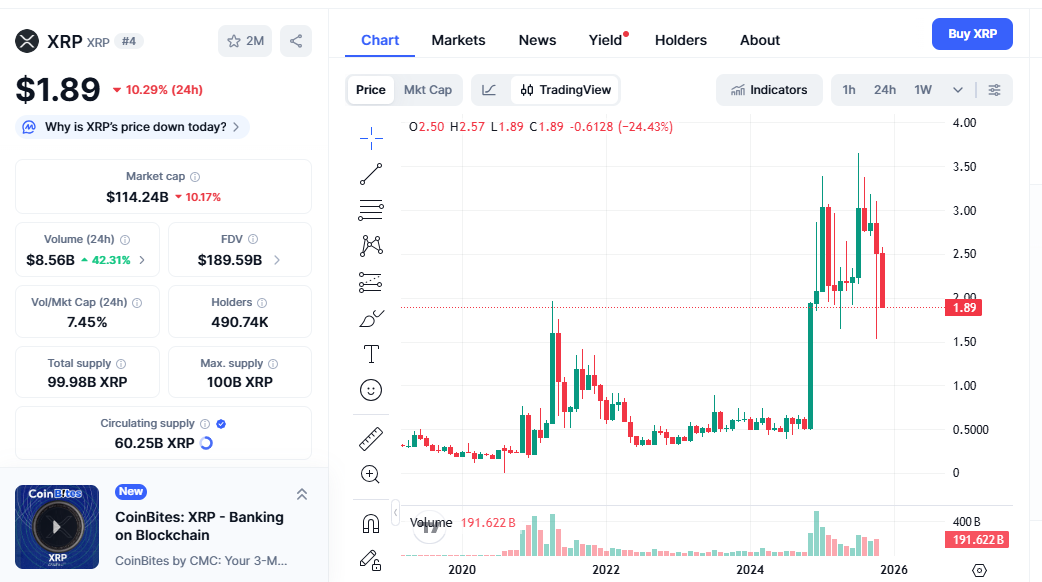
XRP was trading at around 2.06, up 7.17% in the last 24 hours at press time. Source: XRP price via Brave New Coin
Large holders continue to influence price dynamics. On-chain dashboards (CoinMetrics, Santiment) indicate that the top 100 XRP wallets control above ~68% of the circulating supply—a factor that can accelerate price swings but also heighten volatility.
Disclaimer: Wallet holdings and exchange flows fluctuate frequently; numbers are approximations.
Short-Term (Days–Weeks):
Traders note potential rejections at $2.00 psychological resistance and short-term bearish setups from $1.90 to $1.62 (per XRP Technical Alerts, a crypto trading group).
Daily indicators suggest a possible rebound if support at $1.80 holds.
Medium-Term (Weeks–Months):
Institutional ETF adoption and legal clarity may gradually underpin price stability and moderate growth.
Resistance around $2.20–$2.30 remains a key test zone.
Long-Term (Months–Years):
RippleNet adoption across Asia and Africa, combined with compatibility with ISO 20022, could increase XRP’s utility in cross-border settlements.
Even partial penetration (~5%) of the $685B global remittance market could influence valuation and liquidity over time, per payments research firm FinFlow Analytics.
Early readings from widely used market tools—combined with Dogecoin’s multi-month correction—have prompted analysts to re-examine current conditions with a more measured lens. While broader crypto sentiment remains cautious, the appearance of a TD Sequential “9” signal on DOGE’s 3-day chart has refocused attention on whether oversold conditions may be stabilizing. This analysis relies on publicly available price data, standard technical frameworks, and historical performance patterns to help readers assess the developing setup without implying certainty or predictive guarantees.
According to traders familiar with the TD Sequential system—a tool designed by technical analyst Tom DeMark to identify trend exhaustion—a “9” signal on DOGE’s 3-day chart often marks areas where a prevailing trend may be losing strength. On Dogecoin’s latest chart, this pattern appeared after an extended decline from the August high near $0.34 to low levels around $0.115, based on price data from major market aggregators such as CoinMarketCap and TradingView.
The TD Sequential has issued a fresh buy signal for Dogecoin, following a previous instance that preceded a 101.5% rebound. Source: @ali_charts via X
A similar TD9 signal occurred in September 2025, which was followed by a short-term recovery of roughly 101% toward $0.149. While useful for spotting areas of potential reversal, traders acknowledge that the TD Sequential system can produce false signals when market momentum is broadly negative. As one technical analyst noted in a public market forum, the indicator “is valuable for context but should not be used in isolation, especially during strong macro downtrends.”
With the Dogecoin price today fluctuating between $0.138 and $0.14, chart watchers are monitoring whether this latest reading will act as a stopping point for the current correction or simply highlight temporary exhaustion.
Despite the appearance of the TD9 pattern, Dogecoin continues to operate under a bearish market structure. As of November 23, 2025, DOGE trades around $0.14, according to CoinMarketCap—slightly higher on the day yet still more than 27% lower over the past month. This aligns with a broader pullback across cryptocurrencies, driven by cooling market sentiment and reduced speculative appetite.

The market’s 70% decline signals a confirmed bear cycle, where any potential rebound should be seen as a corrective move unless key resistance levels are reclaimed with strong, sustained momentum. Source: MMBTtrader on TradingView
Technical indicators such as the Relative Strength Index (RSI), drawn from TradingView’s standard metrics, are currently reading between 32 and 37 on higher timeframes. These levels suggest oversold conditions but do not guarantee immediate reversal. Data from LunarCrush and similar analytics platforms also show an uptick in social volume, a factor that has historically influenced short-term volatility in highly sentiment-driven assets like Dogecoin.
Market researchers emphasize that any movement toward the $0.18 resistance zone should initially be viewed within the context of a corrective bounce unless DOGE begins reclaiming major levels with meaningful volume and sustained follow-through.
A widely circulated weekly Dogecoin chart indicates that DOGE is nearing the lower boundary of a long-standing consolidation band. Weekly RSI values around 37.66 suggest Dogecoin is approaching levels where previous accumulation phases have occurred. Similar structural patterns appeared in 2021 before significant rallies; however, those past moves were amplified by exceptional social enthusiasm and unusually strong market liquidity—conditions not currently present.
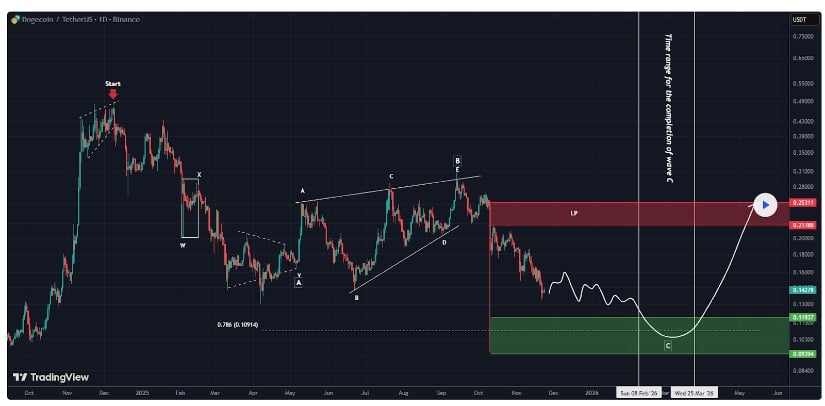
Dogecoin appears to be progressing through a confirmed ABC corrective pattern, with wave C still developing and an upside retracement expected once it completes within the projected timeframe. Source: behdark on TradingView
Independent market commentators note that while the chart setup resembles historical basing patterns, participation levels remain relatively low and the broader macro backdrop remains neutral. As one analyst summarized, the structure “may reflect early accumulation, but without robust participation, timing remains unclear.”
This mixed environment highlights both the potential and the limitations of current Dogecoin predictions, reminding readers that technical setups can evolve slowly during broader risk-off phases.
Dogecoin remains one of the top cryptocurrencies by market capitalization, valued near $22 billion with more than 151 billion coins in circulation, according to CoinMarketCap’s latest figures. While the asset trades far below its May 2021 all-time high of $0.74, it continues to maintain strong community visibility and recurring market interest.
Current metrics show:
Dogecoin Price Today: ~$0.14
24-Hour Change: +4.28%
Market Rank: #9
Sentiment Index: “Extreme Fear” (11) based on Alternative.me’s Fear & Greed Index
Key Resistance Zones: $0.1495 and $0.1586
Key Support Levels: $0.138 and $0.135
Price action currently sits below the 50-day and 200-day simple moving averages, reinforcing the prevailing downward trend and signaling caution for short-term traders monitoring the Dogecoin price.
Wave-based analysts who study market cycle structures—often using Elliott Wave principles—observe that Dogecoin remains within a broader corrective sequence. Based on these interpretations, an ABC corrective pattern appears to be unfolding, with wave C still progressing. The projected completion zone is marked between two timing intervals identified on the chart.
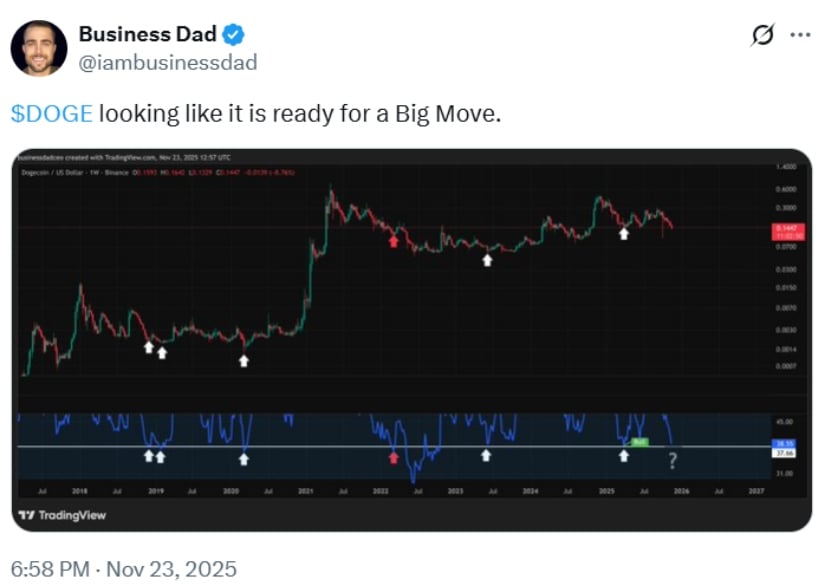
Dogecoin appears poised for a significant move as tightening technical structure and accumulating support hint at a potential breakout. Source: @iambusinessdad via X
Once wave C concludes, some technicians anticipate that retracement movements may form, though these would be considered corrective unless confirmed by stronger structural changes. Analysts caution that the accuracy of wave interpretations can vary significantly and depend heavily on assumptions about trend length, volume, and market psychology.
Moreover, DOGE’s 70%+ decline from its highs aligns with conventional definitions of a bear-market cycle—further reinforcing the need for risk-aware interpretation of any temporary recoveries.
Dogecoin’s performance continues to be shaped by several external and structural variables:
Data from platforms such as LunarCrush show that mentions, trending hashtags, and influencer posts can significantly impact short-term Dogecoin movements. High-profile figures—most notably Elon Musk—have historically triggered notable price reactions, though these effects tend to be short-lived and unpredictable.
Unlike Bitcoin, Dogecoin has no maximum supply cap. Around 5 billion new DOGE are minted each year, which can influence long-term valuation models and is often referenced in discussions around dogecoin price forecast outlooks.
Conversation regarding a possible Dogecoin-based ETF has circulated in community forums and social media threads. At this stage, no official filings or regulatory signals confirm such a development. Analysts stress that ETF rumors should be treated cautiously unless supported by verifiable announcements.
Dogecoin maintains cultural significance and sees occasional use for tipping and merchandise payments, but its utility remains limited compared to more infrastructure-focused cryptocurrencies. This is an ongoing consideration for those evaluating whether Dogecoin is worth it as a multi-year asset.
Short-term models, based on current trends and support/resistance analysis, suggest that Dogecoin may continue to consolidate. Some chart-based forecasts point toward possible retests of the $0.133 area if selling pressure persists. Conversely, a sustained improvement in sentiment, combined with confirmation of the TD9 signal, could support attempts toward the $0.18 range.
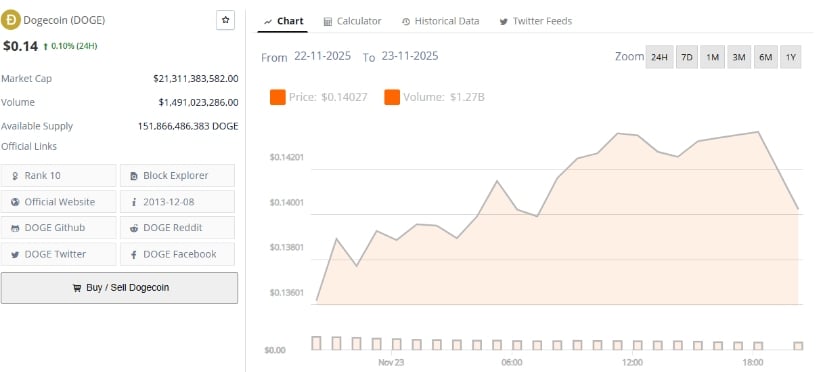
Dogecoin was trading at around $0.14, up 0.10% in the last 24 hours. Source: Brave New Coin
Long-term projections—including Dogecoin price prediction 2025—vary widely due to shifting macro conditions, supply dynamics, and sentiment cycles. For common questions such as “will Dogecoin reach $1?” market researchers emphasize that such scenarios depend heavily on broader crypto-market phases and the return of high engagement, both of which are currently subdued.
Dogecoin’s latest TD9 reading adds an important technical note to the current market backdrop, but it does not, on its own, confirm a trend reversal. The asset remains in a broader corrective pattern, with oversold conditions and long-term consolidation structures forming but not yet signaling a clear shift. Across the market, traders and analysts continue to track chart developments, on-chain data, and sentiment measures for early signs of stability.
Hyderabad: How dangerous are protein shakes and creatine, really, in a country where most people still struggle to eat enough protein in the first place? Current research and doctors’ accounts point to a different problem about the bigger health risk for most Indians is low protein, weak muscles and early disability, not a scoop of whey or five grams of creatine for a healthy adult.
“Whole food should be the primary source for protein and it should be 1 gm per kg of your body weight. With supplements, you rarely know exactly what goes into them,” said Dr Kiran Medala, co-convenor of the media committee of the Indian Medical Association, Telangana. However, he added, “Protein shakes are not always validated as health products. FSSAI approves them as food, not as clinically tested nutrition.”
Surveys show Indians get only about 9-11 per cent of their calories from protein, roughly 50-60 grams a day for many adults, which just about scrapes past the ICMR minimum of 0.83 g per kilo of body weight. Rural households that rely on rice or wheat for 60-75 per cent of calories often fall below even that.
Nutrition scientists in the 2020 ICMR guidelines noted that cereal-heavy diets may need closer to 1 gm per kilo to compensate for poorer protein quality. Traditional sources like dal, curd, eggs, fish and meat can cover that target, but availability, cost and food habits keep a large share of the population underserved.
Yoga trainer Arpan Kushwaha, who has an MSc in Yoga Therapy and teaches in Hyderabad, sees the gap daily among his students. “To maintain our daily needs we should consume at least 1-2 grams of protein per kilo,” he said. “People who are regularly into fitness need 1.5-2.5 grams at least to maintain existing muscle mass and for repair and growth.”
He calls protein “not only for muscles” but also for “nails, hair and overall major tissues” that rely on amino acids to recover and regenerate.
Creatine, which has become the villain of many gym rumours, is a molecule the body already makes from amino acids. It is found in meat and fish and sits inside muscle cells, where it helps recycle ATP, the chemical fuel for short, intense efforts like sprints or heavy lifts.
Decades of trials have tested creatine monohydrate at doses of about 3-5 grams a day in healthy adults. Those studies show better strength gains, extra repetitions in the gym and modest increases in lean mass when people train, without evidence of kidney or liver damage in healthy users.
Several high-authority studies have also shown that creatine benefits the brain, not just muscles. A major review in Experimental Gerontology (2018) pulled findings together and noted consistent gains in short-term memory and reasoning.
People who are new to fitness often arrive scared, Arpan said. “People who are new to health usually get afraid of consuming dietary supplements like protein and creatine,” he said. “It is completely safe for everyone to consume 3-5 grams of creatine. It helps to improve brain and cognitive functions.”
He points his students to the subtle changes like slightly better energy, more stable mood, the ability to push through one more round of sun salutations or squats. Often creatine and protein shakes are also confused with steroids, which have been proven to reduce lifespan, cause heart issues and other major problems. Steroids are lab-made hormones designed to act like testosterone and are often used for faster muscle growth.
UK-based surgeon and educator Dr Karan Rajan has repeatedly told his followers that healthy kidneys are not harmed by creatine. Anybody with underlying diseases should exercise caution.
However, the focus should be on proper protein intake along with exercise, since muscles are important. Researchers plot muscle strength against age, and the curve rises through youth, stays steady for a while, then dips as people grow older.
A dotted horizontal line on that chart marks the “disability threshold”, the point below which simple tasks like standing up, walking a short distance or climbing stairs become difficult. People who build stronger muscles in their 20s to 40s start from a higher point on the curve, and resistance training slows the decline later in life. The idea is to stay above that threshold for as long as possible, so ageing does not turn into early dependency.
On November 20th, Coinbase launched Ether-backed loans for US users, letting customers borrow up to $1 million in USDC against their ETH without selling. Built on Base and powered by Morpho, this product signals something bigger: DeFi infrastructure is going mainstream fast.
Markets moved quickly and everyone started hunting for the best altcoins to scoop up. XRP price prediction searches picked up again as payment tokens usually benefit when the market cools down.
But the real hype right now is DeepSnitch AI. It is blowing up because it mixes real AI utility with meme energy, so traders feel like they’re getting in early on something fun and actually useful to provide .
Coinbase just opened the floodgates for institutional-grade DeFi. The new product lets users across most US states (except New York) borrow USDC stablecoins against their Ethereum holdings without triggering taxable events from selling.
When major exchanges start integrating DeFi protocols like Morpho directly into their platforms, it validates the entire space. Coinbase’s onchain lending already processed over $1.25 billion in loan originations with roughly $810 million still outstanding.
This infrastructure expansion benefits payment-focused networks like XRP. When traditional finance sees crypto lending, staking, and payment rails all functioning smoothly, they start allocating beyond Bitcoin. They start exploring networks built specifically for cross-border settlements and institutional liquidity. That’s XRP’s wheelhouse.
All this fresh momentum from Coinbase, institutional lending and clearer regulations points to one thing. The next cycle is going to reward projects that provide real intelligence, not just hype. When exchanges start running onchain lending at scale, every move becomes data. Every loan, every liquidation, every collateral shift creates signals that smart traders can use long before the crowd notices.
This is where DeepSnitch AI fits right into the narrative. While Coinbase is unlocking institutional DeFi infrastructure, DeepSnitch is building the intelligence layer that helps everyday traders keep up. The platform runs five AI agents that monitor everything from whale rotations to fresh contract deployments. Instead of chasing pumps after they show up on Twitter, traders get alerts the moment the chain starts moving.
Two agents are already live and the rest roll out as development milestones hit. The project has passed security audits through Coinsult and SolidProof, something most presales never bother with. It started at $0.0151 and now sits around $0.02429 with more than $564,000 raised, giving early buyers over 60% gains before the token even lists.
In a market where institutions are getting better tools every week, DeepSnitch gives retail the chance to level the playing field.

XRP trades around $1.89 as of November 21st after the Bitwise XRP ETF debuted on the NYSE.
The XRP price prediction for 2026 actually looks solid when you notice what’s happening. The Canary Capital XRP ETF launched November 13th and pulled $58.5 million first-day turnover with roughly $128 million volume over four trading days. That’s serious institutional interest.
If XRP reclaims and holds above $2.50, the XRP price prediction models suggest momentum shifts bullish toward $2.90-$3.05.
November historically has been XRP’s strongest month, averaging +88% gains. While that exact performance seems unlikely given current holder selling pressure, the setup isn’t terrible.
For a realistic XRP price prediction for 2026, consider the catalysts. Multiple spot XRP ETFs are now approved or pending. Regulatory clarity finally exists after years of SEC battles. RippleNet continues expanding payment partnerships. The Trump administration actively supports crypto infrastructure.
If Bitcoin enters a sustained bull phase and institutional capital flows into payment infrastructure plays, XRP price prediction models suggest 3x to 5x gains from current levels is achievable.
Every DeFi trader wants to know: can Aster coin sustain its recent rally and deliver transformational returns?
Aster currently trades around $1.17 as of November 21st. The DeFi perpetuals token surged 26% recently after CZ (Changpeng Zhao) purchased 2 million tokens, sparking speculative demand.
With roughly 2.4 billion tokens circulating, Aster holds a $2.7 billion market cap. Analysts like MoEthWhale project Aster could hit a $10 billion market cap, which would put the price around $5.
Crypto markets are responding positively as Coinbase’s ETH-backed loans validate DeFi infrastructure and traditional finance integration accelerates. The XRP price prediction for 2026 suggests strong gains are achievable if institutional adoption continues, though the path depends on ETF flows and payment network expansion.
What’s clear is that this cycle rewards utility and infrastructure. DeepSnitch AI represents exactly this shift, combining AI capabilities with practical trading solutions.
The platform’s AI agents tackle information asymmetry head-on. With the presale accessible at $0.02429, early participants already holding 60%+ gains, and 100x potential realistic after exchange listings, the setup deserves attention.
Join the DeepSnitch AI presale and follow updates on X and Telegram.

Most realistic XRP price prediction models place XRP between $6.00 and $10.00 depending on institutional adoption. These estimates factor in ETF flows, payment network expansion, and cross-border settlement adoption rates.
Reaching $50 would require a market cap around $3 trillion, which seems unlikely in the near term. From current levels around $2, a gain faces mathematical constraints unless global payment adoption accelerates dramatically beyond current projections.
XRP institutional adoption usually boosts confidence because banks and payment providers bring real volume. More usage means more demand for liquidity, which can support higher prices over time.
Bitcoin and virtually all cryptocurrencies have been experiencing consecutive days of price correction and decline. This is also reflected in the Solana monthly chart, which showed a “head and shoulders” structure, leading the Solana price prediction to indicate a return to Fibonacci levels at $207 or a drop below $100.
While the entire market falls, the presale sector is doing well, with DeepSnitch AI leading as the most promising one at the moment. Because it’s a project that mixes crypto with artificial intelligence, investors are investing heavily. The token price has already risen 60%, and the presale has already raised over $560,000, with investors talking about potential.
It’s not just the crypto market that’s experiencing red days. The ETF market has also been showing declines, with BTC and ETH ETFs registering strong outflows. But amidst this chaos, SOL ETF seems to shine as one of the only cryptos bucking the trend.
Since its launch, SOL ETF has not yet registered a single day with outflows exceeding inflows, remaining positive with $500 million accumulated. This is interesting because even with the token’s price falling over 30% in November, institutional investors continue to buy Solana ETFs.
Some are calling this a “small SOL ETF altseason,” showing that investors see the strength of Solana’s fundamentals. This makes SOL forecast bullish in the long term, and even though Solana price prediction is uncertain at the moment, with the institutional market buying strongly, it signals a higher probability of further increases.
DeepSnitch AI has just launched its network, and users have already been able to test and see that the product is real. The project has also been audited, validating that it is safe for investment. All of this has led investors to invest heavily because they already see the long-term potential.

Offering a complete platform, it will bring five AI agents that will monitor several on-chain activities to help traders make better investment decisions and protect their portfolio. The agents will track whale moves, insider transactions, new token launches, trending coins, rug pull alerts, and more. All of this will be processed and sent directly to users in real time.
With the artificial intelligence sector expected to grow by 2030, DeepSnitch AI has the product and technology to grow alongside it. And because it’s still a presale, from that perspective, it offers investors much more upside today.
Currently, you can invest in the presale paying just $0.02429, a cheap entry price considering its long-term potential. If the AI sector grows 25x, investors estimate that DSNT could grow at least 100x, making this presale the best crypto to buy now.
The Solana monthly chart presents a complicated pattern. The SOL price fell 30% in November and about 55% since its all-time high, and at this moment it has just formed a bearish Head and Shoulders pattern. After breaking the support at $165 and having a rejected pullback, the price fell to $125 on November 21st.
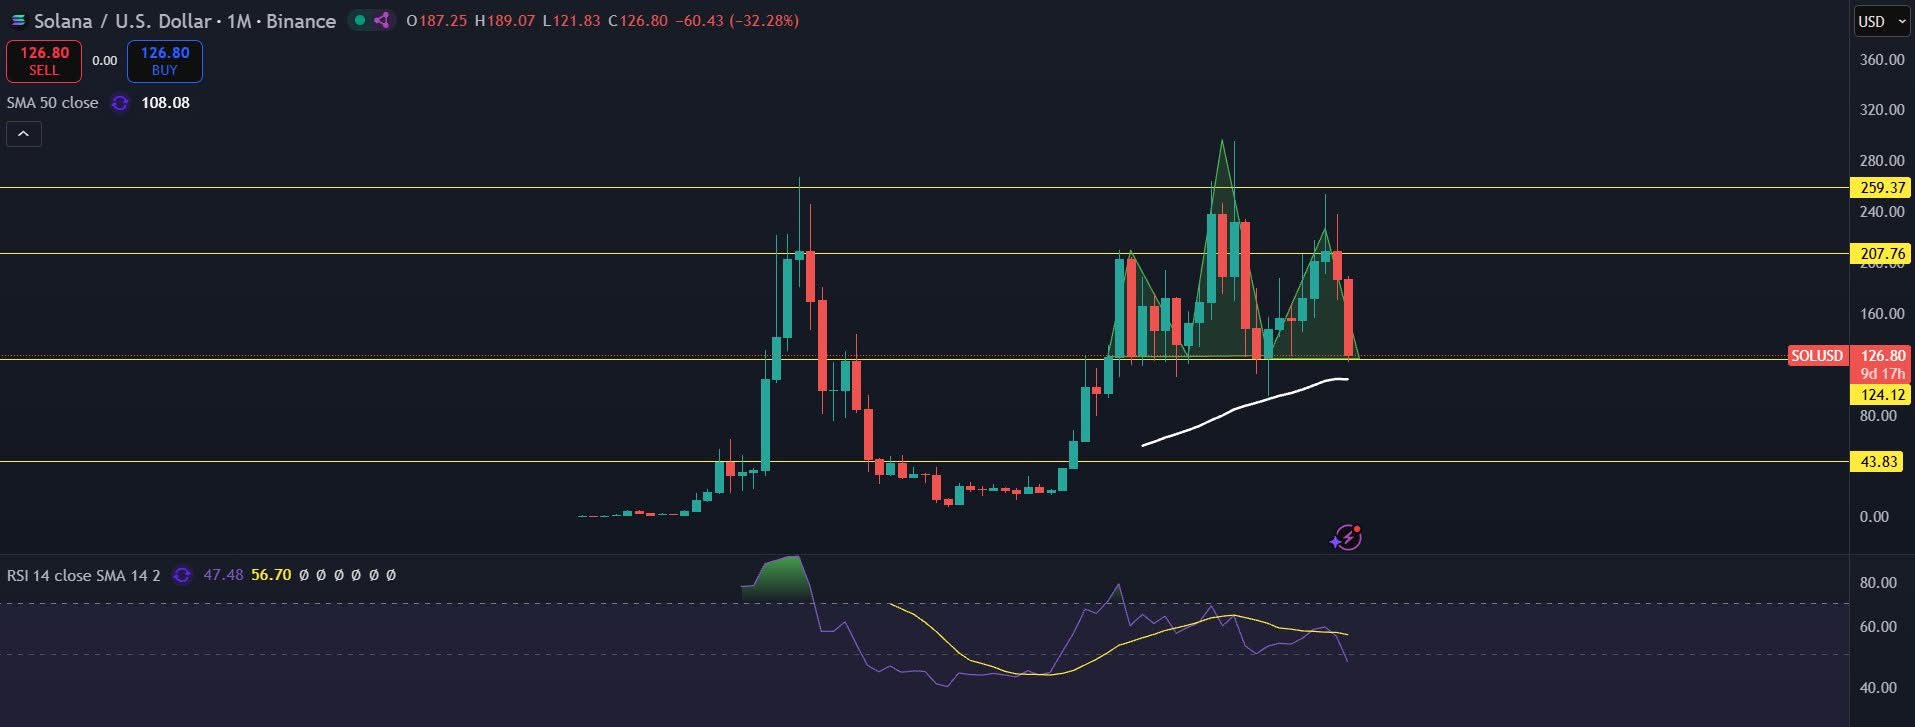
This Head and Shoulders pattern is usually followed by further declines, and this would lead Solana price prediction point to targets below $100 in 2026. For the momentum to return to bullish, the SOL price would need to recover $165 and close the monthly chart above that to form new support.
Institutional investors continue to buy, Solana ETFs are trending, and the fundamentals are still there. With this view, traders believe that the Solana price prediction 2026 is to recover and rise, with traders targeting the next target at $207.
It seems that 2026 could be a year where investors will prefer investment options with staking and passive rewards. This new movement comes after the US created regulatory flexibility for the crypto sector. With this perspective, BlackRock is already positioning itself by launching a new Ethereum ETF that will offer staking to clients.
The strategy is to offer a kind of “institutional staking” without investors needing to operate ETH validators to access network rewards. With VanEck, Grayscale, and now BlackRock, the trend is clear, and the next institutional cycle of Ethereum should be guided by regulated yield products.
Meanwhile, the price of ETH has already fallen 28% in November, but the institutional market is preparing the fundamentals that should guide the next upward leg towards $3,000 and beyond.
Solana price prediction does not look good, with the monthly chart showing signs of bearish times. So, until it recovers lost ground and $165 turns into support, investing in SOL could be risky.
Presales are doing well in a market where almost everything is falling, with DeepSnitch AI leading as the most promising. Being a project that mixes crypto with AI, this enhances its upside potential, positioning it as a potential next crypto to 100x.
FAQsAnalysts point to two key scenarios: a bullish target at $207 based on Fibonacci levels or a drop below $100 due to the recent head-and-shoulders pattern. Recovery above $165 is needed to confirm a bullish reversal.
DeepSnitch AI has launched its network, which is fully audited, and offers five AI agents that track on-chain data in real time. With the AI sector expected to grow 25x, investors see strong 100x upside potential.
Solana ETFs continue to show positive inflows, signaling strong institutional confidence. Even with short-term volatility, long-term fundamentals keep interest high.
The cryptocurrency sector is undergoing a significant transformation as
Dogecoin
(DOGE) experiences declining interest, prompting investors to shift their focus to up-and-coming ventures like Mutuum Finance (MUTM). This decentralized finance (DeFi) platform is gaining traction amid the evolving market landscape. Despite 21Shares introducing a leveraged Dogecoin ETF, overall market sentiment indicates that both retail and institutional investors are increasingly seeking out newer, high-potential projects.
The 21Shares 2x Long Dogecoin ETF (TXXD), which debuted on NASDAQ on November 20,
allows investors to gain twice the daily returns of DOGE
. This offering
highlights the growing institutional interest in Dogecoin
, especially following collaborations with Tesla and AMC Theatres. Nevertheless, DOGE’s value has
hovered around $0.175
, and experts point out that ambitious bullish targets—such as $1.20—remain out of reach without a decisive upward move.
Mutuum Finance, a DeFi lending protocol, is drawing significant interest in the current market environment.
Over 90% of tokens in Phase 6 have already been allocated
, with more than $18.9 million raised and a community of over 18,200 holders.
The current Phase 6 price of $0.035 per token
marks a 250% rise from its original launch price of $0.01.
Mutuum’s swift momentum is driven by key achievements and strong security protocols.
Halborn Security has started auditing the platform’s smart contracts
, further strengthening trust in its decentralized lending system.
Previously, the project earned a 90/100 score from Token Scan
by CertiK, and a $50,000 bug bounty is motivating security experts to find any weaknesses.
These initiatives are in line with the project’s roadmap
, which features a testnet launch for its V1 protocol in Q4 2025.
The sense of demand around Mutuum is heightened by its fixed-allocation approach.
With just 5% of the total 4 billion MUTM tokens
made available to the public, the project’s scarcity angle has fueled demand. The shrinking supply in the current phase has intensified FOMO, especially as the token nears its $0.06 listing price.
Unlike Mutuum’s methodical expansion,
Dogecoin’s prospects depend on speculative triggers
, such as the possible approval of a spot ETF—a scenario many analysts view as uncertain. Although
21Shares’ leveraged ETF introduces new possibilities
for
DOGE
exposure, the market at large seems to prefer projects that offer real-world utility and robust security.
As the digital asset space continues to develop, Mutuum Finance demonstrates the increase in demand for DeFi platforms that emphasize openness and innovation. With Phase 6 almost finished and Halborn’s audit in progress, the project is positioning itself as a notable contender in the 2025 crypto landscape.
usatoday.com wants to ensure the best experience for all of our readers, so we built our site to take advantage of the latest technology, making it faster and easier to use.
Unfortunately, your browser is not supported. Please download one of these browsers for the best experience on usatoday.com
Cardano price today trades near $0.398 after breaking below a multi-month support zone. The drop pushes ADA into a critical test along the ascending long-term trendline as sellers continue to pressure the market following a spike in negative spot flows and broader risk weakness.
On the weekly chart, ADA has decisively lost the horizontal support near $0.52, a level that acted as a floor multiple times during the past year. The current candle has expanded through that rang…
Read The Full Article Cardano Price Prediction: Hoskinson Says ‘Attack Failed’ As ADA Breaks Key Support Zone On Coin Edition.
As
Bitcoin
(BTC) comes under renewed examination following Michael Saylor’s recent claim that the cryptocurrency is “on sale,” market participants are shifting their attention toward alternative assets. While debates over Bitcoin’s value continue, two projects—Cardano (ADA) and Mutuum Finance (MUTM)—are drawing notice for contrasting reasons. Cardano’s extended downturn has raised alarms among investors, whereas Mutuum Finance’s recent表现 is positioning it as a potential standout in the DeFi sector
according to analysis
.
Cardano’s price has slipped beneath the important $0.50 support mark, a level that had previously served as a floor for its downward movement over several years
according to technical analysis
. Technical experts highlight that this breach increases the likelihood of a further drop toward $0.40, and the current consolidation near this lower boundary has yet to signal a turnaround. The asset’s failure to sustain a meaningful rally has resulted in “clear hesitancy from buyers,”
according to market observers
. This has led some investors to reconsider their strategies, redirecting funds to projects like Mutuum Finance, which features a dual-lending platform and scalability suitable for institutional use
according to analysts
.
Security and openness are at the heart of Mutuum’s value proposition. The platform has passed a CertiK audit with a score of 90 out of 100 and has introduced a $50,000 bug bounty initiative to proactively address potential risks
according to official announcements
. Furthermore, Halborn Security is currently auditing its smart contracts, further boosting trust as the Sepolia testnet launch approaches in Q4 2025. This testnet will roll out essential features including mtTokens, liquidity pools, and a liquidator bot, with
ETH
and
USDT
as the first supported tokens.


