The main category of All News Articles.
You can use the search box below to find what you need.
[wd_asp id=1]
The main category of All News Articles.
You can use the search box below to find what you need.
[wd_asp id=1]
JAKARTA – Matcha, the traditional Japanese green tea powder, has seen a new resurgence in 2025 with matcha bars popping up in Jakarta and other big cities in Indonesia offering matcha lattes as well as bakeries and pastry shops offering matcha-infused confectioneries.
The drink, with its iconic deep green color and frothy foam, has taken the internet by storm by popping up on social media such as Instagram reels or TikTok videos.
Solana price trades near the crucial $120–$130 support zone as bearish sentiment and technical pressure persist, with participants watching closely to see whether price holds or breaks lower.
Solana price continues to trade under pressure as the price consolidates near the $125 level, a zone that has increasingly come into focus amid growing bearish sentiment across the market. While some investors view the pullback as an opportunity, multiple market watchers caution that technical structure has yet to show convincing signs of strength.
With sentiment deteriorating and price struggling to reclaim key levels, SOL’s near-term direction remains closely tied to how it behaves around current support.
Market sentiment around Solana has turned increasingly negative, a shift highlighted by Immortal. One widely shared post noted that broader market hostility towards SOL has resurfaced, framing the current pullback as another phase of pessimism rather than outright capitulation.
Market sentiment around Solana turns negative again. Source: Immortal via X
Historically, such sentiment extremes have often coincided with late-stage corrections, though sentiment alone does not confirm a price bottom. Instead, it adds context to the broader risk environment surrounding SOL at current levels.
Broader market risk has also weighed on Solana. A report shared by Coin Bureau referenced Fundstrat’s outlook for a potential crypto market correction in the first half of 2026. Under this scenario, downside targets for major assets were outlined, including a $50–$75 range for Solana.
While these projections represent a base-case scenario rather than a definitive forecast, they have contributed to caution across the altcoin market. Analysts emphasize that such macro views are conditional and depend heavily on broader liquidity and risk sentiment.

Fundstrat outlines bearish downside scenarios for major crypto assets. Source: Coin Bureau via X
From a technical perspective, analysts remain cautious. According to Crypto Chiefs, Solana is still trading within a descending channel, suggesting that the broader trend remains under pressure. The analysis noted that if the channel continues to hold, SOL could still explore levels below $120 before encountering stronger support.

Solana price trades inside a descending channel with downside risk below $120. Source: Crypto Chiefs via X
This structure reinforces the importance of the current support zone, with price behavior here likely to dictate whether SOL stabilizes or extends lower in the near term.
Adding to the cautious Solana outlook, Trader Chase highlighted that continued trading below the $126 level keeps bearish scenarios active. His chart shows SOL Solana price struggling beneath descending trendline resistance, with the potential for further downside if price fails to reclaim key overhead levels.

SOL remains capped below descending resistance. Source: Trader Chase via X
While the analysis outlines bearish continuation risks, it remains conditional on price action. A strong reclaim above resistance would be required to invalidate the current structure.
As of December 21, 2025, Solana is trading around $125, sitting just above a key support zone between $125 and $120. This area is acting as the primary demand region on the chart. If this support continues to hold, SOL could see a recovery move towards the $133 level, followed by the $140 resistance zone.

Solana current price is $125.69, down -0.14% in the last 24 hours. Source: Brave New Coin
However, a clear breakdown below $120 would weaken the structure. In that scenario, downside targets shift towards $111 initially, with $100 as the next major psychological level. Below that, the $90 region stands out as the next key support zone based on prior price reactions.
Solana price is navigating a technically sensitive period as price consolidates near the $120–$130 support zone amid bearish sentiment and unresolved structural pressure. While current levels have drawn attention from participants, confirmation through price action remains essential.
A sustained break below support could expose SOL to deeper downside, while holding this region may allow for some recovery. Until a clearer structure emerges, Solana’s outlook remains conditional, with participants closely watching how the price reacts around these key levels.
Researchers were surprised after a lengthy study of an essential fatty acid, News-Medical reported, with findings particularly relevant to several popular dietary lifestyles.
The study, published in Frontiers in Nutrition, focused on long-chain polyunsaturated fatty acids, which the authors stipulated were of concern for those on vegetarian and vegan diets.
Omega-3 fatty acids play a vital role in several critical health metrics, supporting cardiovascular and immune function, cognition, and fighting inflammation. The study noted that these essential nutrients were often found in meat, fish, and dairy, posing a challenge to plant-based diners.
Flaxseed oil is a known plant-based source of alpha-linolenic acid, an essential omega-3 fatty acid, and News-Medical mentioned a standing “widespread assumption that the human body only poorly converts plant-derived ALA” versus omega-3s found in meat and fish.
Researchers identified 168 individuals aged 18 to 70, all of whom had followed an omnivorous, flexitarian, vegetarian, or vegan diet for one year prior to the start of the study.
As the authors indicated, vegetarian and vegan lifestyles are becoming increasingly popular worldwide for myriad reasons, particularly among Generation Z.
💡Exclusive offers from trusted brands
They cited a range of ethical, health, and environmental benefits as a factor in the growing popularity of plant-based diets. Rising food costs are likely fueling some dietary changes, since meatless alternatives tend to be more affordable and less perishable.
High-profile campaigns like Veganuary are another factor, as is a broader tendency toward hybrid dietary approaches and growing food at home. Opting for plant-forward meals rather than a 100% vegan lifestyle, sometimes called “flexitarianism,” is also becoming more common.
Participants followed “nutrient-optimized menu plans” for one year, supplementing their diets with flaxseed oil for nine months after the first three months of the study. The authors collected blood samples at three-month intervals, examining the study subjects at 12 and 24 months.
At the end of the study, researchers determined that “systematic long-term dietary intake of ALA … leads to a significant increase in EPA, DPA and DHA concentrations” irrespective of participants’ dietary patterns.
Strikingly, researchers also found that while vegans and vegetarians demonstrated lower blood “concentrations than omnivores” at the study’s conclusion, they “on average surpass omnivorous levels at the beginning of the intervention.”
As such, the authors advised vegans and vegetarians to “regularly consume” plant-based foods or supplements rich in essential fatty acids.
Get TCD’s free newsletters for easy tips to save more, waste less, and make smarter choices — and earn up to $5,000 toward clean upgrades in TCD’s exclusive Rewards Club.
The market experts appear to be staying bullish on the Bitcoin price prediction to $100,000 despite the stagnant movement of the flagship crypto. For context, BTC price has continued to consolidate over the past few days and struggled to break through the $90,000 mark.
However, as per market analysts, the crypto might be nearing the end of its bearish phase, suggesting a strong recovery ahead. Considering that, the market experts are keeping close track of the fundamental developments in the market that may influence the movement of the broader market ahead.
For context, the Bank of Japan (BoJ) rate hike has recently caught the eyes of the traders. However, it seems that the news was already priced in and didn’t have any major impact on the BTC price.
On the other hand, the anticipation over a potential Santa rally for the Bitcoin USD price has further fueled market sentiment. So, here we explore the key Bitcoin price levels that may hint at the potential future movement of the asset.
The latest Bitcoin price prediction of $100k comes as BTC price recorded a slight gain of 0.5% today. During writing, BTC USD price exchanged hands at $88,600, but its trading volume fell 53% to $16 billion.
Notably, the crypto has consolidated between $87,850 and $89,027 in the last 24 hours. Over the past 30 days, the crypto has touched a high of $94,601 and a low of $80,659, reflecting the highly volatile scenario in the market.
Meanwhile, it seems that the waning institutional interest has also weighed on the broader market sentiment. For context, the US Spot Bitcoin ETF has recorded an outflow of $158.3 million on December 19.
The outflow was led by BlackRock IBIT, which alone has contributed $173.6 million to the overall outflow on December 19. Besides, the weekly outflow into the investment instrument was recorded at $497 million, with only one day of inflow.

Amid the topsy-turvy scenario in the market, experts have continued to back the $100k Bitcoin price prediction, which has caught the eyes of traders. For context, in a recent X post, analyst Ted noted that the current consolidation phase of the BTC USD price is likely to continue through the weekend.
In addition, he said that the next week would be “very crucial” for the Bitcoin price and may witness downside volatility. Despite that, the expert said that the crypto may witness a quick reversal following the downside trend.

His chart even hints at a potential BTC price surge to $98,000 or even $102,000 in the reversal phase. Echoing a similar sentiment, analyst Captain Faibik said that the Bitcoin correction is “complete,” hinting at a potential surge ahead.

Notably, the chart that he shared indicates a potential Bitcoin price surge to $120,000. This suggests that despite the consolidation phase now, BTC USD price is gearing up for a strong reversal ahead, potentially to target the $100k resistance.
The post Bitcoin Price Prediction to $100k: Here’s the Key Levels to Watch appeared first on The Coin Republic.
Silver is closing out 2025 with the kind of momentum that forces both bulls and bears to pay attention. As of Sunday, December 21, 2025, the silver price (XAG/USD) is hovering around the $67-per-ounce area after a record-setting surge late last week—powered by a mix of investment flows, tight supply conditions, and an industrial demand narrative that keeps getting louder. [1]
But this is also the point in a parabolic move where markets tend to change character: liquidity thins into the holidays, positioning gets crowded, and even small headlines can trigger outsized swings. Several analysts publishing today warn that a “breather” week is possible, even if the broader trend remains bullish into 2026. [2]
Below is a complete, publication-ready roundup of today’s (21.12.2025) silver price news, forecasts, and analyses, plus the macro and technical signals traders are watching right now.
Because it’s a weekend, most “live” silver quotes are effectively tracking Friday’s U.S. session close and subsequent thin, OTC price discovery. Reuters reported that spot silver rose to about $67.14/oz on Friday (Dec. 19) after hitting a fresh record intraday high near $67.45/oz, capping a powerful weekly move. [3]
The bigger headline is the scale of the run: Reuters also noted silver has surged roughly triple-digit percentage points in 2025 (around the 120%–130% range depending on measurement), dramatically outperforming gold this year. [4]
Why this matters for today (Dec. 21):
The silver story right now is not one single catalyst—it’s a cluster of reinforcing forces.
Reuters explicitly framed the rally as heavily investment-driven, quoting market participants who emphasized that speculation is playing a major role even though fundamentals are supportive. [6]
On Friday, Reuters also pointed to ETF flows and retail speculation as a continuing theme in silver’s latest leg higher. [7]
Silver (like gold) is highly sensitive to the path of real yields and the U.S. dollar. Reuters highlighted that:
Reuters described silver’s persistent supply deficit and tightening conditions outside the U.S. as part of the bullish backdrop, adding that earlier tariff-related concerns helped pull metal toward the U.S., tightening liquidity in the London spot market. [9]
Silver’s unique twist versus gold is that it’s not just a hedge or store of value; it’s also an industrial input. Reuters cited demand prospects tied to AI data centers, solar cells, and electric vehicles as part of the “perfect storm.” [10]
One of the more interesting 2025 developments: Reuters reported that silver’s inclusion on the U.S. critical minerals list has supported prices. [11]
Here’s what the major silver-related commentary dated Sunday, December 21, 2025 is saying.
FXLeaders’ weekly outlook says silver closed at about $67.17 last Friday, framing it as a decisive post-breakout hold. Their technical roadmap is clear:
DailyForex’s weekly forecast (created Dec. 21) emphasizes the strength of the breakout while warning that moves are “messy” and volatility is elevated. The analyst’s stance: being long can still make sense, but with smaller position sizing because silver is leading the whole precious-metals complex and can whip around quickly. [13]
A PTI wire carried by The Week warns that gold and silver may take a breather next week due to year-end thin volumes, while traders focus on U.S. macro releases (GDP, housing data, durable goods, consumer confidence). [14]
It also notes that on India’s MCX:
Moneycontrol’s Dec. 21 commodities note (from Kotak Securities’ research head) presents a clean technical framework for MCX silver:
The Times of India also flags the same holiday dynamic: lower participation into Christmas and New Year can create higher sensitivity to economic releases, potentially producing sudden dips or sharp squeezes even if the longer-term trend remains constructive. [17]
With silver trading in “price discovery” territory after repeated all-time highs, forecasts are converging around a simple question:
Bull case (continuation):
Base case (pause / churn):
Bear case (profit-taking / air pocket):
Even among analysts warning about short-term volatility, the medium-term narrative remains bullish in much of today’s commentary—because the same forces that drove the 2025 surge aren’t clearly fading yet.
The important nuance: those upside projections don’t imply a smooth path. Silver is notorious for sharp corrections inside bull markets, and multiple analysts publishing this week have highlighted how quickly “stretched” conditions can unwind.
Silver’s appeal is also its danger: it often behaves like “gold with a turbocharger.” That’s great on the way up—until it isn’t.
One widely circulated warning in recent coverage: Barron’s highlighted research suggesting silver has reached historically extreme deviations versus major moving averages, conditions that in past cycles (like 2011 and 2020) were followed by steep pullbacks exceeding 20%. [25]
That doesn’t invalidate the bullish thesis—it simply reframes timing and risk. In practical terms, it means the next big move could be either:
Even in a holiday-shortened week, silver traders are watching a tight set of macro inputs because they feed directly into the dollar-rate-real-yield equation.
Across today’s Dec. 21 outlook pieces, the most-cited catalysts are:
And the most important market-structure point: because of the holidays, price action may be “subdued” at times—but paradoxically swings can be larger when participation is thin. That’s exactly why multiple analysts are warning about volatility even while staying constructive on trend. [30]
Silver is ending 2025 near record highs around $67/oz, backed by a narrative that blends Fed-cut expectations, strong industrial demand, and supply tightness with heavy investment flows. [31]
For the week ahead, the market is essentially split into two camps:
1. www.reuters.com, 2. www.theweek.in, 3. www.reuters.com, 4. www.reuters.com, 5. www.theweek.in, 6. www.reuters.com, 7. www.reuters.com, 8. www.reuters.com, 9. www.reuters.com, 10. www.reuters.com, 11. www.reuters.com, 12. www.fxleaders.com, 13. www.dailyforex.com, 14. www.theweek.in, 15. www.theweek.in, 16. www.moneycontrol.com, 17. timesofindia.indiatimes.com, 18. www.fxleaders.com, 19. www.theweek.in, 20. www.fxleaders.com, 21. www.marketpulse.com, 22. www.livemint.com, 23. www.reuters.com, 24. www.livemint.com, 25. www.barrons.com, 26. www.theweek.in, 27. www.fxleaders.com, 28. www.theweek.in, 29. www.moneycontrol.com, 30. www.theweek.in, 31. www.reuters.com, 32. www.fxleaders.com, 33. www.barrons.com
BitcoinWorld
Dogecoin Price Prediction 2026-2030: The Realistic Path to $1 Revealed
Will Dogecoin, the cryptocurrency that started as a joke, finally reach the elusive $1 mark? As we look toward 2026, 2027, and beyond, millions of investors are asking this crucial question. Our comprehensive Dogecoin price prediction analyzes market trends, adoption drivers, and technical factors to reveal whether DOGE can realistically achieve this milestone.
Dogecoin occupies a unique space in the cryptocurrency ecosystem. Originally created in 2013 by Billy Markus and Jackson Palmer as a lighthearted alternative to Bitcoin, DOGE has evolved into a serious digital asset with a massive community. The coin’s inflationary supply model, with 5 billion new coins minted annually, creates different economic dynamics than deflationary cryptocurrencies.
By 2026, several factors will influence Dogecoin’s price trajectory. Our analysis considers three potential scenarios:
| Scenario | Price Range | Key Drivers |
|---|---|---|
| Bullish | $0.45 – $0.75 | Major exchange adoption, Elon Musk integration |
| Moderate | $0.25 – $0.40 | Steady growth, retail adoption |
| Bearish | $0.10 – $0.20 | Market downturn, regulatory pressure |
The most likely outcome for our Dogecoin price prediction 2026 falls in the moderate range, assuming continued development and gradual adoption. The DOGE price forecast depends heavily on broader cryptocurrency market conditions and specific Dogecoin developments.
Looking further ahead to 2027, several developments could significantly impact Dogecoin’s value:
Our DOGE price forecast for 2027 suggests a range of $0.35 to $0.65 under favorable conditions. The Dogecoin 2026 foundation will be crucial for this growth phase.
The question on every investor’s mind: Can Dogecoin reach $1 by 2030? Let’s examine the mathematics and market dynamics required:
For Dogecoin to reach $1, its market capitalization would need to approach approximately $140 billion at current circulating supply levels. This represents significant growth but remains within the realm of possibility given cryptocurrency market expansion. Key requirements include:
Our Dogecoin 2030 analysis suggests that while challenging, the $1 target is achievable under optimal conditions. The DOGE $1 target represents more than just a price milestone—it symbolizes mainstream cryptocurrency acceptance.
The path to $1 depends on several interconnected factors. First, broader cryptocurrency adoption must continue accelerating. Second, Dogecoin needs to maintain its cultural relevance and community strength. Third, practical utility must increase through merchant adoption and technological improvements.
Historical patterns show that Dogecoin often follows Bitcoin’s market movements while amplifying them. This correlation means that a strong Bitcoin bull market could propel DOGE toward its $1 target faster than expected. However, the inflationary supply presents a constant selling pressure that must be overcome by demand.
While optimistic about Dogecoin’s potential, we must acknowledge significant challenges:
These factors create headwinds that could delay or prevent Dogecoin from reaching $1. Investors should consider these risks alongside the potential rewards.
Based on our Dogecoin price prediction analysis, here are practical steps for interested investors:
Remember that all cryptocurrency investments carry risk, and you should never invest more than you can afford to lose.
What is the most realistic Dogecoin price prediction for 2026?
Our analysis suggests a moderate range of $0.25 to $0.40 for Dogecoin in 2026, assuming steady growth and continued development.
Can Dogecoin realistically reach $1 by 2030?
Yes, but it requires optimal conditions including mass adoption, favorable regulations, and sustained community support. The DOGE $1 target is challenging but achievable.
Who are the key figures influencing Dogecoin’s price?
Elon Musk, CEO of Tesla and SpaceX, has significantly impacted Dogecoin through his public statements. The original creators, Billy Markus and Jackson Palmer, also remain influential figures in the community.
How does Dogecoin’s inflation affect its price potential?
The 5 billion new DOGE created annually creates constant selling pressure that must be overcome by increasing demand. This makes sustained adoption crucial for price appreciation.
What companies accept Dogecoin as payment?
Several companies have accepted Dogecoin, including Tesla for merchandise at various times, AMC Theatres, and various online retailers through payment processors.
Our comprehensive analysis reveals that Dogecoin’s journey to $1 is paved with both opportunity and challenge. The Dogecoin price prediction for 2026-2030 shows gradual appreciation potential, with the $1 target representing an ambitious but possible milestone by 2030. Success depends on continued community support, technological development, and broader cryptocurrency adoption.
Dogecoin has repeatedly defied expectations since its creation. While our DOGE price forecast provides data-driven projections, the cryptocurrency market remains unpredictable. The most important factor may be Dogecoin’s unique ability to capture public imagination—a quality that could propel it to heights that pure technical analysis cannot predict.
To learn more about the latest cryptocurrency market trends, explore our article on key developments shaping Bitcoin, Ethereum, and other major digital assets and their potential impact on meme coins like Dogecoin.
This post Dogecoin Price Prediction 2026-2030: The Realistic Path to $1 Revealed first appeared on BitcoinWorld.
Gold is ending 2025 where it spent much of the year: near record territory, with investors debating whether the next move is a breakout—or a breath. As of Sunday, December 21, 2025, live spot pricing put gold around $4,352/oz, keeping the metal within striking distance of its 2025 record near $4,381/oz and reinforcing the narrative that bullion has shifted from a “rate-cut trade” into a structural portfolio asset for central banks and investors alike. [1]
What makes today’s setup especially interesting is the collision of three powerful themes: fresh signals that the Federal Reserve could keep rates steady for months, year-end liquidity conditions that can amplify swings, and a growing consensus among major banks that 2026 could still bring gold closer to $4,800–$5,000 even if the pace of gains slows from 2025’s historic surge. [2]
Live spot quotes on Sunday showed gold at $4,352.63/oz (12:08 PM ET), up modestly on the day. [3]
On major pricing feeds tracking XAU/USD, the current exchange rate was around 4,338.55, with an indicated daily range roughly between 4,309 and 4,356—a reminder that different feeds (spot quotes, broker composites, OTC pricing windows) can vary slightly, especially around weekends and thin liquidity. [4]
For context, gold’s 2025 run has been extraordinary: the World Gold Council notes the metal notched 50+ all-time highs this year and delivered 60%+ returns, driven by a mix of geopolitical risk, USD weakness, and momentum. [5]
A key macro headline on Dec. 21 came via Reuters: Cleveland Fed President Beth Hammack said she sees no need to change U.S. interest rates for months, with the current benchmark range at 3.5% to 3.75%, suggesting policy could stay on hold until at least spring while officials assess inflation dynamics—including the downstream effects of tariffs moving through supply chains. [6]
Why it matters for the gold price:
Gold tends to dislike “higher-for-longer” surprises because firmer rate expectations can lift real yields and support the dollar—both classic headwinds for non-yielding bullion. But the 2025 playbook has been more complicated: strong demand from central banks and diversification-focused investors has repeatedly cushioned pullbacks, even when rates didn’t fall as fast as markets hoped. [7]
The most striking feature of late-December research is how many mainstream institutions now treat $4,500+ gold as plausible—even if they warn the rally may cool.
One widely shared late-December thesis: even after the rally, gold may still be under-allocated in key markets. Business Insider, citing Goldman’s analysis, reported gold ETFs were only ~0.17% of private U.S. financial portfolios, and Goldman estimated that even small increases in allocation could have an outsized price effect in a comparatively small market. [15]
Reuters’ late-year roundup captured the scale of the move: gold posted its biggest jump since the 1979 oil crisis, with prices doubling in the last two years and reaching a record around $4,381/oz in October. [16]
Strategists highlighted several forces that turned a “normal” macro rally into something more structural:
Reuters described central-bank reserve diversification away from dollar assets as a key foundation for 2026, with official buyers stepping in when positioning looks stretched and prices dip. [17]
Gold’s 2025 story is no longer just “rates and recession.” Reuters pointed to new market participants (including corporate/crypto-linked buyers) and a broader investor pool. [18]
ING, citing World Gold Council figures, reported global gold demand reached 1,313 tonnes in Q3 2025, described as the strongest quarterly total on record, driven by investment demand (ETFs, bars, coins) and central-bank buying. [19]
Analysts cited concerns ranging from geopolitics to policy disputes and questions about Fed independence as additional support pillars for bullion going into 2026. [20]
Not everyone is comfortable with how gold behaved in 2025.
Reuters reported that the Bank for International Settlements (BIS) raised concerns about a rare co-movement of gold and equities that it says hasn’t been seen in at least half a century, suggesting “growing fragility” in a risk-on environment and questioning what happens if both stocks and gold correct together. Reuters also noted BIS commentary that gold began behaving “much more like a speculative asset,” and flagged unusual signals such as gold ETF pricing trading at a premium versus NAV (per the BIS discussion reported by Reuters). [21]
For gold investors, this matters because it challenges the simplest “safe haven always offsets equities” assumption—especially in a world where portfolio rebalancing can force selling across asset classes during sharp drawdowns.
Gold’s price is driven mainly by macro and demand—but policy and supply headlines can still shape sentiment, especially when they reinforce the “gold as sovereignty” narrative.
Reuters reported that an Italian parliamentary committee approved an amendment declaring that the central bank’s gold reserves belong to “the people,” drawing criticism from the ECB over potential implications for central bank independence. Italy’s reported stockpile is 2,452 metric tons, valued around $300 billion in the Reuters report. [22]
Even if largely symbolic, the story underscores how politically salient gold reserves have become in an era of fiscal strain and de-dollarisation debates.
On the supply side, Reuters reported Zimbabwe reversed plans to double gold royalties to 10%, keeping 5% royalties for gold between $1,200 and $5,000/oz, and applying 10% only above $5,000/oz. Reuters also noted Zimbabwe’s gold production hit 42 metric tons in the first 11 months of 2025, a record. [23]
With Christmas week beginning, many desks are lightly staffed, and liquidity can thin quickly—conditions that often amplify short-term moves in FX, rates, and metals.
India-based market coverage on Dec. 21 highlighted a common theme: year-end low volumes can mean quieter trading—or sudden swings if a surprise data print hits a thin book. Times of India reported analysts watching U.S. data such as GDP, housing statistics, and consumer confidence, while anticipating reduced participation around the holidays. [24]
A separate Dec. 21 report carried by Rediff (PTI/market commentary) similarly emphasized the risk of consolidation/correction amid low participation, while pointing to the same cluster of U.S. macro releases as near-term catalysts. [25]
Technical commentary published on Dec. 21 illustrates how tight the market’s focus has become around the highs:
The key takeaway: when a market grinds near record highs late in the year, the first big move can be exaggerated—either a breakout that forces under-allocated investors to chase, or a quick pullback driven by profit-taking and thin liquidity.
Putting the day’s headlines and the latest institutional forecasts together, the 2026 gold narrative is shaping up around three questions:
For now, price action says the bull market is not “over”—it’s being renegotiated. Gold is no longer just reacting to the next CPI print; it’s being priced as a strategic hedge against a wider set of risks: geopolitics, reserve diversification, fiscal concerns, and shifting confidence in fiat stability. [31]
1. www.jmbullion.com, 2. www.reuters.com, 3. www.jmbullion.com, 4. www.investing.com, 5. www.gold.org, 6. www.reuters.com, 7. www.reuters.com, 8. www.reuters.com, 9. www.reuters.com, 10. www.reuters.com, 11. www.reuters.com, 12. www.reuters.com, 13. www.reuters.com, 14. www.ssga.com, 15. markets.businessinsider.com, 16. www.reuters.com, 17. www.reuters.com, 18. www.reuters.com, 19. think.ing.com, 20. www.reuters.com, 21. www.reuters.com, 22. www.reuters.com, 23. www.reuters.com, 24. timesofindia.indiatimes.com, 25. money.rediff.com, 26. www.fxempire.com, 27. www.dailyforex.com, 28. www.reuters.com, 29. www.reuters.com, 30. www.reuters.com, 31. www.gold.org
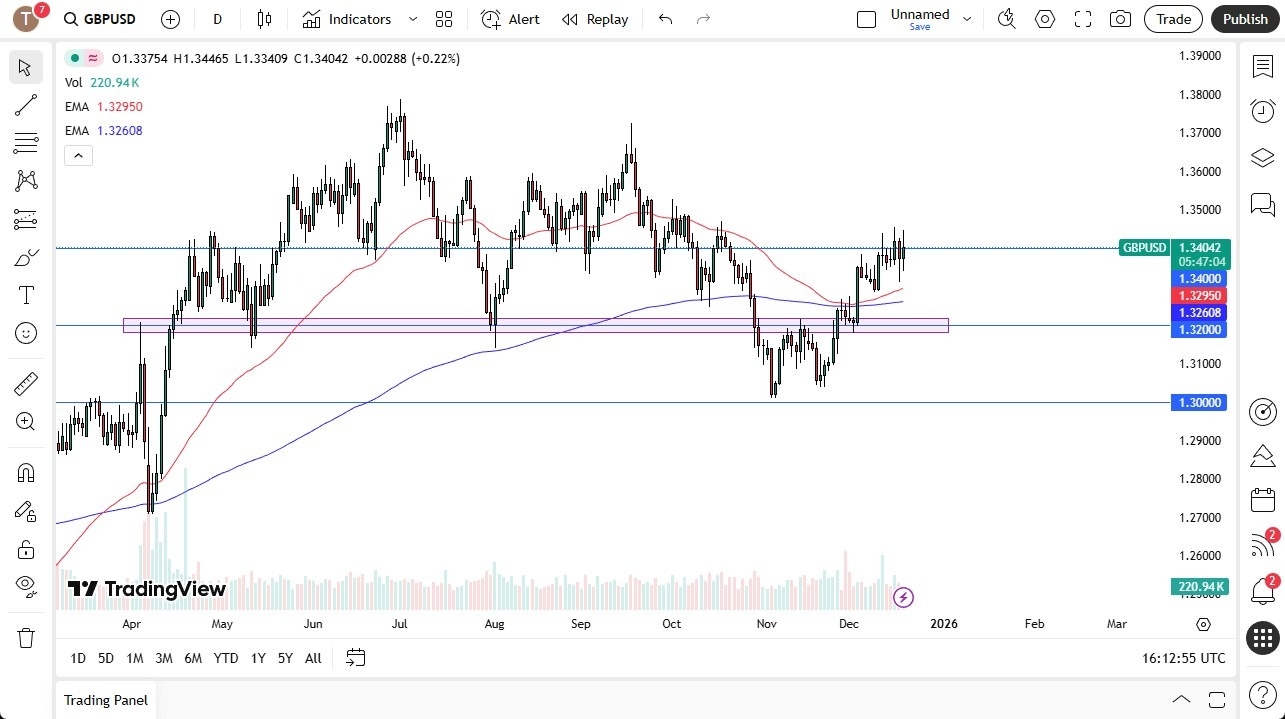
The British pound has been very noisy during trading on Thursday, which is not a huge surprise considering that we had the Bank of England interest rate decision during the day. On the other side of the Atlantic, we had the CPI numbers come out of the United States. The English cut their rates as anticipated. The CPI numbers in the United States came in much weaker than anticipated. So this has helped lift the British pound just a touch.

That being said, I don’t know that anything has changed. The interest rate differential, which of course changed when the Federal Reserve cut rates last week, is now gone. And now we have a situation where we have to question whether or not the US starts slowing down, because if the US starts slowing down, typically what follows is the rest of the world slowing down. So you see an initial move against America, only to turn around and run back to America via currency markets and more specifically the bond market, which, of course, is a main driver of the currency market.
As things stand right now, it looks like the 1.34 level continues to be massive resistance or more or less a magnet for price. And it’s really not until we break above the 1.35 level that I think the British pound has the all clear to go higher. In that environment, we could go looking to the 1.3750 level. Just have to wait and see.
To the downside, if we can break down below the Wednesday candlestick, I think at that point in time, I might start shorting this pair. It could open up a move down to 1.32 and then eventually 1.30 over the longer term. Nonetheless, I would say this about the British pound. It has outperformed most of its contemporaries against the US dollar both up and down over the last couple of years. And I anticipate that to continue being the case here, as the US dollar is the main driver of Forex markets, but it’s a relative game and relatively speaking, the pound is stronger than most other currencies.
Ready to trade our daily GBP/USD Forex forecast? Here’s some of the best forex broker UK reviews to check out.
Christopher Lewis has been trading Forex and has over 20 years experience in financial markets. Chris has been a regular contributor to Daily Forex since the early days of the site. He writes about Forex for several online publications, including FX Empire, Investing.com, and his own site, aptly named The Trader Guy. Chris favours technical analysis methods to identify his trades and likes to trade equity indices and commodities as well as Forex. He favours a longer-term trading style, and his trades often last for days or weeks.
BitcoinWorld
Cardano Price Prediction: Will ADA Explode to $2 by 2030?
As the cryptocurrency market continues to evolve, investors are eagerly watching Cardano’s ADA token. With its unique proof-of-stake consensus mechanism and strong development roadmap, many are wondering: could ADA reach the coveted $2 mark in the coming years? This comprehensive analysis examines Cardano price predictions from 2026 through 2030, combining technical analysis, market trends, and expert insights to give you a clear picture of ADA’s potential trajectory.
Cardano stands as one of the most established blockchain platforms in the cryptocurrency space. Founded by Charles Hoskinson, co-founder of Ethereum, Cardano has built a reputation for its research-driven approach and peer-reviewed development process. As of current market conditions, ADA maintains a strong position among top cryptocurrencies by market capitalization, but what does this mean for future price movements?
The platform’s transition to a proof-of-stake consensus mechanism through its Ouroboros protocol has positioned it as an energy-efficient alternative to proof-of-work blockchains. This fundamental advantage, combined with ongoing development through the Basho and Voltaire eras, creates a solid foundation for potential growth.
Looking ahead to 2026, several factors will influence ADA’s price trajectory. Market analysts consider both technical indicators and fundamental developments when making their Cardano price prediction for this period.
Key factors for 2026 include:
Most conservative estimates suggest ADA could trade between $0.80 and $1.20 by 2026, assuming steady platform growth and favorable market conditions. More optimistic projections, based on accelerated adoption and successful implementation of Cardano’s roadmap, suggest potential highs approaching $1.50.
The year 2027 represents a crucial period for Cardano’s long-term trajectory. By this time, the platform should have fully implemented its Voltaire governance system, allowing ADA holders to participate directly in network decisions. This increased utility could significantly impact the ADA price.
| Scenario | Low Estimate | High Estimate |
|---|---|---|
| Conservative | $1.00 | $1.40 |
| Moderate | $1.20 | $1.80 |
| Optimistic | $1.50 | $2.20 |
These projections assume continued development success and growing institutional interest in proof-of-stake cryptocurrencies. The cryptocurrency forecast for 2027 heavily depends on Cardano’s ability to attract and retain developers, as well as the platform’s performance relative to competitors like Ethereum and Solana.
Looking further ahead to 2030, the Cardano 2030 outlook becomes both more speculative and potentially more exciting. Long-term predictions must account for technological advancements, regulatory landscapes, and broader economic factors that are difficult to forecast with precision.
Several scenarios could unfold:
The most compelling question remains: Will ADA hit $2? Based on current trajectories and assuming successful execution of Cardano’s development roadmap, reaching $2 by 2030 appears achievable, though not guaranteed. The $2 milestone represents approximately a 4x increase from current levels, which aligns with historical cryptocurrency growth patterns for established projects with strong fundamentals.
Several developments could propel ADA beyond current predictions:
Institutional Adoption: Increased investment from traditional financial institutions could dramatically increase demand for ADA. As proof-of-stake assets gain regulatory clarity, more institutional investors may enter the Cardano ecosystem.
Technological Breakthroughs: Successful implementation of Cardano’s scaling solutions and interoperability features could position ADA as a leading platform for decentralized finance and other applications.
Market Cycles: Cryptocurrency markets historically move in cycles. A major bull market coinciding with Cardano’s development milestones could create perfect conditions for significant price appreciation.
While the Cardano price prediction outlook appears promising, investors must consider potential challenges:
Competition: Cardano faces intense competition from other smart contract platforms. Ethereum’s continued development, along with emerging layer-1 and layer-2 solutions, could limit Cardano’s market share.
Regulatory Uncertainty: Changing regulatory landscapes, particularly regarding proof-of-stake assets and securities classification, could impact ADA’s price and adoption.
Execution Risk: Cardano’s development timeline has historically been deliberate. Any significant delays or technical challenges could affect market confidence and price performance.
Leading cryptocurrency analysts offer varied perspectives on ADA’s future. While some emphasize Cardano’s strong fundamentals and research-based approach, others caution about the competitive landscape. Most agree that Cardano’s success depends on execution of its roadmap and ability to attract developers and users to its ecosystem.
The overall cryptocurrency forecast for ADA remains cautiously optimistic, with many experts believing the platform’s unique approach could pay dividends in the long term, particularly as environmental concerns make proof-of-stake mechanisms more attractive to institutional investors.
Based on current Cardano price prediction models and market analysis:
1. Consider dollar-cost averaging rather than timing the market
2. Monitor Cardano’s development progress through official channels
3. Diversify within the cryptocurrency sector
4. Stay informed about regulatory developments affecting proof-of-stake assets
5. Set realistic expectations based on your investment horizon
What is the highest price Cardano could reach by 2030?
While predictions vary, some optimistic models suggest ADA could reach $5-$10 by 2030 under ideal conditions, though most analysts project more conservative targets in the $2-$4 range.
Who founded Cardano?
Cardano was founded by Charles Hoskinson, who also co-founded Ethereum. The project is developed by Input Output Hong Kong (IOHK).
How does Cardano differ from Ethereum?
Cardano uses a proof-of-stake consensus mechanism called Ouroboros, while Ethereum recently transitioned from proof-of-work to proof-of-stake. Cardano also emphasizes peer-reviewed research and formal methods in its development process.
What factors most influence ADA price?
Key factors include overall cryptocurrency market trends, Cardano platform adoption, technological developments, regulatory changes, and competition from other blockchain platforms.
Is Cardano a good long-term investment?
Many analysts view Cardano as a promising long-term investment due to its strong fundamentals and research-based approach, though all cryptocurrency investments carry significant risk and volatility.
The journey toward ADA reaching $2 involves multiple factors aligning favorably. Cardano’s deliberate development approach, combined with growing recognition of proof-of-stake advantages, creates a compelling case for long-term growth. While reaching $2 by 2030 appears within reach based on current projections, investors should remain aware of market volatility and the competitive landscape.
Cardano’s success ultimately depends on execution—transforming its technological promise into real-world adoption. As the platform continues to develop and the broader cryptocurrency market evolves, ADA’s price trajectory will reflect both Cardano’s specific achievements and general market conditions. For investors with a long-term perspective and risk tolerance, Cardano represents an intriguing opportunity in the evolving blockchain ecosystem.
To learn more about the latest cryptocurrency markets trends, explore our article on key developments shaping blockchain technology and digital asset adoption.
This post Cardano Price Prediction: Will ADA Explode to $2 by 2030? first appeared on BitcoinWorld.
December 21, 2025 — Natural gas markets are closing out the year with a familiar winter paradox: heating season is underway, but prices are being dragged lower by milder temperature forecasts and a supply picture that still looks comfortable in both the U.S. and Europe.
In the United States, NYMEX natural gas futures for January delivery slid to $3.879 per million British thermal units (mmBtu) in the latest session, touching a seven-week low as traders priced in warmer-than-normal weather into early January and continued strength in Lower 48 production. [1]
Globally, the soft tone is reinforced by weaker benchmark prices in Europe and Asia—reducing LNG “pull” from overseas and narrowing export margins. At the same time, major structural stories continue to reshape the longer-term outlook: Qatar-linked expansion activity moved forward with a new offshore contract, while at least one large proposed U.S. export project was paused amid cost and oversupply concerns. [2]
Below is a detailed look at the key news, forecasts, and market analysis shaping natural gas as of Dec. 21, 2025.
The current U.S. move is less about a sudden collapse in fundamentals and more about a rapid repricing of winter expectations. After earlier cold-driven strength, the latest model runs shifted warmer—enough to shave expected heating demand in the critical late-December/early-January window.
Reuters-reported market data showed meteorologists expecting weather to stay mostly warmer than normal through Jan. 3, reducing the volume of gas needed for residential and commercial heating. [11]
At the same time, supply remains strong. Lower 48 output has been hovering near record levels (~109.6 bcfd), giving the market less reason to pay up for winter risk. [12]
One of the most telling indicators is the forward curve. The March–April 2026 spread—nicknamed the “widow-maker” for how violently it can move when late-winter weather swings—compressed to around a 1-cent premium, an unusually calm signal for the end of winter. [13]
Storage is also helping keep a lid on panic pricing. In the same Reuters dataset, the U.S. storage position was shown close to normal—recently around 0.9% above the five-year average at the reported point in time (with totals cited around 3,579 bcf for the referenced week). [14]
That doesn’t mean winter is “solved.” It means the market currently believes supply + storage are adequate unless a sustained cold regime emerges.
U.S. LNG export demand continues to be a critical support pillar. Feedgas to the eight major U.S. LNG plants averaged around 18.5 bcfd so far this month—up from a monthly record of 18.2 bcfd in November, according to Reuters-reported figures. [15]
However, softer global gas benchmarks are complicating the picture.
Earlier in the week, Reuters reporting noted European (TTF) and Asian (JKM) benchmarks trading near multi‑month lows, with global prices declining as the winter heating season began slowly and markets weighed prospects of improved Russia-linked supply conditions over time. [16]
This matters because LNG is not just a “volume” story—it’s a margin story. When international prices fall faster than Henry Hub (or when shipping and liquefaction costs rise), U.S. cargo economics can tighten, especially for spot-linked volumes.
Operationally, traders are still tracking plant-level events. Reuters noted a shutdown of one liquefaction train at Freeport LNG in Texas during the week, a reminder that unplanned outages can quickly change short-term balances. [17]
Separately, Reuters also pointed to small flow declines at Venture Global facilities in Louisiana in recent days (as referenced in market reporting), though overall U.S. LNG feedgas stayed near record highs. [18]
One of the most important structural stories heading into 2026 isn’t a price tick—it’s what developers are doing (or not doing) with multi‑billion-dollar export projects.
Energy Transfer said it is suspending development of its Lake Charles LNG export project in Louisiana, citing a preference to focus capital on pipeline investments amid rising costs and fears of looming global oversupply as more LNG capacity comes online. The project had been planned at roughly 16.45 million tonnes per annum of liquefaction capacity. [19]
For the market, this is a two-sided signal:
While some U.S. capacity ambitions are being reassessed, Qatar’s expansion narrative keeps moving.
Italy’s Saipem won an offshore EPCI contract from QatarEnergy LNG (in partnership with China’s COOEC), with the overall contract value around $4 billion and Saipem’s share around $3.1 billion. The work is described on a multi‑year timeline, with offshore installation operations expected later in the decade. [20]
The strategic message is clear: Qatar’s North Field-linked expansion remains one of the most consequential supply additions expected for the second half of the 2020s.
For traders and policymakers, that raises the central question: Will demand growth (Europe’s LNG reliance, Asia’s industrial/power growth, and new uses like data center power demand) keep pace with the supply wave? [21]
European gas is increasingly shaped by policy—and by the reality that LNG is now a structural pillar of supply.
The European Parliament approved the bloc’s plan to phase out Russian gas imports, including halting Russian LNG by end‑2026 and ending pipeline gas imports by end‑September 2027. Reuters reported Russia accounted for about 12% of EU gas imports as of October 2025, down sharply from pre‑2022 levels. [22]
This is a long-duration bullish factor for LNG infrastructure and flexible supply—but it doesn’t automatically translate into high near-term prices if weather is mild and inventories are adequate.
Another European factor that could influence LNG flows—and compliance costs—is methane policy.
Reuters reported the U.S. asked the EU to exempt U.S. oil and gas imports from aspects of the EU’s methane emissions regulation until 2035, framing it as a trade barrier and warning of implementation challenges given complex U.S. supply chains and commingled molecules. The EU, however, signaled the legislation stands while discussing implementation pathways. [23]
For market participants, methane rules can affect contract structures, certification practices, and potentially the attractiveness of certain supply sources over time—particularly in a world where Europe is expected to remain a premium LNG buyer for years.
Even as prices soften, European gas market activity is expanding. Intercontinental Exchange (ICE) reported record trading volumes for benchmark Dutch TTF contracts in 2025 and said it is preparing to extend trading hours to better align with global cycles, reflecting how Europe’s gas pricing is increasingly connected to Henry Hub and Asian LNG benchmarks. [24]
A major regional headline this week came from the Eastern Mediterranean.
Reuters reported Israel approved what it described as its largest-ever natural gas export deal—valued around $34.67 billion—to supply Egypt with gas from the Leviathan field. The deal referenced roughly 130 bcm of gas through 2040 (or until the contract value is met), and it comes as Egypt works through an energy crunch linked to domestic production declines and rising demand. [25]
Why this matters beyond the region:
Natural gas is increasingly global: LNG prices and flows often ripple back into domestic energy bills.
In Australia, policy debate remains active over how to protect local consumers and industry from LNG-linked price pressures. Reporting highlighted concerns around high gas prices and scrutiny of mechanisms meant to ensure adequate domestic supply. [26]
For global readers, the takeaway is broader than Australia: countries that are large LNG exporters often face political pressure to “decouple” domestic pricing from international markets—especially when cost-of-living becomes a dominant theme.
Forecasting gas is notoriously difficult because weather dominates and LNG is both a demand source and a volatility amplifier. Still, several major outlooks released or highlighted in December frame today’s debate: Is the recent pullback a pause—or a reset lower?
In its December Short‑Term Energy Outlook messaging, EIA forecast Henry Hub natural gas prices at $3.56/mmBtu for 2025 and $4.01/mmBtu for 2026, and described winter conditions putting upward pressure on prices—projecting a winter average around $4.30/mmBtu in its forecast narrative. EIA also projected U.S. LNG gross exports rising to ~16 bcfd in 2026 (from ~15 bcfd in 2025). [27]
Enverus Intelligence Research projected Henry Hub prices averaging about $3.80/mmBtu through winter before softening to around $3.60/mmBtu in summer 2026, arguing the earlier run-up had gotten ahead of fundamentals amid expectations for a mild winter and continued Lower 48 supply growth. [28]
Reuters reporting on Goldman’s outlook included expectations that in 2026 Dutch TTF could average around €29/MWh and U.S. natural gas around $4.60/mmBtu, illustrating how some bank forecasts still lean above what today’s softened winter curve implies. [29]
Kpler’s European natural gas outlook suggested EU‑27 storage could end the 2025–26 winter around 36% full, with the estimate sensitive to LNG import expectations and pipeline inflows—another reminder that Europe’s balance is increasingly an LNG scheduling story. [30]
Natural gas is entering a period where small changes in weather models can drive outsized moves. Here’s what professionals are watching right now:
1. www.tradingview.com, 2. www.tradingview.com, 3. www.tradingview.com, 4. www.tradingview.com, 5. www.tradingview.com, 6. www.tradingview.com, 7. www.reuters.com, 8. www.reuters.com, 9. www.reuters.com, 10. www.eia.gov, 11. www.tradingview.com, 12. www.tradingview.com, 13. www.tradingview.com, 14. www.tradingview.com, 15. www.tradingview.com, 16. www.tradingview.com, 17. www.tradingview.com, 18. www.tradingview.com, 19. www.reuters.com, 20. www.tradingview.com, 21. www.reuters.com, 22. www.reuters.com, 23. www.reuters.com, 24. www.reuters.com, 25. www.reuters.com, 26. www.theguardian.com, 27. www.eia.gov, 28. www.mrt.com, 29. www.reuters.com, 30. www.kpler.com, 31. www.tradingview.com, 32. www.tradingview.com, 33. www.tradingview.com, 34. www.reuters.com, 35. www.reuters.com