The main category of All News Articles.
You can use the search box below to find what you need.
[wd_asp id=1]
The main category of All News Articles.
You can use the search box below to find what you need.
[wd_asp id=1]
A proposed rule change regarding the placement of DSHEA disclaimers on dietary supplement labels has been seen as a welcome clarification by industry sources. FDA has rarely if ever enforced the existing rule, but the issue has given rise to class action lawsuits.
The Dietary Supplement Health and Education Act (DSHEA) specifically requires that the standard disclaimer relating to claims be printed on every panel of a product label on which a health claim appears.
The standard verbiage is: “These statements have not been evaluated by the Food and Drug Administration. This product is not intended to diagnose, treat, cure or prevent any disease.”
Over the years the practice in the industry has become to refer to a lone disclaimer, often but not always located on the back panel of the product label, via asterisks appended to each appearance of a claim. While that does not fulfill the letter of the law, in a statement announcing the proposed rulemaking procedure, FDA said it “recognizes that we have rarely, if ever, enforced this requirement.”
FDA’s proposed rule change would allow the currently accepted industry practice to be formally codified in the law. At least one appearance of the disclaimer would still be required, however.
That de facto enforcement discretion on FDA’s part hasn’t stopped the plaintiff’s bar from seeking to capitalize on this perceived lapse on the part of dietary supplement companies. As the Council for Responsible Nutrition (CRN) noted in a recent press statement, “[A] recent uptick in class-action lawsuits has relied on an alternative interpretation, arguing that the full disclaimer must be placed on every panel where a structure/function claim is used on a product label. These legal challenges have created confusion, prompted unnecessary litigation, and imposed costly and disproportionate burdens on responsible manufacturers — without improving consumer understanding.”
Ivan Wasserman, partner in the law firm Amin Talati Guarani, was effusive in his praise of the move.
“This development is certainly welcome news to all of us in the industry. It is public acknowledgement of the enforcement discretion that we all know FDA has been unofficially exercising for decades, and we hope FDA will ultimately revise the regulation. It provides peace of mind to everyone trying to label supplements correctly, and will hopefully help put an end to at least this one labor of whack-a-mole class actions. Our firm was thrilled to be part of the catalyst for this by assisting CRN in drafting its submission to FDA advocating for this change,” he told SupplySide Supplement Journal.
Wasserman noted that the change was announced via a “letter to industry” rather than a guidance document. He speculated that this is in response to the first Trump administration’s executive order against using guidance documents rather than rulemaking procedures as standard regulatory tools.
The practice has grown in recent years because of the many months to years required to conclude a formal rulemaking procedure. The argument in favor of rulemaking is that the rule can be challenged in court, giving some potential redress if stakeholders believe the process has gone awry.
The Natural Products Association (NPA) and the American Herbal Products Association (AHPA) had collaborated on a similar submission to FDA, and NPA’s president and chief executive officer Daniel Fabricant, Ph.D., said the change will ease burdens for industry.
“NPA appreciates that FDA carefully considered the concerns of industry over the requirement for the DSHEA disclaimer to appear on each panel of a dietary supplement product label where an applicable claim is made. Our association will continue to advocate for dietary supplement rules that ease undue burdens on our members, reduce frivolous litigation and protect the integrity of DSHEA,” he said.
Bitcoin (BTC), Ethereum (ETH) and Ripple (XRP) are trading under pressure on Tuesday as bearish sentiment in the broader cryptocurrency market lingers.
Despite Bitcoin trading above $86,000, up from an intraday low of $85,266, the overall outlook remains bearish, characterised by “extreme fear”, according to the Crypto Fear & Greed Index.
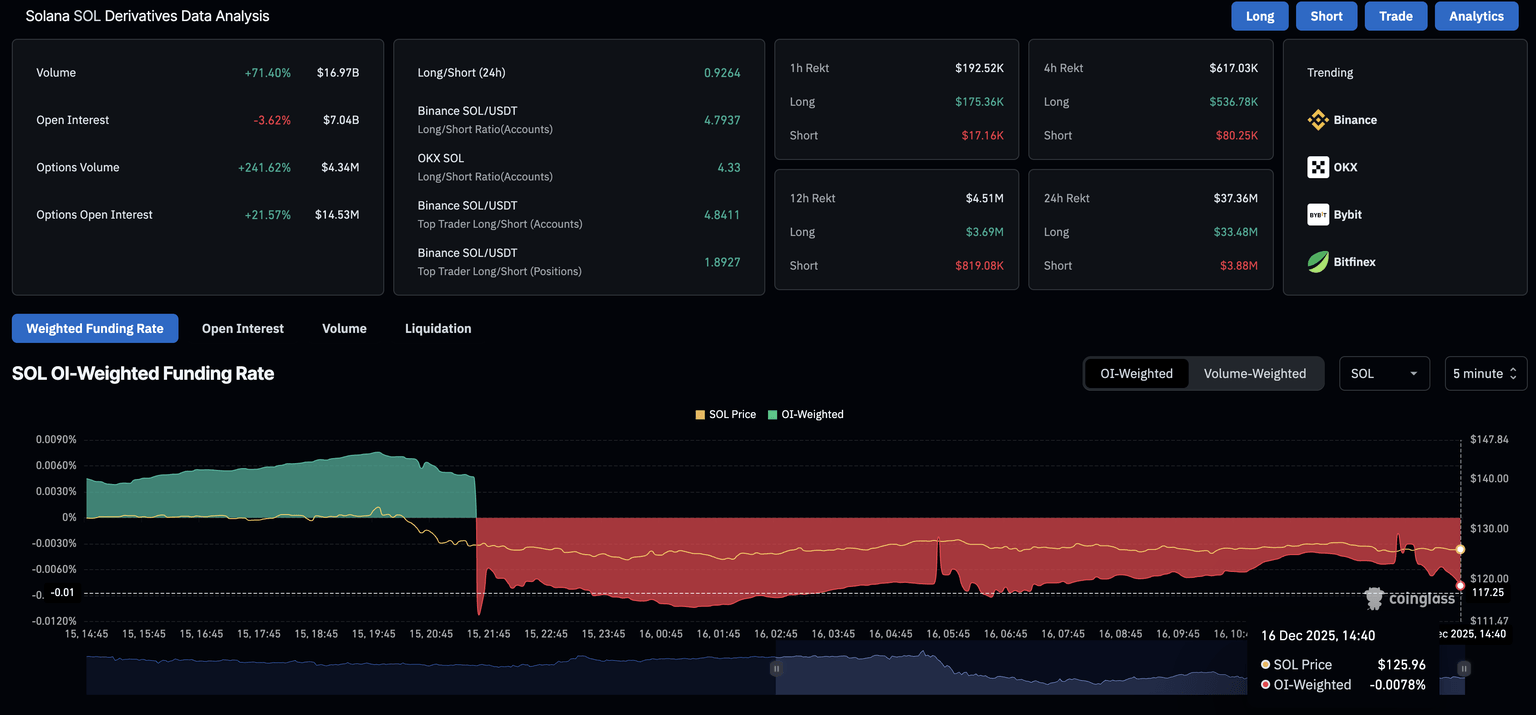
Solana (SOL) remains under bearish pressure, extending its decline for the third consecutive day with over 1% loss at press time on Tuesday. An ongoing Distributed Denial of Service (DDoS) attack on the Solana blockchain, peaking at 6Tbps, remains ineffective so far but continues to add pressure on traders’ sentiment. Additionally, the derivatives market sentiment is bearish, as Open Interest falls and funding rates turn negative.
The United Kingdom’s Financial Conduct Authority (FCA) launched a series of consultations on proposed rules for digital asset markets, marking the next phase in the government’s effort to establish a comprehensive regulatory framework for crypto assets.
DeFi Technologies Inc. finds its equity caught in a complex tug-of-war. The firm announced a significant strategic advancement in South America today, yet its share price continues to grapple with substantial legal overhangs and a softening cryptocurrency market. The central question for investors is whether this operational progress can outweigh persistent financial and legal concerns.
Investor sentiment remains dampened by recent financial disclosures. The company’s third-quarter results, released in November, included a dramatic revision to its full-year 2025 revenue forecast. Management slashed its projection from $218.6 million to approximately $116.6 million—a near-halving of expectations. This guidance cut precipitated an immediate 27% decline in the stock price to $1.05, an impact that continues to linger.
Compounding this financial pressure, several law firms are currently mobilizing shareholders for class action lawsuits. The deadline to join these collective actions is January 30, 2026. Furthermore, the broader digital asset sector is providing little support. Bitcoin corrected into the $85,000 range today, triggering sector-wide liquidations. As DeFi Technologies’ business model is directly tied to digital asset performance, such market downturns affect it acutely. Even positive fundamental news, such as today’s announcement from Visa regarding USDC settlement on the Solana blockchain, is largely lost amid prevailing market risk aversion.
Should investors sell immediately? Or is it worth buying DeFi Technologies?
On the operational front, the company marked a decisive step forward. Its subsidiary, Valour, secured official approval from the B3 exchange on December 16 for the Valour Solana (VSOL) Exchange-Traded Product (ETP). Trading is scheduled to commence tomorrow. This move substantially deepens the firm’s presence in its first major market outside of Europe. The VSOL ETP will join an existing portfolio of already-approved products tracking Bitcoin, Ethereum, XRP, and Sui.
In a parallel development, the Canadian company obtained approval for Brazilian Depositary Receipts (BDRs). These instruments, set to trade under the ticker DEFT31 starting December 17, will provide Brazilian institutional investors with their first opportunity for direct access to the company’s equity.
Market participants now face the challenge of evaluating two divergent narratives. One storyline highlights the concrete execution of the company’s roadmap, evidenced by tomorrow’s launch of new products on a key international exchange. The opposing narrative emphasizes the considerable constraints imposed by the slashed revenue forecast and ongoing legal uncertainties, which significantly cap the potential for a near-term share price recovery. The balance between these operational gains and financial liabilities will likely determine the equity’s trajectory in the coming months.
Ad
DeFi Technologies Stock: Buy or Sell?! New DeFi Technologies Analysis from December 16 delivers the answer:
The latest DeFi Technologies figures speak for themselves: Urgent action needed for DeFi Technologies investors.
Is it worth buying or should you sell? Find out what to do now in the current free analysis from December 16.
DeFi Technologies: Buy or sell?
Read more here…
Copper prices eased on Tuesday, December 16, 2025, extending the market’s pullback from last week’s record highs as traders weighed weaker signals from China’s economy, year-end liquidity conditions, and shifting expectations around U.S. trade policy.
After surging to an all-time high of $11,952 per metric ton on the London Metal Exchange (LME) last Friday, copper has turned more volatile—moving sharply on every new data point and headline about inventories, tariffs, and demand from AI-related infrastructure. [1]
Copper is traded globally across several benchmarks, and prices can differ by exchange and contract month. Here are the key reference points from today’s coverage:
Why the numbers don’t perfectly match: LME “three‑month copper” is typically quoted in $/ton, SHFE in yuan/ton, and COMEX in $/lb. On top of that, outlets reference different timestamps (Asian open vs. London morning vs. close), and some feeds are delayed or contract-specific. [7]
The day’s dominant macro driver was renewed concern about demand in China, the world’s largest copper consumer.
Reuters reporting cited slower factory output growth to a 15‑month low in November, with new home prices continuing to decline—a reminder that the property sector remains a persistent drag. [8]
At the same time, copper’s pullback is not just about China. The market has been wrestling with a second narrative: whether part of the late‑2025 rally has become overly “crowded” and speculative, tied to the idea that AI data centers and electrification will overwhelm supply. Reuters noted that renewed fears of an “AI bubble” contributed to a sharp sell-off after the recent record high. [9]
In plain terms: copper is being traded as both a growth metal and a theme trade. When investors feel confident about global growth and AI capex, copper can behave like a momentum asset. When doubts emerge—about China, tech valuations, or macro conditions—the market can snap back quickly.
Another important piece of today’s copper story is market structure rather than fundamentals.
A separate Reuters update described cautious trading ahead of U.S. jobs data and thinning year‑end liquidity, warning that reduced depth can exaggerate intraday moves. [10] In that report, analysts flagged that base‑metals price action is becoming more jumpy into late December—making copper especially vulnerable given how far it has run this year.
That same Reuters dispatch also highlighted a key “real economy” indicator watched closely by metals desks: the Yangshan copper premium (often used as a proxy for Chinese import demand) has stabilized around $42, described as a two‑month high. [11] This doesn’t erase the weak macro prints from China, but it does suggest that physical market signals are not uniformly bearish.
Even after today’s dip, copper remains one of the standout performers of 2025.
Reuters reporting said copper is up about 33% year-to-date, on track for its biggest annual rise since 2009, driven by a mix of mine disruptions, U.S.-linked inventory flows, and expectations for AI and energy-transition demand. [12]
Those drivers matter because they help explain why copper has been able to set records even while some traditional demand signals (like parts of China’s property market) remain weak.
If there is one theme that repeatedly shows up in today’s copper news cycle, it is this: U.S. tariff risk is influencing real-world copper flows—and, by extension, the price discovery process.
A Reuters item published today said Goldman Sachs raised its 2026 copper price forecast to $11,400 per metric ton(from $10,650). [13]
The same report described the bank’s view that the market is increasingly centered on the timing and design of potential U.S. copper import tariffs. Goldman discussed a scenario framework including:
Goldman also noted that the possibility of future tariffs can keep U.S. copper prices at a premium to the LME benchmark and encourage stockpiling, tightening availability outside the U.S. [15]
Reuters reported that daily inflows to COMEX copper stocks have continued, with inventories already at record highs, a dynamic linked to the price premium and tariff uncertainty. [16]
A Business Insider analysis published today makes a similar point in plain language: large U.S. inventories can become effectively “stuck” in-country, leaving the rest of the world with a tighter tradable pool—one reason the market can feel squeezed even when broader forecasts point to surplus conditions. [17]
One reason copper is so volatile right now is that major institutions disagree on the 2026 balance.
In the same Reuters piece on Goldman’s forecast, the bank lifted its forecast for the 2026 global market surplus to 300,000 tons (from 160,000 tons). [18]
That combination—a higher price forecast alongside a larger surplus estimate—sounds contradictory at first glance. But it becomes more coherent if you think in terms of regional dislocations: copper can be “surplus” globally while still feeling tight in the places that matter most for deliverable exchange stocks and spot premiums, especially if U.S. flows continue to distort availability elsewhere.
A separate Reuters excerpt on Morgan Stanley said the bank expects copper to post a 260,000‑ton deficit in 2025 and a much larger 600,000‑ton deficit in 2026. [19]
Morgan Stanley also flagged that copper inventories outside the United States are low and could shrink further if U.S. imports continue and data-center demand outpaces supply growth. [20]
Bottom line: On Dec. 16, the market is being pulled between two coherent—but different—stories:
Copper’s record pricing is also feeding back into corporate strategy and politics.
A Financial Times report today said the Canadian government has approved the $60 billion merger between Anglo American and Teck Resources, creating one of the world’s biggest copper producers (with the merged entity set to be headquartered in Vancouver, according to the report). [23]
M&A of this scale matters for price watchers because it reflects a broader reality: high-quality copper assets are scarce, project timelines are long, and governments increasingly treat copper supply as strategic—especially with electrification, grid buildouts, and data-center expansion all competing for the same material.
Copper’s direction into late December is likely to depend on a short list of fast-moving variables:
Copper price today is not being set by one single driver—it’s being set by the intersection of China’s uneven recovery, tight supply narratives, AI- and electrification-linked demand expectations, and a uniquely powerful swing factor: U.S. trade policy and stockpiling.
That mix helps explain why copper can sit near record territory while still selling off hard on a weak China print, and why 2026 forecasts can disagree so widely—even among top-tier institutions—without either side sounding unreasonable. [28]
1. www.tradingview.com, 2. www.tradingview.com, 3. www.brecorder.com, 4. www.lme.com, 5. www.tradingview.com, 6. www.investing.com, 7. www.brecorder.com, 8. www.tradingview.com, 9. www.tradingview.com, 10. www.brecorder.com, 11. www.brecorder.com, 12. www.brecorder.com, 13. www.tradingview.com, 14. www.tradingview.com, 15. www.tradingview.com, 16. www.tradingview.com, 17. www.businessinsider.com, 18. www.tradingview.com, 19. www.tradingview.com, 20. www.tradingview.com, 21. www.tradingview.com, 22. www.tradingview.com, 23. www.ft.com, 24. www.tradingview.com, 25. www.reuters.com, 26. www.tradingview.com, 27. www.brecorder.com, 28. www.tradingview.com
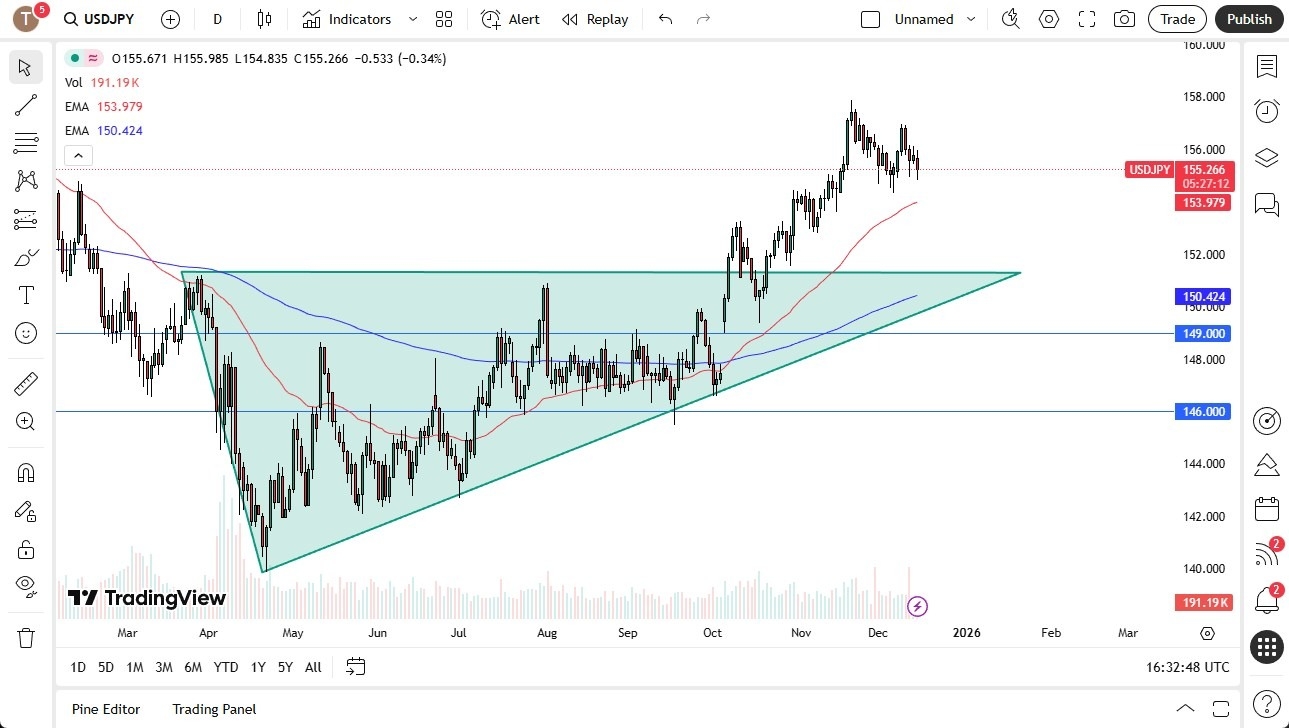
The US dollar initially tried to rally against the Japanese yen but then rolled over to show signs of hesitation on the bullish side. That being said, the 155 yen level does look like it’s trying to offer a little bit of support. And therefore, I think this could end up being a small buying opportunity. I recognize that there are a lot of questions right now about the Federal Reserve and what’s happening next. But at this point, the one thing that I do know is that the interest rate differential will continue to favor the US dollar.

Therefore, over the longer term, it should favor this pair going higher. Even if we were to break down from here, the 50-day EMA comes into the picture at just about 154 yen to offer support and then again at 152 yen, which I think is more likely than not, we do get a little bit of a pullback, but I think it ends up being a buying opportunity. That’ll be especially true once we get through the Bank of Japan later this week.
And therefore, I think a little bit of choppy sideways volatility makes a certain amount of sense. But as I’ve been saying for months, I’ve been holding this pair. I get paid every day to hold this pair. That’s the power of the carry trade. And the carry trade is expected to be a big thing again, especially if the United States remains a little more hawkish than originally thought.
And most of the leading economic numbers in the United States do suggest that 2026 may not be a bad year for the US economy at all. With this, and the fact that the Japanese have a structural problem with the ability to really tighten monetary policy, I think these dips continue to offer buying opportunities if you’re patient enough, probably a much longer-term one, but even shorter-term traders are jumping on this train.
Want to trade our USD/JPY forex analysis and predictions? Here’s a list of forex brokers in Japan to check out.
Christopher Lewis has been trading Forex and has over 20 years experience in financial markets. Chris has been a regular contributor to Daily Forex since the early days of the site. He writes about Forex for several online publications, including FX Empire, Investing.com, and his own site, aptly named The Trader Guy. Chris favours technical analysis methods to identify his trades and likes to trade equity indices and commodities as well as Forex. He favours a longer-term trading style, and his trades often last for days or weeks.
FDA approves drug for women’s sexual health concerns, a new study examines nail fungus impact on athletic performance while supplement labeling rules reviewed.
CLEVELAND — The Food and Drug Administration has approved expanded use of Addyi, a medication designed to address low sexual desire in women, now including post-menopausal women under age 65.
Sprout Pharmaceuticals, the drug’s manufacturer, said the approval represents a significant development in understanding women’s sexual health. Addyi treats hypoactive sexual desire disorder, a condition characterized by persistently low sexual desire. The FDA initially approved the medication in 2015 for premenopausal women. Six years later, Health Canada approved its expanded use for post-menopausal women, paving the way for this U.S. approval.
In separate FDA news, the agency is considering changes to dietary supplement labeling requirements that could affect how consumers see safety warnings. Currently, supplement packages must display a disclaimer next to every health claim stating the FDA has not evaluated the statement and the product is not intended to diagnose, treat, cure or prevent disease. The proposed change would require this warning only once per package rather than repeating it with each claim.
The FDA says the modification would reduce label clutter and costs for manufacturers. However, some medical experts express concern that consolidated warnings could be easier for consumers to overlook. The change carries particular significance given that more than three-quarters of Americans take dietary supplements, and unlike prescription drugs, these products are not reviewed for safety and effectiveness before reaching store shelves. Approximately 100,000 supplement products are currently available nationwide.
Meanwhile, researchers at Case Western Reserve University and University Hospitals have launched the first comprehensive study examining nail fungus in athletes. The condition affects athletes at rates 2.5 times higher than the general population, according to research published in the Journal of the American Academy of Dermatology.
Dr. James Voos, chairman of Orthopedic Surgery at University Hospitals, explained that nail fungus can alter athletic performance by affecting gait, reducing training consistency and impacting competitive outcomes. The six-month study will survey 100 to 200 collegiate and professional athletes across multiple sports, gathering data on how the fungal infections affect daily activities, confidence and athletic function.
Dr. Mahmoud Ghannoum, director of the Center for Medical Mycology at Case Western Reserve and the study’s lead researcher, noted there is limited data showing prevalence rates across different sports despite high-risk factors. Athletes face increased exposure due to warm, moist environments created by intense training, restrictive footwear and shared facilities. Initial results are expected by June, with findings potentially benefiting military personnel and other groups facing similar risk factors.
Bitcoin (BTC) price fell to $85,266 today (Tuesday), December 16, 2025, declining 2.06% from the previous day and extending its losing streak to four consecutive sessions.
The world’s largest cryptocurrency has dropped 30% from its October all-time high of $126,000 and now trades 18% below year-ago levels. This persistent weakness comes despite the Federal Reserve’s third rate cut of 2025, as hawkish forward guidance and elevated correlation with correcting tech stocks override traditional liquidity narratives.
In this article, I answer the question of why Bitcoin is going down today by analyzing the BTC/USDT chart and presenting a current Bitcoin price outlook, drawing on my more than 10 years of experience as an analyst and trader.
Why Bitcoin Is Going Down Today?
At the moment, one Bitcoin is trading at 87,251, although the intraday lows are clearly lower. The price has posted four consecutive declining sessions and has moved decisively away from the 94,000 level that was still observed last week.
Bitcoin price today. Source: CoinMarketCap.com
Federal Reserve Hawkish Pivot Undermines Rally
The Federal Reserve delivered its third consecutive 25-basis-point rate cut on December 10, bringing the target range to 3.50-3.75%, the lowest in three years. However, the central bank’s signal of a potential easing pause in 2026 has triggered risk-off sentiment across digital assets, with Bitcoin proving particularly vulnerable.
“From a macro standpoint, crypto continues to trade in close alignment with traditional risk assets, particularly U.S. equities,” Joel Kruger, crypto strategist at LMAX, explains the macro headwinds. “Correlations remain elevated, reinforcing bitcoin’s role as a proxy for broader risk sentiment. Interest rates, real yields, and the U.S. dollar remain key variables for crypto pricing.”
Ten-year U.S. Treasury yields climbed to 4.2%, the highest since early September, creating unfavorable conditions for non-yielding assets like Bitcoin. The disconnect between rate cuts and rising yields reflects market concerns about persistent inflation and fiscal sustainability, pressuring growth assets across the board.
How Low Can BTC Price Go? Death Cross Pattern Signals Extended Decline
Bitcoin’s technical structure has deteriorated significantly since mid-November when the dreaded “death cross” pattern emerged. On November 16, the 50-day moving average crossed below the 200-day moving average while Bitcoin traded around $93,000-$94,000. This bearish signal remains active as of December 16, with the 50 EMA currently residing near $94,000 and the 200 EMA above $103,000.
According to my technical analysis, the price action shows Bitcoin consolidating at local support between $84,000-$85,000, levels that coincide with lows from April, November, and December. Recent daily data confirms the weakness: Bitcoin fell from $92,494 on December 12 to $86,413 by December 16, testing multi-week lows.
Resistance has formed between $92,000-$94,000, representing May highs and the 61.8% Fibonacci retracement level where the 50 EMA acts as a ceiling. My chart structure suggests bears maintain control, with moving averages aligned in a bearish configuration supporting further downside.
My technical analysis of the Bitcoin chart. Source: Tradingview.com
“Bitcoin is consolidating at multi-month lows, and the chart structure with moving averages suggests bears have the advantage, not bulls,” Arkadiusz Jóźwiak, Editor-in-Chief at Comparic.pl, reinforces the bearish outlook. “Although we could move in either direction from this consolidation, I lean more toward a downside breakout scenario moving toward April minimums.”
BTC Targets $74,000: Capitulation Zone Ahead
Using Fibonacci extensions, the primary technical target sits at $74,000, representing the 161.8% extension of the recent corrective wave and coinciding with 2025 yearly lows. This level represents an expected full capitulation zone where weak hands exit and institutional reaccumulation begins.
Historical data shows Bitcoin testing progressively lower levels: $90,257 on December 14, $88,230 on December 15, and $86,413 on December 16. The critical support level to monitor is $80,000, a sustained break below this threshold would flip market structure decisively bearish and potentially trigger forced liquidations from institutional treasuries and ETF holders defending their balance sheets.
BTC Year-End Dynamics and Reversal Scenarios
Holiday season illiquidity may extend the current consolidation between $84,000-$94,000 before the next directional move materializes. The Bank of Japan meeting on December 19 represents a potential catalyst, as any hawkish tilt could trigger broader currency market volatility and additional pressure on risk assets.
Kruger from LMAX expects range-bound but volatile trading: “Looking ahead, markets are likely to remain reactive to macroeconomic data and policy commentary this week. Absent a clear crypto-specific catalyst, price action may remain range-bound but volatile. Overall, bitcoin and ethereum are expected to trade as high-beta expressions of global risk conditions.”
Despite the bearish technical setup, my bearish scenario would be invalidated by a sustained breakout above $94,000, where the 61.8% Fibonacci retracement and 50 EMA converge. Ultimate bullish confidence returns only with a break above $103,000, where the 200 EMA resides, confirming the death cross reversal.
Changpeng “CZ” Zhao, former Binance CEO, offered perspective on market cycles via Twitter: “If you were ever jealous of people buying crypto on the cheap, and able to hold them through the cycles, think about what they did in moments like this.”
If you were ever jealous of people buying crypto on the cheap, and able to hold them through the cycles, think about what they did in moments like this.
FAQ: Bitcoin Price Analysis Questions
Why is Bitcoin falling today?
Bitcoin is falling due to the Federal Reserve’s hawkish 2026 guidance despite December rate cuts, elevated correlation with correcting Nasdaq tech stocks, active death cross pattern since November 16, and capital rotation from crypto to gold as safe-haven preference intensifies. The 10-year Treasury yield at 4.2% creates unfavorable conditions for non-yielding digital assets.
How low can Bitcoin go in 2025?
Technical analysis using Fibonacci extensions identifies $74,000 as the primary target, representing the 161.8% extension and 2025 yearly lows where full capitulation and institutional reaccumulation is expected. Critical support sits at $80,000, a break below triggers bearish market structure flip. Current consolidation between $84,000-$85,000 represents April/November/December lows.
Will Bitcoin crash further?
The bearish scenario toward $74,000 remains probable while Bitcoin trades below $94,000 resistance and the death cross pattern stays active. Historical death cross patterns precede extended declines, though Bitcoin must fail to bounce within seven days of testing support to confirm another leg down. Sustained breakout above $94,000 (50 EMA, 61.8% Fibonacci) invalidates the bearish thesis.
What is Bitcoin price prediction for 2026?
Current technical setup suggests capitulation at $74,000 before institutional reaccumulation begins. Bullish reversal requires sustained breakout above $103,000 (200 EMA) to confirm death cross invalidation and trend change. Year-end holiday illiquidity may extend $84,000-$94,000 consolidation before next directional move.
When will Bitcoin recover?
Sustained breakout above $94,000 where the 50 EMA and 61.8% Fibonacci retracement converge negates the bearish scenario. Full bullish confidence returns above $103,000 (200 EMA), confirming death cross reversal. The Bank of Japan meeting December 19 could provide near-term catalyst for volatility in either direction.
Before you go, you can also check my previous Bitcoin price predictions:
Cardano’s Foundation Chief Technology Officer (CTO), Giorgio Zinetti, has expressed optimism about a possible cryptocurrency market rebound. In a post on X, Zinetti noted that there are clear indications of this based on prevailing market conditions.
Shift toward AI leaves DeFi building in ailence
According to Zinetti, the volume of Bitcoin active addresses is at a 12-month low, signaling decreased network activity.
Additionally, Bitcoin miners have recorded a 20% drop in revenue as they are earning less, which suggests pressure on the market.
Meanwhile, in the last 70 days, Bitcoin has plunged by over 32% after it hit an all-time high (ATH) of $126,198. This is another clear indication that momentum has waned and sentiment is cooling.
Bitcoin active addresses hit a 12-month low, signaling decreased network activity. Miner revenue down 20% from Q3, indicating potential stress on mining operations. 70 days since the 126K top and we’re down 32%.
Everyone’s talking about AI.
Nobody’s talking about DeFi.
That’s…
Zinetti observed that the current setup is because attention has shifted away from cryptocurrency to artificial intelligence (AI). He maintains that with attention focused on AI, the decentralized finance (DeFi) sector is quietly building.
He noted that the “best DeFi protocols of 2026” are being built right now by different founders.
Zinetti believes that now that attention has shifted to other sectors, the next cycle of winners is laying a solid foundation that could yield massive returns in 2026.
Patience and infrastructure may drive next cycle
In essence, the Cardano Foundation CTO is encouraging market participants to remain patient and ignore the noise and fluctuations.
He wants holders to remember that crypto cycles only reward those who build and invest when no one is paying attention. Overall, Zinetti opines that the DeFi product being shipped can fuel a market rebound heading into 2026.
Interestingly, on Dec. 12, Cardano Founder Charles Hoskinson made an unexpected post that fueled widespread reaction. Notably, he addressed the XRP community regarding the possibility of hosting an XRP DeFi summit, and who should make the list.
Hoskinson’s post suggests possible alignment for interoperability in the altcoin space. It might be the kind of “building” that Zinetti referred to earlier, as attention stays on AI in the interim.
In November, Hoskinson had hinted at an ambitious plan to integrate DeFi into Bitcoin, a move meant to bridge the two blockchains. The aim is to make things easier for users so they can interact with decentralized apps by spending Bitcoin directly.
Platinum prices are extending a standout 2025 rally on Tuesday, December 16, 2025, with spot quotes hovering around the $1,800–$1,830 per ounce zone in early trading—levels last seen in 2011. Data from major bullion dealers showed spot platinum around $1,828/oz in the morning (U.S. time), up roughly 1.6% over 24 hours. [1]
Platinum’s move is notable because it’s happening even as gold cools from recent highs ahead of key U.S. labor-market releases. In one of the day’s most closely watched macro setups, Reuters reported that investors were positioned cautiously ahead of delayed U.S. jobs data, while platinum still pushed higher—helped by both tight-physical-market narratives and fresh focus on European auto-policy decisions that could influence long-term demand for catalytic converters. [2]
Below is a complete, publication-ready roundup of today’s platinum price action, the news drivers moving the market, and the latest forecasts and analyst views shaping expectations into 2026—all based on information available on 16.12.2025.
Because platinum trades around the clock and pricing differs slightly by venue (spot vs. futures), today’s headlines are best understood as a range rather than a single print.
What this means for readers: “Platinum price today” is best framed as roughly $1,810–$1,830 spot, while actively traded futures were probing the mid‑$1,800s, with the day’s top end brushing the $1,860 area. [6]
Reuters described platinum as hitting its highest level since September 2011, even while other precious metals were mixed. In Reuters’ pricing snapshot, spot platinum rose about 1.3% to $1,805.85 during the session, reinforcing the sense that platinum has become a new focal point in the broader precious-metals complex. [7]
That “multi‑year high” label matters in real markets: it tends to pull in momentum traders, systematic strategies, and generalist investors who previously ignored platinum because it spent years lagging gold.
On Tuesday, gold softened as markets waited for delayed U.S. employment reports (covering October and November) and later-week inflation releases—data that can shift expectations about the Federal Reserve’s 2026 rate path. Reuters noted that the jobs release would be missing some details due to disruptions in U.S. data collection following a government shutdown, but it still sits at the center of near-term rate expectations. [8]
Why this matters for platinum specifically:
One of the most platinum-relevant headlines in today’s news cycle is coming out of Brussels.
This doesn’t guarantee a sudden surge in platinum demand—policy details and timelines still matter—but it helps explain why platinum can rally on a day when investors are otherwise cautious ahead of U.S. macro data.
Platinum’s 2025 strength hasn’t been driven by one factor. A recurring theme is tightness in physical availability—and today’s analysis stream added fresh detail.
A Commerzbank note highlighted by FXStreet said Russia’s largest palladium producer published updated forecasts indicating:
That same note emphasized a key nuance: different organizations model “investment demand” differently, and conclusions about whether higher prices are justified can change depending on what you assume about ETFs, bars and coins, and exchange inventory flows. [12]
The World Platinum Investment Council (WPIC) recently projected:
WPIC also pointed to indicators of tightness in the market (lease rates and backwardation), arguing that tight conditions can persist even after a big price run. [14]
Bottom line: Today’s market is balancing two truths at once—(1) platinum has already rallied sharply, and (2) multiple credible outlooks still describe a market that is structurally constrained, even if 2026 trends toward balance.
In a broader precious-metals outlook published today, Reuters reported that Morgan Stanley forecasts platinum at $1,775/oz in 2026 (with palladium at $1,325), citing structural imbalances and different demand drivers across the complex. [15]
That projection is important for two reasons:
The FXStreet/Commerzbank commentary stressed that when you exclude investor demand, WPIC’s framework can even imply oversupply, which would not support further price gains—highlighting why the next phase for platinum may depend heavily on whether investors keep adding exposure via ETFs, bars, coins, and exchange inventory changes. [16]
Technical dashboards won’t tell you why platinum is moving, but they do reveal how crowded the trend may be.
With futures printing up to the mid‑$1,800s and the day’s trading range extending toward $1,861, traders are watching whether the market can hold above the psychologically important $1,800 zone without sharp pullbacks. [18]
Reuters emphasized that markets were focused on U.S. employment data (October and November) and upcoming inflation releases (CPI and PCE). These prints can quickly swing the U.S. dollar, real yields, and risk appetite—all of which can feed into platinum prices. [19]
If the European Commission’s auto-sector package or related political messaging materially changes expectations for the pace of ICE phaseouts, it could influence longer-run projections for catalytic converter demand—especially for platinum and palladium. [20]
The market is acutely sensitive to whether “tightness” is being eased by above-ground stocks, ETF flows, or exchange inventory movements—exactly the variables analysts are debating in today’s research notes. [21]
Platinum’s surge in 2025 is no longer flying under the radar. Today’s pricing shows a metal trading around $1,810–$1,830 spot and mid‑$1,800s in futures, holding near its highest levels since 2011. [22]
The day’s narrative is being driven by:
Meanwhile, the forecast picture is becoming more nuanced: Morgan Stanley’s $1,775/oz 2026 view implies a slower pace after the rally, even as structural constraints remain a core part of the bull case. [26]
Note: Prices are quoted in U.S. dollars per troy ounce and can change rapidly. This article is informational and not investment advice.
1. www.apmex.com, 2. www.reuters.com, 3. www.apmex.com, 4. www.kitco.com, 5. www.investing.com, 6. www.apmex.com, 7. www.reuters.com, 8. www.reuters.com, 9. www.reuters.com, 10. www.reuters.com, 11. www.fxstreet.com, 12. www.fxstreet.com, 13. www.prnewswire.com, 14. www.prnewswire.com, 15. www.reuters.com, 16. www.fxstreet.com, 17. www.investing.com, 18. www.investing.com, 19. www.reuters.com, 20. www.reuters.com, 21. www.fxstreet.com, 22. www.kitco.com, 23. www.reuters.com, 24. www.reuters.com, 25. www.fxstreet.com, 26. www.reuters.com
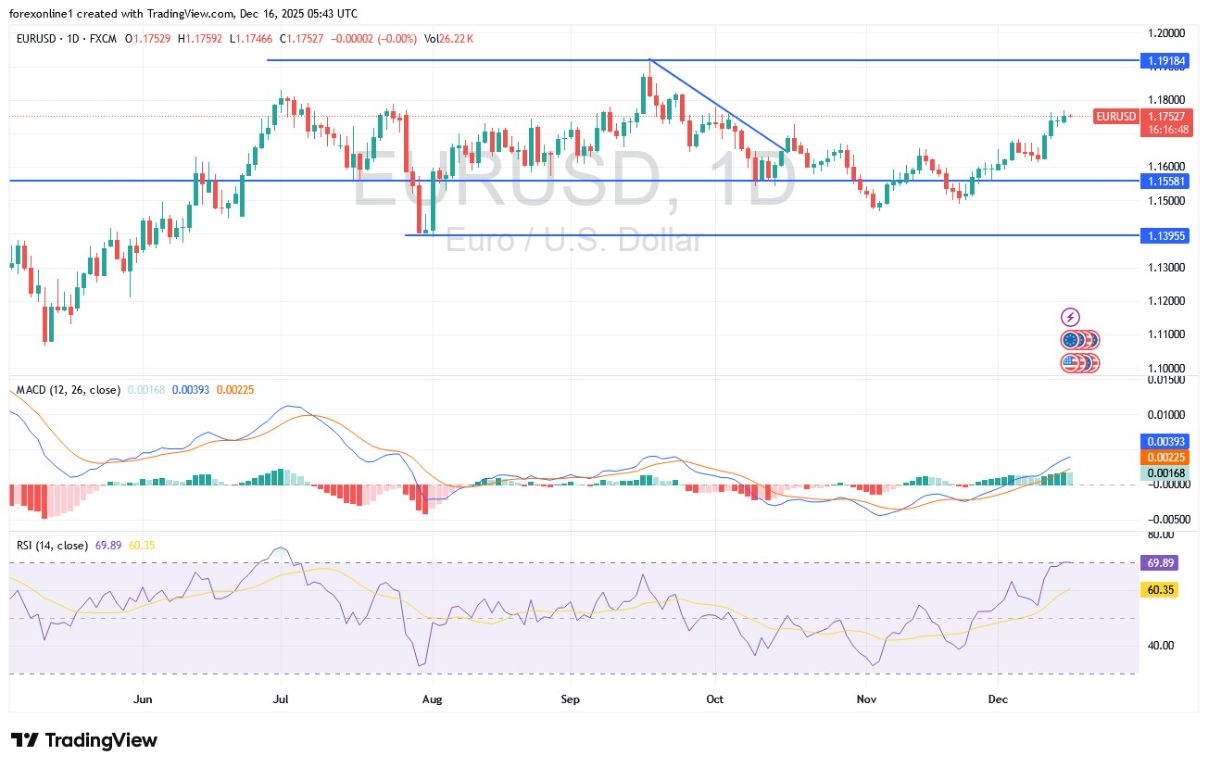
For three consecutive trading sessions, the EUR/USD price has stabilized around its recent upward rebound gains, hovering near the resistance level of 1.1768—the highest for the pair in two months. Overall, based on performance across reliable trading platforms, the rise witnessed in the EUR/USD exchange rate this month indicates it is approaching overbought territory, making it a candidate for a correction amid profit-taking sales.
Technically: The rapid rise in the Euro price recently is pushing the Relative Strength Index (RSI) toward the 70 threshold, the level at which EUR/USD is officially considered overbought. The RSI tends to revert to the mean upon reaching this zone, implying an eventual decline. For this to occur, we need the EUR/USD price to enter a sideways path or a slight downward retreat.
In short, we believe Euro trading will see a slight dip after a strong rally; we would not be surprised to see a pullback below 1.17 this week before the next upward wave. However, charts can only offer limited information in a week marked by major economic data releases.
According to Forex market trading, the EUR/USD exchange rate will be affected by the Eurozone PMI results for December, expected today, Tuesday, starting at 10:15 AM Egypt time. These are expected to confirm continued positive momentum for the region’s economy through the end of the year. Generally, the Eurozone Services PMI is expected to print at 53.3, while the manufacturing sector recovery is expected to confirm a slight rise to 49.9, placing it on the verge of returning to growth.
Overall, strong economic data would support the view that no further interest rate cuts are necessary from the European Central Bank. In fact, a better-than-expected Purchasing Managers’ Index (PMI) reading would reinforce expectations of continued interest rate hikes.
However, the US Dollar’s path will be the primary driver for EUR/USD during this trading week. The release of US labor market data is the standout event in global financial markets. Notably, this data was delayed by the US government shutdown, meaning it will fill a significant data gap. US November jobs data will be released today, Tuesday, at 15:30 Egypt time, with expectations pointing to an increase of 50,000 jobs and an unemployment rate of 4.4%. If the numbers fall below expectations, the market will increase bets on Fed rate cuts in 2026, negatively affecting US bond yields and the Dollar price today.
Conversely, if the data exceeds expectations, these expectations of an interest rate cut will diminish, and the US dollar may rise and potentially continue its gains for the remainder of the week, potentially hindering the euro’s appreciation against the US dollar.
Furthermore, keep an eye on US Retail Sales data, also scheduled for release today at the same time, which will indicate the strength of demand in the economy. Expectations suggest a figure exceeding 0.2% monthly for October. On Thursday, US Inflation (CPI) data will be released, with expectations of a rise to 3.1% annually in November, compared to 3.0% previously.
Obvioulsy, this trend appears unsatisfactory for the Federal Reserve. Any figure higher than expected will cast doubt on market expectations for rate cuts next year, thereby supporting the US Dollar.
Today’s trading session is crucial in determining the fate of the EUR/USD for the remainder of 2025 and will shape the start of the new year’s trading. Be cautious, as we may witness strong and rapid changes in currency prices.
Ready to trade our EUR/USD daily forecast? Here’s a list of some of the top forex brokers in Europe to check out.