The main category of All News Articles.
You can use the search box below to find what you need.
[wd_asp id=1]
The main category of All News Articles.
You can use the search box below to find what you need.
[wd_asp id=1]
The
cryptocurrency market is flashing green during Monday’s trading session, 8
December, 2025, prompting investors to ask why crypto is going up today.
Major assets like Bitcoin, Ethereum, XRP, and Dogecoin are posting gains,
driven by a relief bounce from recent lows.
However,
despite today’s optimism, my technical analysis suggests this is likely a
temporary pause before further declines. Below you can find a detailed
breakdown of the charts for Bitcoin, Ethereum, XRP, and Dogecoin.
The crypto
market is seeing a recovery as volatility begins to normalize. According to
Paul Howard, Director at Wincent, the market is currently establishing a
trading range rather than entering a full-blown bull run.
“We
continue to see cryptocurrency prices closely correlated with global
macro-economic events. Whilst BTC CME volatility has gradually risen the past
few weeks, the return to high 40s is welcome from many traders,” he said.
Bitcoin is
currently supported mainly by the weakening U.S. dollar, which has
fallen to its lowest level since October, as well as a renewed appetite for
risk assets, including equities. The S&P 500 ended last week at 6,870,
its highest level in six weeks.
This week,
investors are focused on the Federal Reserve, which will announce its
interest rate decision on Wednesday.
How does
the technical picture look on the charts? I examine it in the following section
of the analysis.
BTC Current
Price: $92,000
(+1.8%)
During
Monday’s session, Bitcoin (BTC) is trading around $92,000, marking a
second consecutive day of gains. However, according to my technical analysis,
this sideways movement is merely a pause before a continuation of the downtrend
toward my ultimate target: the
April lows of $74,000.
Currently,
I see Bitcoin trapped below a critical resistance zone of $92,000 – $94,000.
On my chart, the price has already printed bearish sell signals twice at this
height, most recently a bearish engulfing pattern between December 3rd and 4th.
Bitcoin technical analysis. Why BTC price is going up today? Source: Tradingview.com
Furthermore,
I am closely watching the “Death Cross” (50-day EMA crossing below
the 200-day EMA) that
formed on November 16. To me, this is a clear signal that current levels
will not hold. I expect the recent lows to be breached, with Bitcoin eventually
descending to my target of $74,000. Only after flushing out the “weak
hands” at that level do I expect a slow re-accumulation and a eventual
return to All-Time Highs, though almost certainly not this year.
“In my
assessment, it is far too early to pop the champagne and announce that the
worst is over,” Arkadiusz Jóźwiak, Crypto Analyst and Editor-in-Chief at
Comparic.pl, said, backing my outlook. “From a technical point of view,
the downtrend will continue as long as Bitcoin does not break new higher
peaks.”
Please also check
my other articles with Bitcoin price predictions and analyses:
ETH Current
Price: ~$3,156
(+3%)
Ethereum
(ETH) is recovering above the psychological $3,000 level, but my
analysis suggests caution. As I observe on the chart, ETH remains stuck in a
month-long consolidation between support at $2,750 and resistance at $3,400.
Similar to
Bitcoin, the moving averages on my chart show a Death Cross, confirming a
dominant downtrend. Consequently, I am betting on a breakdown from this
consolidation rather than a breakout.
If my
bearish scenario plays out, the price will slide toward the June lows of $2,100.
My ultimate bearish target for Ethereum aligns with the April lows, meaning I
see a high probability of ETH falling below $1,500.
Ethereum technical analysis. Why ETH price is going up today? Source: Tradingview.com
XRP Current
Price: $2.09
(+2.6%)
XRP is
enjoying a bounce, but I remain skeptical of this rally. My analysis identifies
a local resistance zone starting at $2.00 and extending to $1.90,
where declines halted in late November.
While the
June lows at this level previously triggered a massive rally to $3.60, the
technical situation today is vastly different. I see strong sell signals,
including another Death Cross, which supports the bears. If the current local
support fails, I assume further depreciation for XRP.
My first
target is $1.61, followed
by an ultimate slide to $1.25, the lowest levels since November
2024.
What would
change my mind? For me to flip bullish, XRP would need to reclaim the
resistance zone between $2.20 and $2.30. The optimal bullish scenario
would require a breakout above $2.70, but until then, I remain bearish.
XRP technical analysis. Why XRP price is going up today? Source: Tradingview.com
DOGE Current
Price: $0.1436
(+3.6%)
Dogecoin (DOGE)
is up 3.6% today, but on my chart, the damage has already been done. DOGE
officially broke through the major support zone I had marked based on the lows
of March, April, and June.
On November
21, the price dipped to $0.1332, proving to me that the buying pressure
has evaporated. In my opinion, the fact that the zone widened without a dynamic
rebound is a significant weakness. The pressure remains strongly bearish as
sellers have pushed the price below key technical levels.
Dogecoin technical analysis. Why DOGE price is going up today? Source: Tradingview.com
For
Dogecoin to relieve this selling pressure, it would need to return to at least $0.20
on my chart. Until that happens, I am treating this as a “hunt for
lows.” If the current fragile support gives way, I
expect a crash toward $0.10, testing the flash-crash levels from
October 10.
The crypto
market is rising today due to a relief bounce and stabilizing global macro
sentiment, as noted by Wincent Director Paul Howard. However, despite the green
charts, technical indicators suggest this is a temporary correction within a
broader downtrend rather than the start of a new bull run.
While
Bitcoin has recovered to $92,000, technical analysis predicts a drop to $74,000
in the coming weeks. A “Death Cross” formation and resistance at
$94,000 suggest that Bitcoin will likely revisit its April lows before any
sustainable long-term recovery begins.
No, it is
unlikely in the short term. Ethereum is currently trapped in a bearish
consolidation between $2,750 and $3,400. Technicals point to a high probability
of a breakdown toward $2,100, with a potential ultimate bottom below $1,500
if the bearish trend confirmed by the 50/200 MA cross continues.
Yes, but caution
is advised. Despite today’s 3.6% gain, Dogecoin has broken major support levels
from earlier this year. Unless DOGE reclaims the $0.20 level, the chart
favors a “hunt for lows” strategy with a price target of $0.10.
Although
XRP is up slightly today, the broader trend is bearish due to a “Death
Cross” signal. Unless XRP breaks above resistance at $2.20-$2.30,
analysts forecast a decline to $1.61 and potentially as low as $1.25.
The
cryptocurrency market is flashing green during Monday’s trading session, 8
December, 2025, prompting investors to ask why crypto is going up today.
Major assets like Bitcoin, Ethereum, XRP, and Dogecoin are posting gains,
driven by a relief bounce from recent lows.
However,
despite today’s optimism, my technical analysis suggests this is likely a
temporary pause before further declines. Below you can find a detailed
breakdown of the charts for Bitcoin, Ethereum, XRP, and Dogecoin.
The crypto
market is seeing a recovery as volatility begins to normalize. According to
Paul Howard, Director at Wincent, the market is currently establishing a
trading range rather than entering a full-blown bull run.
“We
continue to see cryptocurrency prices closely correlated with global
macro-economic events. Whilst BTC CME volatility has gradually risen the past
few weeks, the return to high 40s is welcome from many traders,” he said.
Bitcoin is
currently supported mainly by the weakening U.S. dollar, which has
fallen to its lowest level since October, as well as a renewed appetite for
risk assets, including equities. The S&P 500 ended last week at 6,870,
its highest level in six weeks.
This week,
investors are focused on the Federal Reserve, which will announce its
interest rate decision on Wednesday.
How does
the technical picture look on the charts? I examine it in the following section
of the analysis.
BTC Current
Price: $92,000
(+1.8%)
During
Monday’s session, Bitcoin (BTC) is trading around $92,000, marking a
second consecutive day of gains. However, according to my technical analysis,
this sideways movement is merely a pause before a continuation of the downtrend
toward my ultimate target: the
April lows of $74,000.
Currently,
I see Bitcoin trapped below a critical resistance zone of $92,000 – $94,000.
On my chart, the price has already printed bearish sell signals twice at this
height, most recently a bearish engulfing pattern between December 3rd and 4th.
Bitcoin technical analysis. Why BTC price is going up today? Source: Tradingview.com
Furthermore,
I am closely watching the “Death Cross” (50-day EMA crossing below
the 200-day EMA) that
formed on November 16. To me, this is a clear signal that current levels
will not hold. I expect the recent lows to be breached, with Bitcoin eventually
descending to my target of $74,000. Only after flushing out the “weak
hands” at that level do I expect a slow re-accumulation and a eventual
return to All-Time Highs, though almost certainly not this year.
“In my
assessment, it is far too early to pop the champagne and announce that the
worst is over,” Arkadiusz Jóźwiak, Crypto Analyst and Editor-in-Chief at
Comparic.pl, said, backing my outlook. “From a technical point of view,
the downtrend will continue as long as Bitcoin does not break new higher
peaks.”
Please also check
my other articles with Bitcoin price predictions and analyses:
ETH Current
Price: ~$3,156
(+3%)
Ethereum
(ETH) is recovering above the psychological $3,000 level, but my
analysis suggests caution. As I observe on the chart, ETH remains stuck in a
month-long consolidation between support at $2,750 and resistance at $3,400.
Similar to
Bitcoin, the moving averages on my chart show a Death Cross, confirming a
dominant downtrend. Consequently, I am betting on a breakdown from this
consolidation rather than a breakout.
If my
bearish scenario plays out, the price will slide toward the June lows of $2,100.
My ultimate bearish target for Ethereum aligns with the April lows, meaning I
see a high probability of ETH falling below $1,500.
Ethereum technical analysis. Why ETH price is going up today? Source: Tradingview.com
XRP Current
Price: $2.09
(+2.6%)
XRP is
enjoying a bounce, but I remain skeptical of this rally. My analysis identifies
a local resistance zone starting at $2.00 and extending to $1.90,
where declines halted in late November.
While the
June lows at this level previously triggered a massive rally to $3.60, the
technical situation today is vastly different. I see strong sell signals,
including another Death Cross, which supports the bears. If the current local
support fails, I assume further depreciation for XRP.
My first
target is $1.61, followed
by an ultimate slide to $1.25, the lowest levels since November
2024.
What would
change my mind? For me to flip bullish, XRP would need to reclaim the
resistance zone between $2.20 and $2.30. The optimal bullish scenario
would require a breakout above $2.70, but until then, I remain bearish.
XRP technical analysis. Why XRP price is going up today? Source: Tradingview.com
DOGE Current
Price: $0.1436
(+3.6%)
Dogecoin (DOGE)
is up 3.6% today, but on my chart, the damage has already been done. DOGE
officially broke through the major support zone I had marked based on the lows
of March, April, and June.
On November
21, the price dipped to $0.1332, proving to me that the buying pressure
has evaporated. In my opinion, the fact that the zone widened without a dynamic
rebound is a significant weakness. The pressure remains strongly bearish as
sellers have pushed the price below key technical levels.
Dogecoin technical analysis. Why DOGE price is going up today? Source: Tradingview.com
For
Dogecoin to relieve this selling pressure, it would need to return to at least $0.20
on my chart. Until that happens, I am treating this as a “hunt for
lows.” If the current fragile support gives way, I
expect a crash toward $0.10, testing the flash-crash levels from
October 10.
The crypto
market is rising today due to a relief bounce and stabilizing global macro
sentiment, as noted by Wincent Director Paul Howard. However, despite the green
charts, technical indicators suggest this is a temporary correction within a
broader downtrend rather than the start of a new bull run.
While
Bitcoin has recovered to $92,000, technical analysis predicts a drop to $74,000
in the coming weeks. A “Death Cross” formation and resistance at
$94,000 suggest that Bitcoin will likely revisit its April lows before any
sustainable long-term recovery begins.
No, it is
unlikely in the short term. Ethereum is currently trapped in a bearish
consolidation between $2,750 and $3,400. Technicals point to a high probability
of a breakdown toward $2,100, with a potential ultimate bottom below $1,500
if the bearish trend confirmed by the 50/200 MA cross continues.
Yes, but caution
is advised. Despite today’s 3.6% gain, Dogecoin has broken major support levels
from earlier this year. Unless DOGE reclaims the $0.20 level, the chart
favors a “hunt for lows” strategy with a price target of $0.10.
Although
XRP is up slightly today, the broader trend is bearish due to a “Death
Cross” signal. Unless XRP breaks above resistance at $2.20-$2.30,
analysts forecast a decline to $1.61 and potentially as low as $1.25.
Copper price confirmed the stability of the bullish scenario by its attempt to settle above $5.3200 level, reinforcing the chances of recording new gains in the near sessions, the continuation of providing positive momentum by stochastic will ease the mission of reaching the next target at $5.5000, monitoring it as it formed extra barrier as appear in the above image.
Reaching below $5.3200 and providing negative close might force it to provide corrective trading, which forces it to decline towards $5.1500 before reaching the previously waited target.
The expected trading range for today is between $5.2500 and $5.5000
Trend forecast: Bullish
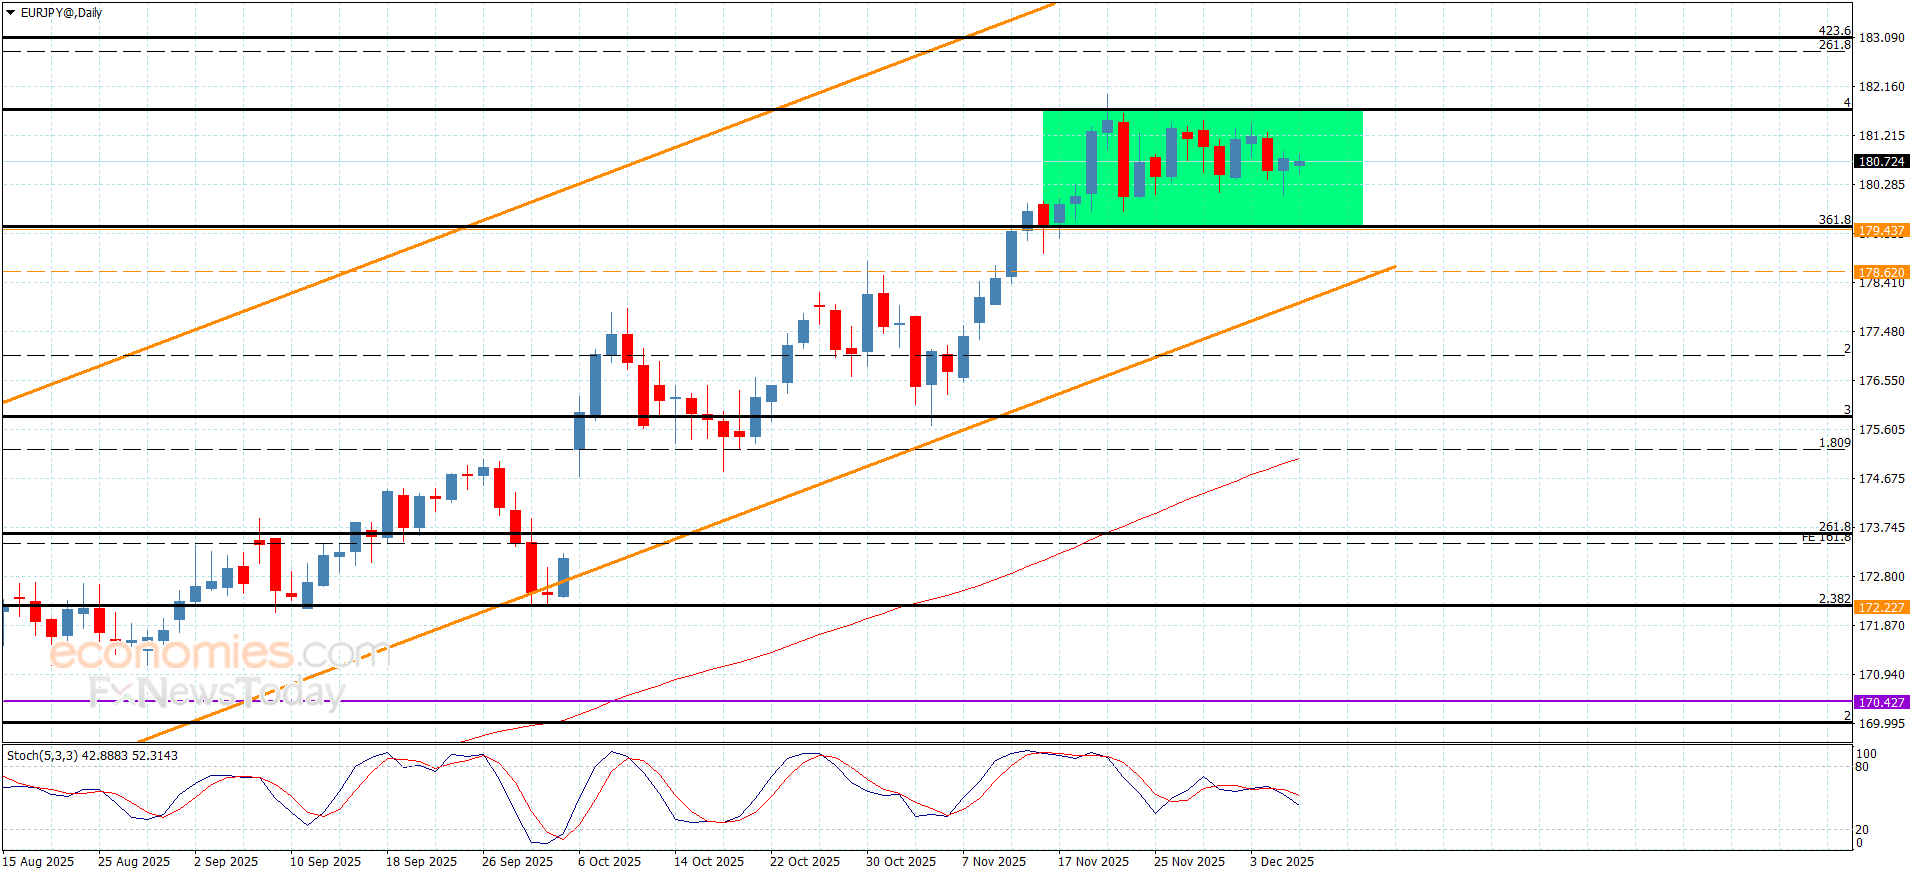
The EURJPY pair remains affected by the dominance of the sideways bias, due to the contradiction between the main indicators, keeping their stability within the sideways track that is represented by 179.40 support, while 181.75 keeps forming strong barrier against bullish attempts.
The main stability within the bullish channel’s levels makes us wait to gather bullish momentum, motivating the bullish attempts by its rally towards 181.35, to attempt to breach the barrier to begin recording new gains by reaching 182.35 and 183.10.
The expected trading range for today is between 180.20 and 181.70
Trend forecast: Fluctuating
The Global Algae Products Market size is expected to be worth around USD 9.6 billion by 2034, from USD 5.1 billion in 2024, growing at a CAGR of 6.5% during the forecast period from 2025 to 2034.
The algae products industry covers biomass-derived ingredients used across food, feed, nutraceuticals, cosmetics, pharmaceuticals, biofertilizers, and sustainable materials. Algae products include proteins, lipids, pigments, hydrocolloids, and functional extracts. Consequently, this market connects climate efficiency with supply security, purity control, and scalable fermentation or cultivation economics.

Algae deliver concentrated nutrition and functional performance using limited land and water. Moreover, microalgae and macroalgae offer rapid biomass cycles supporting year-round output stability. Therefore, businesses value algae for clean-label positioning, traceability, and formulation flexibility across protein enrichment, natural colourants, omega oils, and texture modifiers.
Scientific efficiency strengthens this case. Including NASA-referenced studies, algae account for nearly 50% of Earth’s photosynthesis, converting sunlight into biomass faster than terrestrial crops. Therefore, producers benefit from higher productivity per area with predictable, controllable yields.
Climate performance metrics further support market expansion. One acre of algae can absorb up to 2.7 tons of CO₂ daily, while requiring about 1.87 kilograms of CO₂ per kilogram of algae biomass produced. Hence, algae products align commercial growth with decarbonization goals, strengthening long-term market opportunity.
Macroalgae dominate with 56.2% due to their large-scale cultivation, high biomass yield, and strong acceptance across food, feed, and industrial applications.
In 2024, Macroalgae held a dominant market position in the By Source Analysis segment of the Algae Products Market, with a 56.2% share. This leadership is driven by easy coastal farming, faster growth cycles, and broad usability. Moreover, macroalgae support stable supply chains for food ingredients and hydrocolloids.
Microalgae play a vital supporting role, mainly used in nutraceuticals and functional foods. It offers higher nutrient density and controlled indoor cultivation advantages. However, relatively higher processing costs and infrastructure needs limit its overall share compared to macroalgae.
Blue-Green algae, often used for pigments and supplements, continues to see focused demand. Its role remains niche, supported by antioxidant and protein-rich properties. Still, scalability challenges and regional production constraints impact wider adoption.
Dry dominates with 69.3% due to longer shelf life, easier transportation, and suitability for large-scale food and feed processing.
In 2024, Dry held a dominant market position in the By Form Analysis segment of the Algae Products Market, with a 69.3% share. This dominance reflects its storage stability, reduced microbial risk, and strong compatibility with powders and blended formulations.
The dry form is widely preferred by manufacturers due to cost efficiency and simplified logistics. Moreover, drying allows algae products to retain core nutrients while enabling flexible use across food, supplements, and animal nutrition sectors. Liquid algae products serve applications requiring immediate bioavailability and easy mixing.
These forms are gaining gradual interest in beverages and cosmetics. However, limited shelf life and higher transportation costs restrict faster expansion. Despite slower growth, liquid forms remain important for specialized formulations. Their role continues to support innovation-driven demand, particularly where functional performance outweighs storage efficiency.
Lipids dominate with 23.4% due to rising demand for omega-rich ingredients in nutrition, feed, and bio-based applications.
In 2024, Lipids held a dominant market position in the By Type Analysis segment of the Algae Products Market, with a 23.4% share. Growth is driven by increasing use in dietary supplements, functional foods, and sustainable lipid alternatives.
Carotenoids remain important due to their coloring and antioxidant properties. They are widely used in food products and personal care applications. However, production complexity keeps their market share moderate. Carrageenan and alginates are essential for texturizing and stabilizing applications.
Their presence is strong in food processing and industrial uses, supported by consistent demand for natural hydrocolloids. Algal proteins and other types address emerging plant-based nutrition needs. While demand is growing, these segments continue to evolve as production technologies improve and costs gradually reduce.
Food and Beverages dominate with 33.7% due to strong demand for natural, functional, and clean-label ingredients.
In 2024, Food and Beverages held a dominant market position in the By Application Analysis segment of the Algae Products Market, with a 33.7% share. Consumers increasingly prefer algae for its nutritional value and natural origin. Dietary supplements represent a growing application, supported by wellness trends and rising interest in plant-based nutrients. Algae-based capsules and powders are gaining steady traction among health-focused consumers.
Animal feed applications benefit from algae’s protein and lipid content, improving feed efficiency and nutritional balance. Adoption remains steady as producers seek sustainable feed ingredients. Cosmetics, pharmaceuticals, and other applications contribute incremental demand. These segments focus on bioactive compounds and functional benefits, supporting diversified growth across the overall market.

A clear trend in the algae products market is the shift toward plant-based lifestyles. More consumers are reducing animal-based foods and choosing algae as a natural protein source. This trend supports steady demand across food and supplement categories. Clean-label and transparency trends also influence the market.
Consumers want to know where ingredients come from and how they are produced. Algae brands highlighting sustainable sourcing gain stronger trust and preference. Innovation in product formats is another trend. Algae are now available in gummies, ready drinks, and flavored powders, improving taste and convenience. These formats attract first-time users and younger consumers.
Growing interest in natural, plant-based nutrition is a major driver for algae products. Consumers are looking for clean-label foods with simple ingredients, and algae fit this need well. Products such as spirulina and chlorella are rich in protein, vitamins, and minerals, making them popular in daily diets. Health-conscious consumers prefer algae because they support immune function, digestion, and energy levels.
Algae are also widely used in dietary supplements. Busy lifestyles have increased demand for easy-to-use nutritional sources, and algae powders and tablets are easy to consume. This trend supports steady market growth. In addition, algae-derived ingredients are used in functional foods and beverages, helping brands offer added health benefits.
Despite strong demand, high production costs remain a key restraint in the algae products market. Growing algae requires controlled conditions, specific nutrients, and regular monitoring. These factors increase operating expenses, especially for small and mid-sized producers. As a result, algae products are often priced higher than conventional ingredients.
Limited consumer awareness also restricts growth in some regions. Many consumers still lack a clear understanding of algae benefits, leading to hesitation in adoption. Without proper education, algae-based foods may struggle to reach mainstream acceptance.
The expanding functional food sector presents strong growth opportunities for algae products. Food companies are actively adding algae ingredients to snacks, beverages, and ready-to-eat meals. Algae help enhance nutritional value without major formulation changes, making them attractive to manufacturers.
Animal feed is another high-potential area. Algae improve feed quality and support animal health, especially in aquaculture and poultry farming. As demand for high-quality protein rises, algae-based feed ingredients are gaining attention. The cosmetics and personal care industry also offers opportunities.
Algae extracts are used in skincare products for hydration, anti-aging, and skin repair benefits. Natural beauty trends support this growing use. Emerging markets present long-term growth potential. As income levels rise and health awareness improves, demand for nutrient-rich products increases. Local algae cultivation projects can reduce costs and improve access.
North America holds the leading position in the global algae products market due to strong demand from the food, dietary supplement, and animal nutrition sectors. In 2024, the region accounted for a dominant 45.7% share, reaching a value of USD 2.3 billion, supported by high awareness of plant-based nutrition and clean-label ingredients. Regulatory support for sustainable protein sources and continued investment in algae-based research further strengthen market adoption.
Europe represents a stable and steadily growing market for algae products, driven by strong sustainability goals and a preference for natural ingredients. The region shows increasing use of algae in organic foods, cosmetics, and nutraceuticals, supported by strict regulations favoring eco-friendly raw materials. Consumer interest in vegan diets and low-carbon food sources continues to support long-term growth.
Asia Pacific is emerging as a high-growth region for algae products, supported by large population levels and traditional consumption of algae-based foods. Demand is rising across food processing, aquaculture feed, and dietary supplements, especially in coastal economies. Expanding middle-class income levels and awareness of algae’s nutritional benefits are encouraging wider adoption. The region also benefits from favorable climatic conditions for algae cultivation.
The Middle East and Africa region is gradually expanding in the algae products market, mainly due to increasing interest in sustainable food sources and water-efficient crops. Algae-based solutions are gaining attention for animal feed and nutrition security in arid regions. Government-backed food resilience initiatives and pilot-scale algae cultivation projects support early-stage market growth. However, commercialization remains at a developing stage.

North America
Europe
Asia Pacific
Latin America
Middle East & Africa
In 2024, ACCEL Carrageenan Corporation continues to strengthen its position in the hydrocolloid-based algae products space, particularly for food, dairy, and processed meat applications. The company benefits from established supply chains in key seaweed-growing regions and focuses on consistent quality and functional performance, which makes it a preferred partner for formulators seeking texture, stability, and clean-label positioning in both mature and emerging markets.
Algatechnologies Ltd remains a reference player in high-value microalgae ingredients, especially for astaxanthin and other premium nutraceutical applications. In 2024, the company’s strategy revolves around capacity optimization, advanced cultivation technologies, and strong branding around science-backed health benefits, positioning it well in the fast-growing segments of healthy aging, sports nutrition, and eye-health supplements.
Algenol is an important innovation-driven participant, focusing on utilizing algae for biofuels, carbon capture, and related industrial applications. In 2024, its value lies less in sheer volume and more in technology platforms, IP, and pilot-to-commercial pathways that demonstrate how algae can contribute to decarbonization, circular carbon utilization, and energy diversification strategies for governments and large industrial customers.
Archer-Daniels-Midland Company brings scale, global reach, and integrated agricultural supply chains to the algae products market in 2024. Leveraging its capabilities in ingredients, processing, and formulation support, the company is well placed to embed algae-derived components into food, feed, and specialty ingredient portfolios, while aligning them with macro trends around alternative proteins, sustainability, and value-added nutrition for both human and animal markets.
Risk Warning: this article represents only the author’s views and is for reference only. It does not constitute investment advice or financial guidance, nor does it represent the stance of the Markets.com platform.When considering shares, indices, forex (foreign exchange) and commodities for trading and price predictions, remember that trading CFDs involves a significant degree of risk and could result in capital loss.Past performance is not indicative of any future results. This information is provided for informative purposes only and should not be construed to be investment advice. Trading cryptocurrency CFDs and spread bets is restricted for all UK retail clients.
Please Register or Sign in to view this content.
Quantum Commodity Intelligence is a premium paid subscription service for professionals in the oil, biofuels, carbon, ammonia and hydrogen markets.
Quantum Oil service subscribers have access to:
Get in touch with us for subscription information on all Quantum platforms, or help with the service.
– Written by
Tim Boyer
STORY LINK Pound-to-Dollar Forecast: Will GBP/USD Rally on FED This Week?
The Pound to Dollar exchange rate (GBP/USD) stalled above 1.3350 after a strong run, with both the Fed and BoE poised to cut rates this month.
Long-term forecasts diverge sharply, with some banks expecting gains toward 1.45 while others see a slide back to 1.30 by 2026.
Direction now hinges on how aggressively the Fed eases next year and whether a new Chair injects political risk into US policy.
Credit Agricole forecasts that GBP/USD will retreat to 1.30 by the end of 2026, although it does see gains to 1.40 by the end of the following year.
In contrast, Bank of America forecasts that GBP/USD will strengthen to 1.45 at the end of 2026.
According to Bank of America; In reality, markets have been reluctant to price in good news, preferring to trade bearish GBP news into the budget.
Get better rates and lower fees on your next international money transfer.
Compare TorFX with top UK banks in seconds and see how much you could save.
GBP/USD posted net gains to 5-week highs above 1.3350 before stalling.
Federal Reserve policy will be a key element for currency markets. Traders are pricing around 86% odds of Fed cut this week, and potentially 2-3 more reductions next year.
There will also be a new Fed Chair from May which could trigger a notable shift in direction.
There has been increased speculation that President Trump will nominate Director of the National Economic Council Kevin Hassett to be the next Chair.
Such an appointment would increase concerns over increased political influence.
ING also noted potential risks to the US currency; “We are mildly bearish on the dollar into 2026 as the Fed brings the policy rate down to neutral. We see risks skewed to the dollar’s downside should a more politically minded Fed take US real rates a lot lower or even be dragged into a scheme to target longer-dated Treasury yields.”
Danske Bank has adjusted its forecast; “We expect the Fed to cut rates by 25bp in December, March and June (prev. January, April and July), and then maintain the terminal rate of 3.00-3.25% through the rest of 2026 and 2027.”

It noted a high degree of uncertainty; “Sudden slowdown in private consumption could tilt the Fed towards resuming more aggressive rate cuts, but the persistent fiscal easing could also force the Fed to maintain rates at a structurally higher level than we assume.”
Credit Agricole, however, expects no cuts in 2026; “Policy uncertainty to fade and dovish Fed market expectations to be put to the test by a resilient US economy and sticky inflation that would further render any fiscal dominance attempts costlier for the Trump administration ahead of the all-important US mid-term elections.”
There are also strong expectations that the Bank of England will cut rates in December while 2026 policy decisions will be a key element.
Barclays commented; “The BoE is expected to slow the pace of policy easing in 2026, this is contingent on inflation remaining contained and the labour market staying stable”
The bank did add; “some slack is starting to appear in the labour market. Should the unemployment rate surpass 5%, the central bank may ease more aggressively in a bid to support real disposable income and consumption.”
International Money Transfer? Ask our resident FX expert a money transfer question or try John’s new, free, no-obligation personal service! ,where he helps every step of the way,
ensuring you get the best exchange rates on your currency requirements.
TAGS: Pound Dollar Forecasts
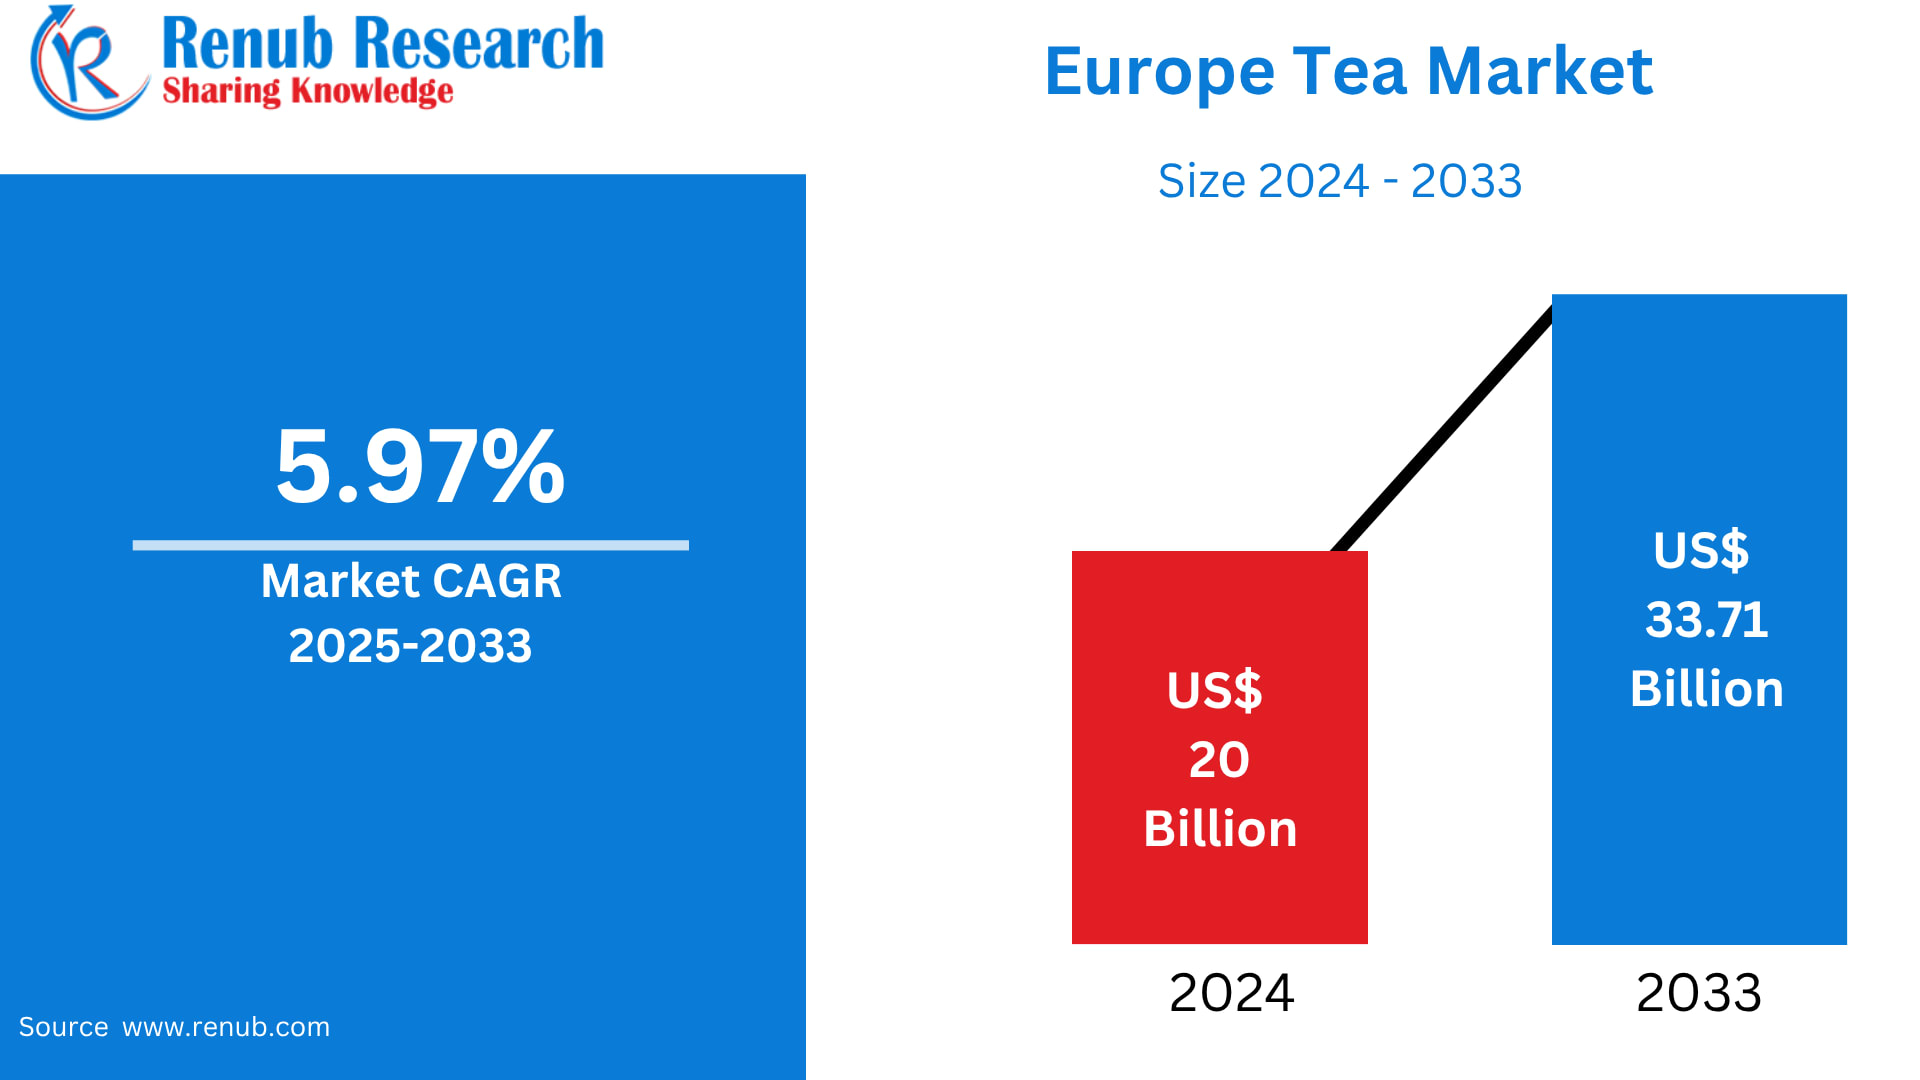
The Europe Tea Market is entering a dynamic new phase marked by stronger consumer focus on health, sustainability, premium blends, and digital retail experiences. According to Renub Research, the Europe Tea Market is anticipated to grow from US$ 20 billion in 2024 to US$ 33.71 billion by 2033, expanding at a CAGR of 5.97% between 2025 and 2033.
This momentum reflects not only Europe’s longstanding tea culture but also a new wave of demand led by wellness-oriented consumers, specialty tea startups, and innovative retail channels reshaping how Europeans buy and consume tea.
Tea is one of Europe’s most cherished beverages—steeped in tradition yet continuously reinvented. Derived from the leaves of Camellia sinensis, tea comes in many varieties including black, green, white, oolong, and herbal blends. Each form carries unique flavor notes, caffeine levels, and processing styles.
Herbal infusions such as chamomile, peppermint, hibiscus, and rooibos—naturally caffeine-free—have gained mainstream popularity as daily wellness beverages.
Tea is not only enjoyed for its comforting flavor and aroma but also for its well-documented health benefits. Rich in antioxidants like catechins and polyphenols, tea supports digestion, immune function, cardiovascular health, and mental relaxation. Herbal infusions remain deeply associated with natural healing—often used for sleep, cold relief, digestive issues, and stress management.
Within Europe, tea’s popularity spans major markets such as the United Kingdom, Ireland, Germany, France, and Russia. While black tea remains the most consumed category, green, herbal, and organic teas are fast gaining momentum. The rise of meditation, relaxation rituals, and wellness routines has further propelled the market, giving rise to premium tea salons, artisanal blends, and curated tea experiences.
Growing emphasis on sustainable sourcing, fair-trade certifications, and eco-friendly packaging is also redefining consumer expectations. As more Europeans replace sugary drinks with healthier options, tea continues to cement its position as a versatile, low-calorie beverage offering both comfort and health benefits.
Key Growth Drivers Fueling the Europe Tea Market
1. Rising Health & Wellness Awareness
Across Europe, consumers are replacing high-sugar beverages and even traditional coffee with healthier tea alternatives. Green tea, functional teas, and herbal infusions are gaining traction for their perceived benefits—ranging from detoxification and improved metabolism to immunity and mental calm.
COVID-19 played a pivotal role in accelerating this trend, pushing households to seek natural, immunity-enhancing beverages.
March 2024: Twinings launched a new line of functional tea blends designed for European consumers, infused with botanicals aimed at supporting immunity, digestion, and sleep.
As wellness becomes a lifestyle rather than a trend, tea’s role as a natural health beverage will continue to expand.
2. Surge in Specialty, Premium & Organic Tea
Premiumization is transforming the European tea landscape. Consumers—especially millennials—are experimenting with:
Single-origin teas
Luxury blends
Artisanal loose-leaf teas
Organic and ethically sourced varieties
Specialty tea houses, curated subscription boxes, and immersive store experiences are elevating tea into a lifestyle category.
January 2024: Unilever PLC introduced a premium organic tea collection with innovative eco-friendly packaging aimed at the health-conscious European audience.
This shift has opened new opportunities for boutique brands that emphasize authenticity, craftsmanship, and storytelling.
3. Rapid Expansion of E-Commerce & Digital Retail
Europe’s online tea market has witnessed exponential growth driven by convenience, variety, and influencer-driven discovery. Platforms offer access to rare, international, and niche brands not easily found in supermarkets.
Subscription models—offering monthly curated tea boxes—have become particularly popular among younger drinkers.
In the UK, online tea sales surged 70% in 2022, according to the British E-commerce Association.
Digital retail’s ability to personalize recommendations and deliver targeted wellness messaging has made it a critical distribution channel shaping the future of the industry.
Key Challenges in the Europe Tea Market
1. Market Saturation & Competition
Western Europe’s tea market is mature, with numerous local and global players battling for visibility. Price competition, limited shelf space, and strong brand loyalty create barriers for new entrants.
In markets like the UK, where tea drinking is deeply rooted, growth has plateaued. Brands must differentiate through premiumization, storytelling, health claims, or sustainability to remain competitive.
2. Volatile Raw Material Costs & Climate Impact
Tea production depends heavily on climatic conditions. Erratic weather in major producing nations—India, Kenya, China, and Sri Lanka—can lead to:
Crop damage
Cost fluctuations
Supply-chain disruptions
Rising shipping and energy costs further pressure European importers. Balancing affordability with ethical sourcing and sustainability commitments remains a key challenge across the industry.
Segment Analysis of the Europe Tea Market
Europe Green Tea Market
Green tea is witnessing a substantial surge in demand due to its antioxidant-rich profile and metabolism-enhancing properties. Fitness-focused and urban consumers are driving this category. Available as loose-leaf, tea bags, and ready-to-drink products, green tea’s versatility has broadened its reach.
Europe Black Tea Market
Black tea remains Europe’s staple—especially in the UK, Ireland, and Russia. Known for its strong flavor and caffeine content, it continues to dominate household consumption. Premium black teas, flavored blends, and organic variants are helping the category maintain relevance amid rising competition from herbal teas.
Europe Loose Tea Market
Loose-leaf tea is gaining traction among tea connoisseurs due to its superior aroma and flavor. Seen as more natural and eco-friendly compared to tea bags, loose tea is thriving through specialty stores and online platforms.
Europe Tea Bags Market
Tea bags remain the most popular format for everyday convenience. The segment is dominated by established brands offering black, flavored, and herbal variants. Innovations such as biodegradable bags, pyramid sachets, and premium infusions are rejuvenating the category.
Application & Distribution
Europe Residential Tea Market
Home consumption remains the largest segment, reinforced by increasing wellness habits and pandemic-era lifestyle changes. Consumers gravitate towards bulk packs, organic blends, and herbal infusions.
Europe Specialty Stores Market
Boutique tea stores—especially in Germany, France, and the Netherlands—offer premium experiences with single-origin teas, botanical blends, and guided tastings. These outlets play a crucial role in shaping educated, discerning tea consumers.
Europe Online Tea Market
E-commerce continues to surge across all major markets. Online stores enable:
Access to global brands
Subscription models
Customized tea curation
Broader product comparison
Influencer marketing and wellness content amplify digital engagement.
Country-Level Insights
Germany Tea Market
Germany has one of Europe’s most diverse tea cultures, with strong demand for fruit, herbal, and green teas. Organic preferences run deep among younger consumers. Specialty stores and private labels contribute significantly to the market’s growth.
United Kingdom Tea Market
Tea is synonymous with British culture, with black tea still dominating daily consumption. However, green, herbal, and functional teas are rapidly emerging. Sustainability, premium blends, and ethical sourcing are central to modern consumer preferences.
Russia Tea Market
Russia remains one of Europe’s biggest tea consumers, with a strong preference for black and fermented teas. Young consumers are gravitating toward green, fruit, and herbal infusions. Despite economic fluctuations, local production and online retail have helped sustain market growth.
France Tea Market
France’s tea landscape is shaped by an appreciation for premium, beautifully packaged products. Green tea and herbal blends appeal strongly to wellness-focused consumers. Tea is seen as a lifestyle beverage, often linked to cafés, fine dining, and artisanal experiences.
Market Segmentation Overview
Product Type
Green Tea
Black Tea
Oolong Tea
Others
Packaging
Plastic Containers
Loose Tea
Paper Boards
Aluminium
Tea Bags
Others
Application
Residential
Commercial
Distribution Channel
Supermarkets & Hypermarkets
Specialty Stores
Convenience Stores
Online Stores
Others
Countries Covered
France, Germany, Italy, Spain, United Kingdom, Belgium, Netherlands, Russia, Poland, Greece, Norway, Romania, Portugal, Rest of Europe
Key Companies (with 5 Viewpoints Each)
Associated British Foods Plc
Tata Consumer Products Limited
Unilever
Barry’s Tea
Taetea Group
Final Thoughts
Europe’s Tea Market is undergoing a profound transformation, driven by lifestyle changes, wellness trends, and consumer appetite for premium, sustainable, and experiential products. With the market set to reach US$ 33.71 billion by 2033, the industry’s future is defined by innovation—ranging from functional botanicals and artisanal blends to eco-friendly packaging and immersive digital retail strategies.
Tea is no longer just a traditional household beverage in Europe—it’s a symbol of health, culture, luxury, and mindful living. Brands that embrace authenticity, sustainability, and wellness-driven storytelling are poised to lead the next decade of growth.
DappRadar announced it will shut down after seven years of operation. The platform cited financial unsustainability as the reason for closure. The RADAR token dropped approximately 30% immediately following the announcement on Nov. 17.
The service tracked dapps and decentralized applications across multiple blockchain networks. Services will stop “in the coming days” and the company will cease tracking blockchains and dapps, according to DappRadar’s official announcement on X.
Founders Skirmantas Januškas and Dragos Dunica stated that “running a platform of this scale became financially unsustainable in the current environment.”
RADAR reached $0.00067 at the time of the announcement. The price decline occurred within hours of the shutdown announcement.
DappRadar was founded in February 2018, inspired by the CryptoKitties boom of late 2017. The platform tracked 18,111 dapps across 93 blockchains. It served approximately 500,000 monthly users based on official website data from March 2025.
During its lifetime, the company raised $7.33 million across two funding rounds, according to Tracxn. The funding consisted of a $2.33 million seed round in September 2019 and a $5 million Series A round in May 2021. Investors included Prosus and Lightspeed Venture Partners.
The company is based in Kaunas, Lithuania, and employed an unspecified number of employees, anywhere between 11 and 50 people.
The DappRadar DAO treasury holds $1,602,289 in total assets at the time of writing. RADAR tokens account for $1,554,802 or 97% of the treasury holdings. The treasury also holds $46,162 in USDT stablecoins. Additional assets include approximately $1,325 in Ethereum and SAFE tokens. The treasury holds 2.34 billion RADAR tokens or 23.4% of the total 10 billion token supply.
Treasury records show approximately $163,000 in stablecoin outflows through November 2025, indicating a monthly operational burn rate of around $15,500. At this spending rate, current stablecoin reserves provide approximately three months of runway. The treasury’s RADAR tokens remain unliquidated.
The dapp analytics space includes competitors such as DeFiLlama and Dune Analytics. DeFiLlama operates as a TVL aggregator tracking popular chains and dapps with open-sourced data.
Platform operational challenges have affected multiple crypto services in recent months. Stream Finance suspended withdrawals in November following a $93 million loss by an external fund manager. Recent developments also include Polymarket’s UFC partnership announced on Nov. 13.
Copper price confirmed the stability of the bullish scenario by its attempt to settle above $5.3200 level, reinforcing the chances of recording new gains in the near sessions, the continuation of providing positive momentum by stochastic will ease the mission of reaching the next target at $5.5000, monitoring it as it formed extra barrier as appear in the above image.
Reaching below $5.3200 and providing negative close might force it to provide corrective trading, which forces it to decline towards $5.1500 before reaching the previously waited target.
The expected trading range for today is between $5.2500 and $5.5000
Trend forecast: Bullish