The main category of All News Articles.
You can use the search box below to find what you need.
[wd_asp id=1]
The main category of All News Articles.
You can use the search box below to find what you need.
[wd_asp id=1]
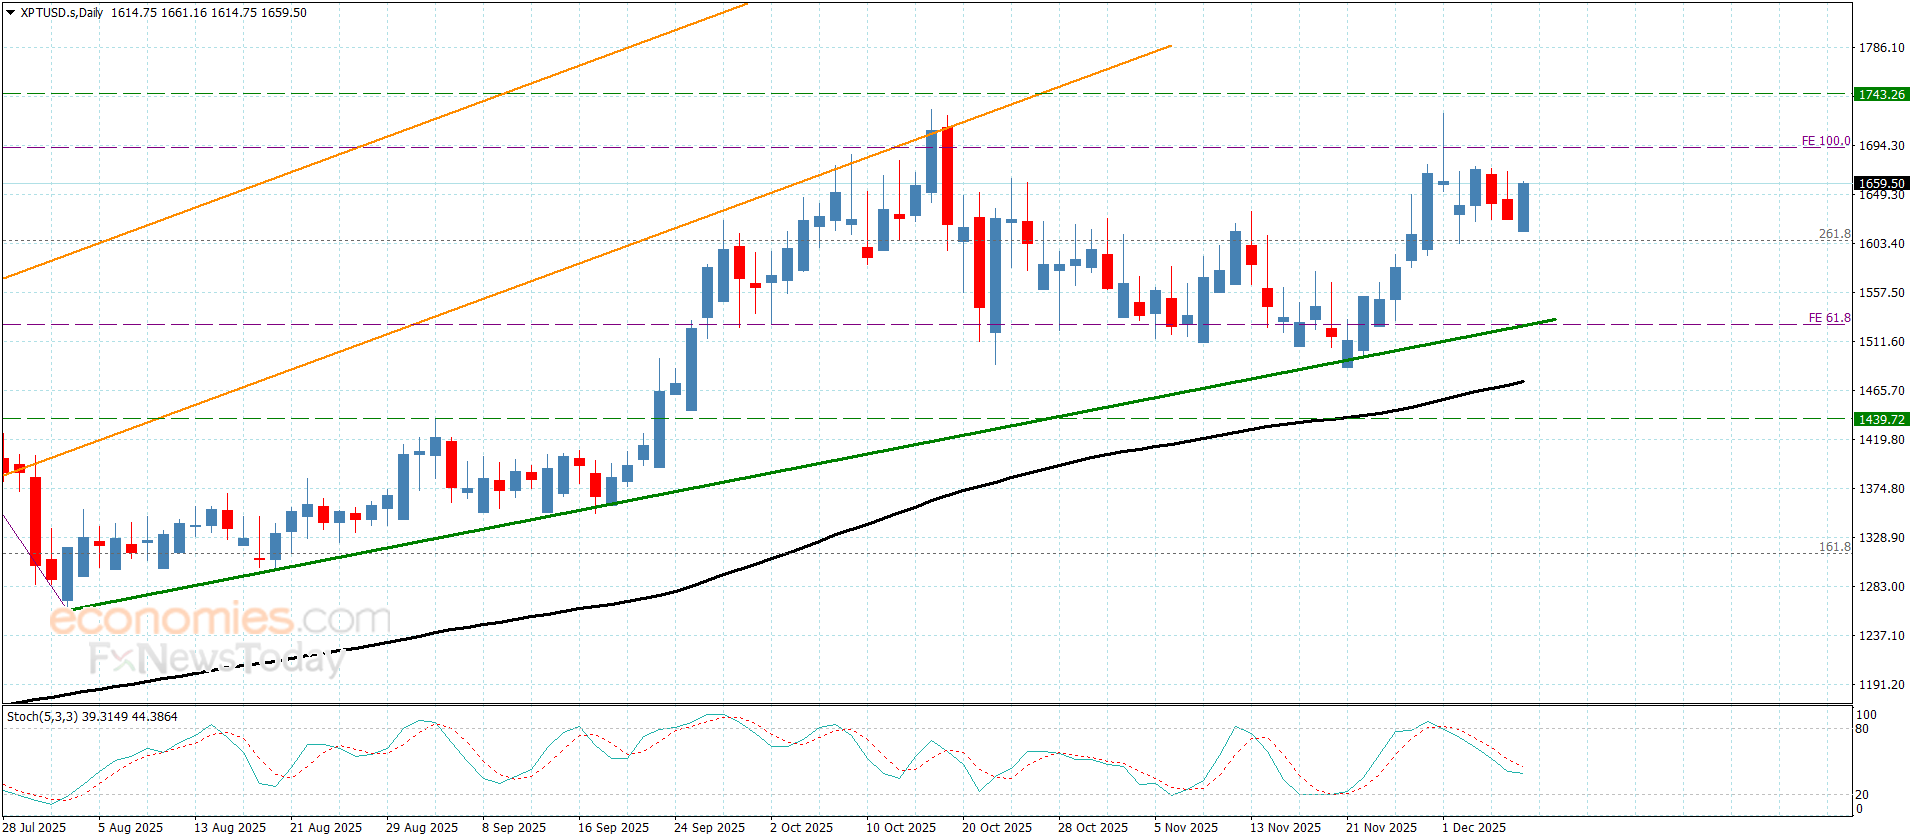
Copper price confirmed the stability of the bullish scenario by its attempt to settle above $5.3200 level, reinforcing the chances of recording new gains in the near sessions, the continuation of providing positive momentum by stochastic will ease the mission of reaching the next target at $5.5000, monitoring it as it formed extra barrier as appear in the above image.
Reaching below $5.3200 and providing negative close might force it to provide corrective trading, which forces it to decline towards $5.1500 before reaching the previously waited target.
The expected trading range for today is between $5.2500 and $5.5000
Trend forecast: Bullish
The Australian industry’s export success over the past decade has largely been driven by trade with China. Total exports are now valued at $1.02bn.
Today, China (including Hong Kong) continues to dominate as the largest export destination, accounting for $690million, or 68 per cent of total exports.
However, diversification is gathering pace, with Vietnam strengthening its position as the second-largest market ($86 million, 8 per cent), followed by New Zealand ($49 million, 3 per cent), South Korea ($32 million, 3 per cent) and Thailand ($31 million, 3 per cent).
The data was revealed in trade body Complementary Medicine Australia’s (CMA) 2025 Industry Snapshot, which was launched at its annual summit, attended by NutraIngredients, last week.
The report also noted that new export opportunities were also arising, noting that “emerging demand in the United Arab Emirates further highlights Australia’s growing footprint in premium health and wellness products. Together, these markets reflect both resilience and opportunity, driven by rising incomes, a stronger focus on preventive health and ongoing demand for clean, safe and evidence-based products.”
Despite this, China remains the anchor market for Australian supplements, both as a direct export destination and through cross-border e-commerce.
The report stated that E-commerce continues to dominate distribution, now accounting for more than 60 per cent of China’s supplement sales in 2025.
“Innovation in formats such as gummies, vegan and plant-based supplements, and beauty-linked products is closely tied to these digital retail channels, providing powerful cross-border pathways for Australian brands reach Chinese consumers who increasingly value quality, authenticity and transparency,” it added.
“Australia’s reputation for ‘clean and green’ products, combined with its world-class manufacturing standards and regulatory alignment, ensures that demand from Chinese consumers remains robust.”
Meanwhile, Vietnam has rapidly emerged as one of the most dynamic markets for Australian exports. In 2024, exports reached $86 million, representing 8 per cent of Australia’s total exports and consolidating Vietnam’s position as the second-largest destination after China.
The report added: “E-commerce is playing an increasingly central role in Vietnam’s health and wellness market. From a single-digit share in 2015, online sales now account for more than 20 per cent of complementary medicines purchases by 2025. This shift has been accelerated by high digital engagement, with Vietnamese consumers turning to online platforms for convenience, product discovery and trusted international brands.
”For Australian exporters, Vietnam represents a powerful diversification opportunity. Rising disposable incomes, an expanding middle class, and strong consumer trust in Australian made products combine to create fertile ground for growth.”
Beyond China and Vietnam, other markets combine to generate a quarter of Australia’s export revenue, with India standing out as one of the other fastest-growing opportunities.
“The country’s complementary medicines market is forecast to expand at 9.0 per cent CAGR to 2030, with sports nutrition emerging as a breakout category at 15.9 per cent CAGR. This reflects India’s rapidly urbanising population, a surge in fitness culture, and increasing adoption of preventive health solutions among younger consumers,” the report noted.
Thailand and Malaysia are also demonstrating solid growth momentum. In Thailand, the complementary medicines market is projected to expand at steady rates, with sports nutrition growing at 8.0 per cent CAGR.
Malaysia is experiencing even faster growth, with sports nutrition up 10.4 per cent CAGR, supported by high health awareness and rising incomes. Ingestible beauty is also booming across ASEAN – beauty ranks among the top vitamin and dietary supplements categories in Thailand, Malaysia, and Singapore.
CMA CEO John O’Doherty said trust was a key factor in achieving exports growth.
“Trust – both at home and abroad – remains one of our industry’s greatest strengths,” he said.
“In 2025, 84 per cent of Australians expressed confidence in the safety and quality of complementary medicines, while international consumers consistently rank Australian-made products among the most trusted in the world. ‘Made in Australia’ continues to carry exceptional value, particularly in Asia, where exports exceeded $1 billion in 2024. As trade diversifies across South East Asia and emerging markets, our reputation for integrity and quality will continue to set Australia apart.”
Gold is trading around a flat line near the $4,200 mark, starting a crucial US Federal Reserve (Fed) week on a cautious footing.
Amid sustained US Dollar (USD) weakness and simmering geopolitical tensions between Japan and China, Gold buyers continue to provide a floor while sellers keep lurking at higher levels.
The upside remains guarded, anticipating a probable hawkish guidance from the Fed this week. The Fed is widely expected to lower the interest rates by 25 basis points (bps) to 3.5%-3.75%, with the odds currently sitting close to 90%, the CME Group’s FedWatch Tool shows.
The Fed’s outlook on the 2026 rate path will also hold the key, leaving Gold wavering in a tight range at the start of the week on Monday.
The recent series of unimpressive US economic data continues to favor the dovish Fed expectations.
Meanwhile, markets remain cautious after Japanese Defence Minister Shinjiro Koizumi reported on Sunday, Chinese fighter jets twice directed fire-control radar at its F-15 aircraft over international waters near Okinawa.
On the other hand, Beijing accused Japanese jets of interrupting their air training.
Gold finds additional support from a solid growth in China’s Exports for November, with both the Yuan and USD-denominated jump reported at 5.7% and 5.9%, respectively. China is the world’s top yellow metal consumer.
In the day ahead, Gold will continue to take cues from broad market sentiment in the absence of top-tier US economic data. Geopolitical developments in Asia will also be closely monitored.
In the daily chart, the 21-day Simple Moving Average (SMA) climbs above the 50-, 100-, and 200-day SMAs, with all slopes rising and price holding above them, reinforcing a bullish bias. The 21-day SMA at $4,147.93 offers nearby dynamic support, while the 50-day SMA at $4,084.46 underpins the advance. The Relative Strength Index (RSI) sits at 61.33, edging higher from 60.31 and signaling firm, but not overbought, momentum. Measured from the $4,381.17 high to the $3,885.84 low, the 61.8% retracement at $4,191.95 has been surpassed, hinting the prior bearish phase is losing strength.
Upside extension faces resistance at the 78.6% retracement at $4,275.16; a decisive close above this barrier would open the path toward the prior top. If buyers fail to sustain above the 61.8% marker, a pullback could revisit the 50% retracement at $4,133.50. Beneath that, trend support remains defined by rising moving averages, with the 50-day SMA cushioning the downside. Overall, momentum and trend alignment favor dips being bought while Fibonacci thresholds frame the next directional cues.
(The technical analysis of this story was written with the help of an AI tool)
Monetary policy in the US is shaped by the Federal Reserve (Fed). The Fed has two mandates: to achieve price stability and foster full employment. Its primary tool to achieve these goals is by adjusting interest rates.
When prices are rising too quickly and inflation is above the Fed’s 2% target, it raises interest rates, increasing borrowing costs throughout the economy. This results in a stronger US Dollar (USD) as it makes the US a more attractive place for international investors to park their money.
When inflation falls below 2% or the Unemployment Rate is too high, the Fed may lower interest rates to encourage borrowing, which weighs on the Greenback.
The Federal Reserve (Fed) holds eight policy meetings a year, where the Federal Open Market Committee (FOMC) assesses economic conditions and makes monetary policy decisions.
The FOMC is attended by twelve Fed officials – the seven members of the Board of Governors, the president of the Federal Reserve Bank of New York, and four of the remaining eleven regional Reserve Bank presidents, who serve one-year terms on a rotating basis.
In extreme situations, the Federal Reserve may resort to a policy named Quantitative Easing (QE). QE is the process by which the Fed substantially increases the flow of credit in a stuck financial system.
It is a non-standard policy measure used during crises or when inflation is extremely low. It was the Fed’s weapon of choice during the Great Financial Crisis in 2008. It involves the Fed printing more Dollars and using them to buy high grade bonds from financial institutions. QE usually weakens the US Dollar.
Quantitative tightening (QT) is the reverse process of QE, whereby the Federal Reserve stops buying bonds from financial institutions and does not reinvest the principal from the bonds it holds maturing, to purchase new bonds. It is usually positive for the value of the US Dollar.
TEMPO.CO, Jakarta – Matcha has become a social media trend among Gen Z and is quickly gaining a reputation as a health-boosting beverage thanks to influencers touting its antioxidant benefits.
However, matcha has recently come under scrutiny after some people reported iron deficiency due to excessive consumption. If you enjoy matcha every day, there’s no need to stop drinking it; a few simple strategies can help minimize its impact on iron levels.
Dr. Joseph Salhab, a Florida-based gastroenterologist and health content creator specializing in digestion, liver, pancreas, and nutrition, sets the record straight about matcha and its controversial impact on iron absorption.
In an Instagram video shared on December 2nd, the gastroenterologist outlined strategies for minimizing matcha’s effects on iron absorption, offered guidance on safe consumption, and highlighted ways to enhance iron absorption from food sources.
Matcha Interferes with Iron Absorption
Dr. Salhab emphasized that while matcha is rich in antioxidants and generally beneficial, it can interfere with the absorption of some types of iron, and excessive consumption can lead to iron deficiency in severe cases.
He explained, “Although green tea and matcha are good sources of polyphenols, they may affect the absorption of non-heme iron, which is the iron obtained primarily from vegetables and non-meat sources.”
Dr. Salhab outlined simple tips to help reduce the impact of matcha on iron absorption.
1. Don’t consume matcha or green tea with or immediately after eating iron-rich foods. Wait at least one to two hours to minimize interference.
2. To improve iron absorption, pair iron-rich foods—especially those from plant sources—with foods rich in vitamin C such as bell peppers, citrus fruits, or strawberries.
3. Cook plant-based iron sources whenever possible, as iron from raw foods is often absorbed less efficiently than iron from cooked foods.
4. Limit matcha consumption to one cup a day if you are at risk of iron deficiency, and avoid drinking it throughout the day and around mealtimes.
5. Get your iron levels checked regularly.
HINDUSTAN TIMES
Read: Does Drinking Matcha Really Cause Hair Loss?
Click here to get the latest news updates from Tempo on Google News
While expectations of a BoJ rate hike are strengthening yen demand, key US data will fuel speculation about multiple Fed rate cuts.
Later on Monday, US economic data will influence USD/JPY trends as the FOMC interest rate decision and projections loom. Economists expect Consumer Inflation Expectations to soften from 3.2% in October to 3.1% in November.
A drop in the NY Fed 1-Year Consumer Inflation Expectations would align with last week’s inflation data, supporting bets on a Fed rate cut. A more dovish Fed rate path would weaken demand for the US dollar, sending USD/JPY lower, aligning with my bearish short- to medium-term outlook.
For context, the US Core PCE Price Index rose 2.8% YoY in September, down from 2.9%, while Michigan Inflation Expectations fell from 4.5% in November to 4.1% in December.
The prospect of a December Fed rate cut, further easing in H1 2026, and BoJ rate hikes are key for USD/JPY trends.
According to the CME FedWatch Tool, the probability of a December cut stood at 88.4% on December 8, up from 86.2% on December 5. Meanwhile, the chances of a March rate cut slipped from 46.5% to 46.1%.
With markets already pricing in a December cut, traders should closely monitor the chances of a March cut.
While key US inflation data will influence US dollar demand, there are no FOMC member speeches to overshadow the reports. The Fed’s Blackout Period is in effect until December 11, limiting Fed-driven volatility.
Looking at the daily chart, USD/JPY remained above the 50-day and 200-day Exponential Moving Averages (EMAs), indicating a bullish bias. However, fundamentals have begun to shift from the technical trend, supporting a bearish outlook.
A drop below the 155 support level would pave the way toward the 50-day EMA. If breached, the 153 support level would be the next key support. Significantly, a break below the 50-day EMA would signal a bearish trend reversal, signaling a near-term drop toward 150.
In today’s Weekly Forex Forecast, I’m breaking down my exact trade plan for the DXY, EURUSD, GBPUSD, and XAUUSD.
Can the euro confirm last week’s bullish change of character on the 4-hour chart?
I explain that and more in today’s video.
The DXY did what I was anticipating last week as the market rotated lower from the upper band of its distribution channel. It was a clean reaction using the same combination of channels and SMC structure concepts I always look for.
The key for next week is the 4-hour structure. The only low that matters for market structure is 98.60. That is the level that produced the last confirmed bullish break of structure (BoS).
We also have the September FVG sitting there, still unmitigated. I want to see price tag that level next week.
If buyers defend 98.60, the bullish structure remains intact, but only if the DXY then closes above 99.12. If we close below 98.60, that would shift momentum and give us a confirmed bearish Change of Character (CHoCH).
The focus next week is simple. DXY bulls must hold above 98.60 to keep the bullish narrative alive. A sustained break below on the high time frames would confirm a bearish CHoCH.
EURUSD is showing early signs of strength after confirming a CHoCH on the 4-hour chart. That happened when price broke above the 1.16668 high.
The level buyers need to defend is 1.1590. That is the low that produced the last valid break of structure.
As long as EURUSD stays above that low, the pair has room to continue higher.
But EURUSD still depends heavily on the DXY. Before I turn bullish on the euro, I need to see the dollar index below 98.60. Until then, I’ll take last week’s EURUSD bullish CHoCH with a grain of salt.
Admittedly, last week was a bit frustrating because the EURUSD came within a few pips of sweeping the equal lows I wanted. Still, we got the EURUSD rally, which was my base case last weekend.
The bigger picture remains bullish as long as 1.1590 holds. A confirmed break below that low would invalidate the CHoCH.

GBPUSD hit the September FVG last week that I had my eye on. That level came from a clean three candle pattern on the monthly.
The pound came close to my ideal entry zone but didn’t quite reach it. I wanted a deeper move into the pocket that showed more confluence.
Even without that, the market reacted and pushed higher, so the short-term structure remains bullish.
The bigger question is whether this is the bottom for GBPUSD or simply a relief rally within the downtrend. Some recent highs only produced wicks and not closes.
That makes it difficult to confirm a true CHoCH on higher timeframes. The DXY holding above 98.60 adds to the uncertainty.
Several inefficiencies beneath GBPUSD still need to be filled, specifically near 1.3270. If the dollar bounces from 98.60, the pound could struggle.
For now, GBPUSD is bullish in the short term. The reaction from any pullback next week will tell us whether buyers remain in control.

Gold moved sideways last week, but the structure is unchanged. The 4-hour trend remains bullish, with a recent break of structure, confirming higher highs and lows.
I am watching a key pocket below current levels next week. It includes a weekly bullish FVG, a daily FVG, and a sell-side single print.
That entire area remains unmitigated. It would be a clean place for a pullback.
Last week I wanted to see gold trade into that pocket and print a lower timeframe bullish CHoCH. Instead, the market stalled and traded sideways.
The same setup is valid going into next week. As long as gold stays above the key lows just above $4,000, buyers remain in control.
The trend line below also supports the idea of continuation. I would never use a trend line on its own, but it does intersect with the $4,130 support area.

There’s no silver bullet, and plenty of “energy-boosting” fitness and wellness products are more hype than anything else. However, there are some science-based ways to boost your energy if you’re feeling sluggish at the gym. Can you really sip your way to more energy? Gulping gallons of coffee every week isn’t the recommended approach to powering through that workout.
Research shows green tea consumption can actually help prevent the production of reactive oxygen species and improve sports performance.
Ali Senol / Pexels
Exercising, particularly in more intense or longer sessions, can cause your body to produce free radicals, which are unstable molecules. When these free radicals build up in your body, higher numbers lead to oxidative stress — a condition involving tiredness and slower workout recovery. The powerful antioxidants in green tea, particularly catechins like EGCG, help neutralize and combat these free radicals, which can help your body better handle the stress of exercise.

Unitea / Pixabay
In research published in the International Journal of Environmental Research and Public Health, the authors revealed that green tea consumption can boost endurance and reduce fatigue. Of course, again, it’s not a magic remedy that will solve all of your gym woes, but it’s certainly worth considering if you’re looking to add a little pep in your step. Green tea improves your body’s ability to use fat as a fuel, and that could help your stamina in the gym. Researchers from different studies have also pointed out how this could be useful for weight loss.

Andres Ayrton / Pexels
This research also shows green tea boosts nitric oxide, which helps to widen your blood vessels, allowing more oxygen to get to your muscles. More oxygen could mean better performance and less tiredness.

Dogu Tuncer / Pexels
The anti-inflammatory effects of this vibrant tea could help lower muscle pain and exercise-related muscle damage.

Matcha Co / Unsplash
Combining green tea with exercise could help you feel less tired and burn more fat during your workouts, according to the research. It’s also a safer option to improve performance for most people, and it doesn’t come along with a risk of harmful side effects. Green tea can act as a natural performance enhancer if you drink it regularly, particularly before or around exercise. Research shows you can improve your endurance, lower fatigue, recover faster, and help combat oxidative stress.
Microsoft Azure has just released a Blockchain-as-a-Service product that uses Ethereum to support blockchain with a set of templates to deploy and configure your choice of blockchain network. This can be done with minimal Azure and blockchain knowledge.
The conventional blockchain in the open is based on Proof-of-Work (PoW) and requires mining as the parties do not trust each other. An enterprise blockchain does not require PoW but is based on Proof-of-Authority (PoA) where approved identities or validators on a blockchain, validate the transactions on the blockchain.
The PoA product features a decentralized application (DApp) called the Governance DApp. Blockchains in this new model can be deployed in 5-45 minutes depending on the size and complexity of the network.
The PoA network comes with security features such as identity leasing system to ensure no two nodes carry the same identity. There are also other features to achieve good performance.
Source: Microsoft Blog
Along with these features, the Governance DApp will also ensure each consortium member has control over their own keys. This enables secure signing on a wallet chosen by the user.
The blog mentions “In the case of a VM or regional outage, new nodes can quickly spin up and resume the previous nodes’ identities.”
To know more visit the official Microsoft Blog.
Read next
Automate tasks using Azure PowerShell and Azure CLI [Tutorial]
Microsoft announces general availability of Azure SQL Data Sync
Microsoft supercharges its Azure AI platform with new features

Brent crude oil’s financial benchmark is ending the first week of December on a surprisingly firm footing. The front‑month Brent Crude Oil Last Day Financial futures contract (ticker BZ=F) settled around $63.75 per barrel on Friday, 5 December, its highest close in two weeks and roughly the second straight weekly gain for the benchmark. [1]
The move comes even as forecasters warn of a looming supply surplus in 2026 and see Brent drifting back toward $55–$60 per barrel next year. Yet for now, rate‑cut expectations from the U.S. Federal Reserve and a new wave of geopolitical tension are putting a floor under prices.
This article breaks down the latest price action in Brent Crude Oil Last Day Financial futures, the macro and geopolitical drivers between 5–7 December 2025, and what major banks and agencies are projecting for oil prices in 2026 and beyond.
On the New York Mercantile Exchange (CME/NYMEX), traders can access Brent through Brent Last Day Financial Futures, ticker BZ (shown on many platforms as BZ=F).
These contracts:
Because BZ=F mirrors the global Brent benchmark without physical delivery, it has become a popular tool for refiners, airlines, producers and macro traders who want clean financial exposure to Brent without logistics risk.
Several data providers show a tight cluster of prices for Friday, 5 December:
A Saudi‑based daily market report summarised the week by listing Brent at $63.75/bbl, up 0.8% on the day and about 2.2% on the week, but still roughly 10.6% lower year‑to‑date. West Texas Intermediate (WTI) is down about 11.5% YTD at $60.08/bbl. [7]
Short‑term technical indicators for Brent futures skew positive. A popular dashboard at Investing.com shows a “Strong Buy” composite signal for Brent as of late 5 December, with the 14‑day RSI around 60 and a majority of oscillators and moving‑average signals pointing to further upside in the near term. [8]
In simple terms: futures traders see momentum improving, but not yet overheating.
The single biggest driver of this week’s bounce has been the sudden jump in expectations for a U.S. Federal Reserve rate cut at the upcoming 9–10 December FOMC meeting.
On Friday, Reuters reported that oil prices “edged up nearly 1% to a two‑week high” as traders priced in an 87% probability of a 25‑basis‑point cut, according to CME Group’s FedWatch tool. [9]
Key macro points from 5–7 December:
For BZ=F traders, the macro story is straightforward: a dovish Fed tends to weaken the dollar and support global growth expectations, both of which are historically positive for dollar‑priced commodities like Brent.
While macro data drives the broader risk appetite, geopolitics is quietly rebuilding a risk premium in Brent—and therefore in Brent Crude Oil Last Day Financial futures.
On 5 December, another Reuters piece detailed how Russian ESPO blend cargoes to China for December loading are trading at a record discount of $5–$6/bbl to ICE Brent, compared with just $0.50–$1/bbl in late October. [15]
The deeper discounts are driven by:
For Brent itself, that’s a mixed story: Russian barrels must price below Brent to clear, capping how high the benchmark can run. But the very need for such discounts underscores how sanctions and war are reframing flows around the Brent benchmark.
Looking forward, Brussels and G7 capitals are debating an even more aggressive step: replacing the current Russian oil price cap with a full ban on maritime services for Russian exports.
A 6 December Reuters exclusive says the EU and G7 are discussing a near‑total prohibition on Western shipping, insurance and other services for Russian crude, potentially in the bloc’s next sanctions package due in early 2026. [17]
Because about one‑third of Russian exports still sail on Western‑linked tankers, such a move would force Moscow to expand its “shadow fleet” of older and opaque vessels, raise shipping costs and inject further uncertainty into Atlantic‑Basin supply. [18]
Analysts also remain focused on U.S.–Venezuela tensions, with U.S. officials hinting at potential operations targeting drug traffickers that could disrupt Venezuela’s roughly 1.1 million bpd of output. [19]
Put together, these threads justify why Brent—and BZ=F—are holding above $63 even as forecasts for 2026 look notably softer.
Several fresh notes between 5–7 December offer a consistent short‑term theme: Brent likely stays range‑bound around $60–$65, but the next big move depends on the Fed and geopolitics.
A weekend forecast from TradingNEWS describes crude as “steady near $60–$64,” with WTI around $60.08 and Brent (BZ=F) near $63.75. The piece highlights a tug‑of‑war between: [20]
The conclusion: the market is “pinned” near a breakout zone but needs a clear catalyst—such as the FOMC decision or a major supply disruption—to convincingly move toward $70 or back into the mid‑$50s.
A same‑day Forex.com note titled “Crude Oil Outlook: FOMC and Geopolitical Uncertainty” similarly argues that crude markets are holding near key breakout levels, with rate‑cut sentiment offsetting worries about a 2026 supply surplus. The analysis stresses that any surprise from the Fed—or escalation in Ukraine or Venezuela—could quickly jolt prices out of their current range. [22]
The more sobering news for Brent bulls is that most medium‑term forecasts released this week see lower prices in 2026, even if near‑term volatility pushes futures higher.
On 7 December, Rabobank reiterated its view that Brent will average about $62/bbl in Q4 2025, before sliding to $60/bbl in Q1 2026 and then oscillating in a $58–$60 range for the rest of the year. [23]
The bank:
The U.S. Energy Information Administration is slightly more bearish. In its latest Short‑Term Energy Outlook, the agency projects that: [25]
as global oil inventories continue to build. The EIA did nudge its 2026 forecast up by $3/bbl compared with last month, citing stronger than expected stock draws in China and the impact of sanctions on Russia, but the direction still points lower from current BZ=F levels.
Fitch Ratings this week cut its 2025–2027 oil price assumptions, explicitly referencing market oversupply and production growth that is expected to outstrip demand. [26]
Similarly, several bank research desks have recently trimmed their 2026 forecasts, often projecting Brent in the high‑50s to low‑60s as new barrels from the U.S., Brazil and Guyana come online.
Beyond the 2026 horizon, a widely discussed Morningstar report released on 5 December offers a nuanced take on oil’s future. [27]
Key points:
For long‑dated BZ contracts and related options, this outlook helps explain why far‑out Brent strips still trade well above the mid‑$50s, even as near‑term contracts grapple with potential oversupply.
With Brent Crude Oil Last Day Financial futures (BZ=F) hovering near $63–$64/bbl, traders and hedgers face a classic late‑cycle dilemma: strong short‑term support, weaker medium‑term fundamentals.
Three themes stand out for the weeks ahead:
In this context, it isn’t surprising to see technical indicators flashing “buy” even as fundamental analysts warn of 2026 softness.
Market participants in Brent Crude Oil Last Day Financial futures will be watching:
Between 5–7 December 2025, Brent Crude Oil Last Day Financial futures (BZ=F) have:
At the same time, Rabobank, the EIA and others still project Brent drifting back toward the mid‑50s to around $60/bbl in 2026, highlighting a likely tug‑of‑war between oversupply and geopolitics in the year ahead. [35]
For traders and hedgers using the BZ contract, the message is clear: the coming Fed meeting and evolving sanctions landscape could decide whether this winter’s rally has room to run—or whether current levels are an attractive chance to lock in prices before fundamentals reassert themselves.
1. www.reuters.com, 2. en.wikipedia.org, 3. en.wikipedia.org, 4. www.reuters.com, 5. finance.yahoo.com, 6. www.nampa.org, 7. www.alrajhi-capital.com, 8. www.investing.com, 9. www.reuters.com, 10. www.reuters.com, 11. kuwaittimes.com, 12. kuwaittimes.com, 13. www.reuters.com, 14. www.reuters.com, 15. www.reuters.com, 16. www.reuters.com, 17. www.reuters.com, 18. www.reuters.com, 19. www.reuters.com, 20. www.tradingnews.com, 21. www.tradingnews.com, 22. www.forex.com, 23. www.exchangerates.org.uk, 24. www.exchangerates.org.uk, 25. www.eia.gov, 26. www.reuters.com, 27. www.mrt.com, 28. www.mrt.com, 29. www.reuters.com, 30. www.reuters.com, 31. www.reuters.com, 32. www.reuters.com, 33. www.reuters.com, 34. www.reuters.com, 35. www.exchangerates.org.uk