The main category of All News Articles.
You can use the search box below to find what you need.
[wd_asp id=1]
The main category of All News Articles.
You can use the search box below to find what you need.
[wd_asp id=1]
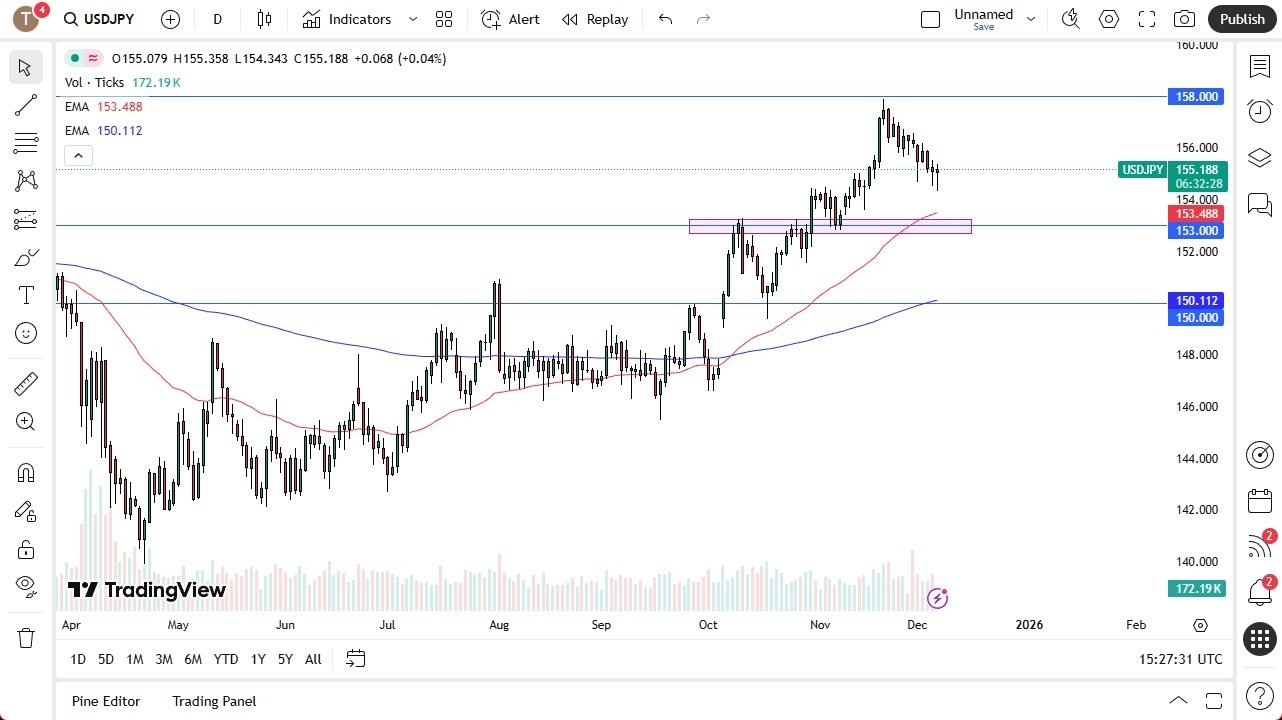
The US dollar fell a bit against the Japanese yen in early trading on a Friday, but we have now reacted to the core PC numbers that came out as anticipated in the United States. And that, of course, makes the US dollar firm up a little bit because I think some people were expecting bad news.

At this point, we have to pay close attention to Japanese yields in the bond markets and the JGB market due to the fact that rising interest rates could signal a problem. It can be the death of the carry trade, but I don’t think that gets out of control. At this point, we’re in the process of forming another hammer as we had on Thursday. So I think a bounce here does make a certain amount of sense from a technical analysis standpoint, and it could send this market back to the 158 level.
The 50-day EMA sits in the 153.50 region, and the 153 yen level underneath is a significant support level, all things being equal. This is a market that I think will continue to find buying opportunities based on value, and the Wednesday session of next week also features the interest rate decision; people will be watching that very closely. But I think more importantly, what they will pay attention to is the press conference and statement.
If the Federal Reserve looks like it’s going to be very hesitant to cut rapidly, then that should send the US dollar higher. So, the next couple of days might be about hanging around in this area, just simply killing time waiting for that information. But right now, we’re still in an uptrend. That hasn’t changed. It looks like we are trying to push to the upside. So, I like it.
Want to trade our USD/JPY forex analysis and predictions? Here’s a list of forex brokers in Japan to check out.
Christopher Lewis has been trading Forex and has over 20 years experience in financial markets. Chris has been a regular contributor to Daily Forex since the early days of the site. He writes about Forex for several online publications, including FX Empire, Investing.com, and his own site, aptly named The Trader Guy. Chris favours technical analysis methods to identify his trades and likes to trade equity indices and commodities as well as Forex. He favours a longer-term trading style, and his trades often last for days or weeks.
Tea is one of the healthiest drinks you can add to your cup. It’s known for being rich in antioxidants and often consumed for other benefits, like soothing a tummy or helping you sleep. When you have ulcerative colitis (UC), a chronic inflammatory condition that affects the lining of the colon, what you eat and drink is important to manage your condition. Tea may be able to help you feel better and manage symptoms.
Edwina Clark, M.S., RD, CSSD, notes that while tea may be beneficial, “few studies, if any, have evaluated the benefits of different teas on ulcerative colitis symptoms in humans.” There is some preliminary research and helpful tips from dietitians to help you pick the best teas to drink when you have ulcerative colitis.
Peppermint tea is an herbal tea that’s naturally caffeine-free. The mint leaves it’s made from may have beneficial effects for inflammation, GI disorders and cognitive health. Cheryl Harris, M.P.H., RD, is a big fan of peppermint tea, “because it tends to help with digestive pain, gas, and bloating.”
Plus, it’s soothing. Peppermint tea contains the phenolic compounds of the leaves of the plant, including luteolin, hesperidin and eriocitrin. In animals, peppermint tea has helped relax the GI tract, and peppermint has antimicrobial and antiviral activity. Clark likes peppermint tea because it “can help ease nausea or bloating during a flare, or if you’ve accidentally eaten a trigger food.” Harris adds, “It’s also a good alternative to caffeine, which is ideally skipped in a flare.”
Known for its antioxidants and polyphenols, green tea may be a great addition to your lineup if you have UC. Beth Rosen, M.S., RD, CDN, says, “Although there are only a few small human studies looking at green tea and irritable bowel disease, green tea is well tolerated and may be helpful in reducing inflammation.” Green tea is rich in flavonoids and catechins, such as phenolic acid, theobromine and theanine, which have anti-inflammatory properties. Since UC is an inflammatory disease, researchers think the compounds in green tea may help reduce inflammation and ease symptoms. Rosen prefers decaffeinated green tea because caffeine is a stimulant and may lead to GI symptoms in some people with UC.
You’ve probably heard that ginger is a natural stomach soother, and ginger tea contains the plant’s anti-inflammatory compounds that deliver on that. Ginger contains many bioactive compounds, including gingerols and shogaols, which help quell inflammation. Ginger may restore diverse gut bacteria, which is important for people with UC who may have dysbiosis or altered gut bacteria from their IBD. Clark notes that ginger tea is a natural antiemetic and can help with bloating and nausea.
Kombucha is a fizzy fermented tea drink that is a natural source of probiotics, or good bacteria. Clark points out, “fermented foods promote intestinal integrity and short-chain fatty acid production, both of which are important for GI health.” Research has tied fermented foods and probiotics to positive outcomes for people with IBD, since they help improve gut health. While probiotic-rich kombucha can be a good choice, Harris cautions against drinking too much. “The fizzy often can be bloating and just because some probiotics are good doesn’t mean that more are better.”
Tea is one of the most consumed beverages in the world, and along with being warming and delicious, there are health benefits to your mug, too. When you have ulcerative colitis, choosing teas like peppermint, green, ginger and kombucha, which are known to be anti-inflammatory and good for your gut, may help you feel better. A healthy diet for UC will vary from person to person, so always check with your healthcare team before making major dietary changes.
Speaking at Binance Blockchain Week during a panel on the future of crypto, Garlinghouse made a bold prediction that Bitcoin could reach $180,000 by the end of 2026, saying, “I’ll say Bitcoin $180,000 on December 31st or 2026,” as quoted by The Street.
While he didn’t break down the specifics behind his forecast, Garlinghouse pointed to ongoing regulatory progress, growing crypto adoption, and major institutions like Vanguard and Franklin Templeton moving into the US ETF space as potential drivers for the market’s next major push, as per the report.
ALSO READ: Bitcoin price today is up over $92,000 – what’s driving BTC USD to surge?
He also highlighted the push for regulatory clarity in the US, referencing the bipartisan CLARITY Act, which aims to create a defined framework for digital assets. Garlinghouse doesn’t expect it to pass this year but believes that “sometime in the first half of next year, we’ll see passage of legislation that will continue to unlock and create more tailwinds for the entire industry,” as quoted by The Street.
What the CLARITY Act aims to do:
Supporters say clearer rules would give investors and builders confidence and keep crypto innovation and jobs in the US instead of abroad.
What is the CLARITY Act?
A bipartisan bill aimed at defining rules and classifications for digital assets.
When does Garlinghouse think Bitcoin could hit $180,000?
By December 31, 2026.
Silver has pushed higher over the past week, supported by a combination of falling U.S. yields, a softer dollar and rising conviction that the Federal Reserve is moving closer to a rate cut next week. That shift has revived interest across the precious-metals complex, but silver has outperformed thanks to its higher beta to easing financial conditions. At the same time, positioning has turned more constructive as investors add exposure to metals with strong momentum ahead of key risk events.
The rally is also getting a lift from firm industrial demand indicators, with solar and electronics orders remaining resilient and exchange inventories still relatively tight. This has created a short-term squeeze dynamic: with physical supply not keeping pace, even modest speculative inflows have had an outsized impact on prices. The key watchpoints for the coming days will be U.S. inflation data, central-bank communication and any shifts in yields, all of which could either extend silver’s breakout or trigger a quick bout of profit-taking after a strong run.
Silver (XAG/USD) daily chart
Past performance is not a reliable indicator of future results.
On the chart, last week’s rally caused XAG/USD to re-enter into overbought territory in the RSI, which is likely attracting some interest from sellers. The bias remains constructive with the path of least resistance pointing higher. However, the continuation of the rally is likely to come with bouts of selling as some participants ease out of the positions, so a further reversal below $55 cannot be discarded. The setup is also looking very speculative with exponential gains over the past few days so a deeper reversal could eventually be triggered.
The main risk event before the meeting is Friday’s delayed September PCE report, which could easily upset the market if inflation prints firmer than expected. A surprise on the upside – especially a core print with a 3-handle – would likely force a quick unwind of rate-cut bets and trigger a USD rebound, weighing on sentiment and likely pushing silver lower. Conversely, a soft PCE number followed by cautious Fed communication next week could reinforce downward pressure on the dollar, allowing risk appetite to get another boost. Because of this, the setup heading into the FOMC is one where silver’s next move is highly data-dependent, with volatility the most likely outcome
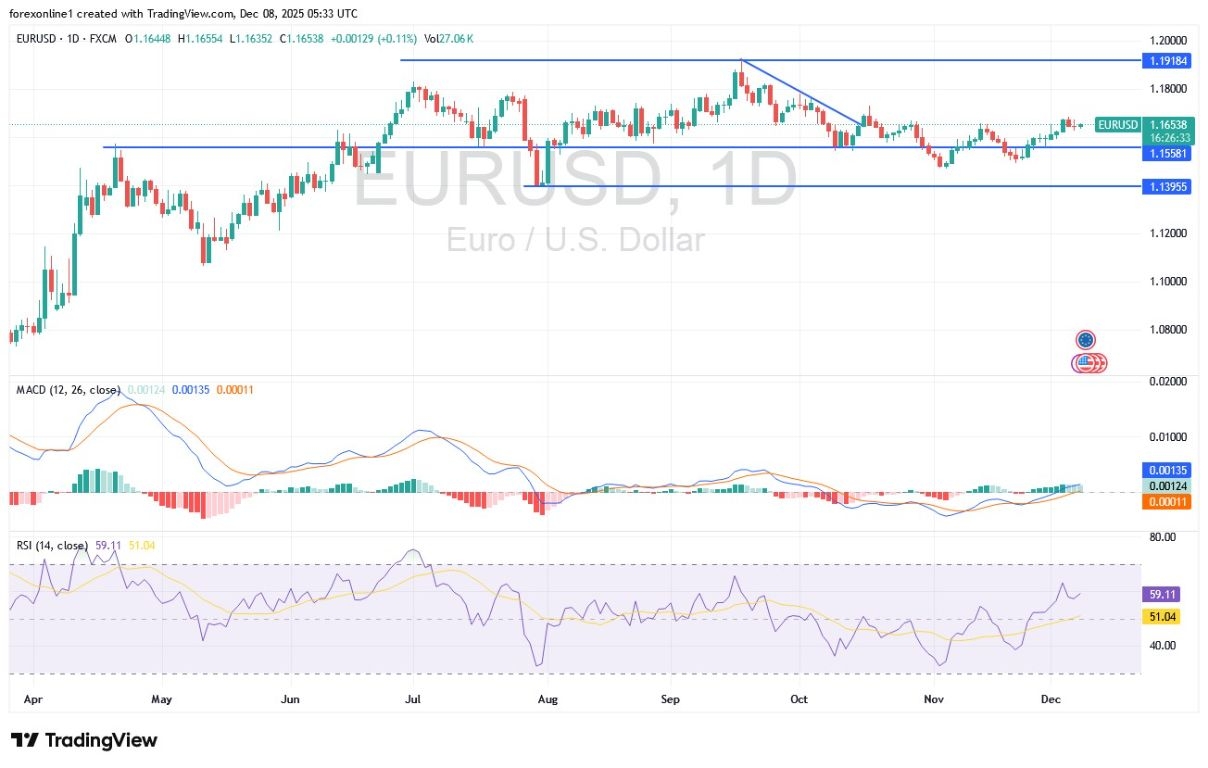
We expect the EUR/USD pair to move within a narrow range at the start of this important trading week, within its recent price range. According to reputable trading platforms, the EUR/USD closed around 1.1640 last week after gains that extended to the 1.1681 resistance level, the pair’s highest point since mid-October.
Last week, the EUR/USD’s gains were fueled by investor optimism following positive European economic data. Germany saw improvements, with factory orders rising 1.5% in October, according to the German Federal Statistical Office (Destatis), five times the market forecast of 0.3%. The September reading was also revised upwards from 1.1% to 2.0%. French industrial production also contributed to this improvement, exceeding expectations with a 0.2% increase compared to the anticipated 0.1% decline. Spanish production rose by 0.7%, exceeding expectations of 0.5%.
Further Confirming the strength of the underlying economic conditions, the Eurozone also released its GDP data, which showed the economy grew by 0.3% quarter-on-quarter in the third quarter, surpassing expectations of 0.2%.
Employment also grew at a comfortable rate of 0.2%, exceeding expectations of 0.1%. Overall, all of this points to a strong economic pulse that will encourage the European Central Bank to hold interest rates steady for an extended period. In a world where interest rates are so crucial, this presents the euro with a good opportunity to make further gains against the dollar, which is expected to be subject to a series of US interest rate cuts by the Federal Reserve this week.
According to the daily Forex chart, technical indicators continue to support the upward trend of the EUR/USD pair. The 14-day Relative Strength Index (RSI) is around 61 and has more time to achieve stronger gains before reaching overbought territory. This could happen if the bulls manage to push back towards the psychological resistance level of 1.1800. Meanwhile, the MACD indicator continues its steady upward trend.
The scenario for a bearish in the EUR/USD on the daily chart depends on the bears pushing prices back toward the psychological support of 1.1500 once again. The Euro/Dollar is not anticipating major data releases today apart from the announcement of the German Industrial Production reading at 09:00 AM Egypt time, followed by the Sentix Consumer Confidence reading for the Eurozone at 11:30 AM Egypt time.
Accordingly, limited trading for the Euro/Dollar can be expected today, pending the market’s reaction to the most important event: the US Federal Reserve’s policy announcement next Wednesday.
Please note that trading currencies within narrow ranges is not a sound investment decision. It is best to wait for the currencies’ reaction to this week’s key releases to determine the most suitable trading opportunities, avoiding unnecessary risk regardless of how strong the trading opportunities may seem.
Ready to trade our EUR/USD daily forecast? Here’s a list of some of the top forex brokers in Europe to check out.
Global Nutritional Supplements Market reached USD 365.5 billion in 2022 and is expected to reach USD 595.4 billion by 2031 growing with a CAGR of 6.2% during the forecast period 2024-2031
Get a Free Sample PDF Of This Report (Get Higher Priority for Corporate Email ID):- https://datamintelligence.com/download-sample/nutritional-supplements-market?kb
United States: Recent Industry Developments
✅ November 2025: Pfizer launched a new line of plant-based protein supplements targeting fitness enthusiasts and aging populations.
✅ October 2025: Herbalife Nutrition expanded its digital health platform integrating personalized supplement recommendations.
✅ September 2025: The FDA updated labeling regulations to enhance transparency and consumer safety for dietary supplements.
Japan: Recent Industry Developments
✅ November 2025: Otsuka Pharmaceutical introduced advanced collagen supplements aimed at skin health and anti-aging.
✅ October 2025: Suntory Wellness launched a functional supplement range supporting immune health with traditional Japanese botanicals.
✅ September 2025: Growing demand for synbiotic supplements drove innovation in combined prebiotic-probiotic formulations.
GCC: Recent Industry Developments
✅ November 2025: Gulf-based companies increased production of halal-certified nutritional supplements to meet regional demand.
✅ October 2025: UAE government initiatives promoted local manufacturing of nutritional supplements with a focus on sports nutrition.
✅ September 2025: Saudi Arabia partnered with global nutraceutical firms to introduce advanced supplements targeting diabetes management.
List of Top Key Player:
Abbott Nutrition, Amway, Nestle, Glanbia Plc, Herbalife International of America, Archer Daniels Midland, PepsiCo, Nature’s Bounty Co., DuPont, and American Health, Inc.
Forecast Projection:
The Global Nutritional Supplements Market is poised for significant growth between 2025 and 2032. In 2024, the market maintained a steady upward trajectory, and with strategic initiatives by leading players accelerating adoption, the market is expected to soar throughout the forecast period. Companies leveraging these trends are well-positioned to capture emerging opportunities and maximize revenue potential.
Market Intelligence Research Process:
The Global Nutritional Supplements Market research report by DataM Intelligence combines primary and secondary data to deliver deep, actionable insights. It examines the full spectrum of factors shaping the industry, from government regulations and market conditions to competitive dynamics, historical trends, technological breakthroughs, upcoming innovations, and potential challenges. This comprehensive analysis not only highlights growth prospects but also identifies barriers, equipping businesses to navigate market volatility and capitalize on emerging opportunities.
Buy Now & Unlock 360° Market Intelligence: https://www.datamintelligence.com/buy-now-page?report=nutritional-supplements-market?kb
Key Segments:
By Product Type: (Dietary Supplements, Sports Supplements, Beauty Supplements, Others)
By Form: (Capsule, Powder, Tablet, Liquid, Others)
By Age Group: (Kids, Adults, Geriatric)
By Distribution Channel: (Supermarkets/Hypermarkets, Pharmacy and Drug Stores, Specialty Stores, Online Stores, Others)
Global Growth Regional Analysis:
⇥ North America (U.S., Canada, Mexico)
⇥ Europe (U.K., Italy, Germany, Russia, France, Spain, The Netherlands and Rest of Europe)
⇥ Asia-Pacific (India, Japan, China, South Korea, Australia, Indonesia Rest of Asia Pacific)
⇥ South America (Colombia, Brazil, Argentina, Rest of South America)
⇥ Middle East & Africa (Saudi Arabia, U.A.E., South Africa, Rest of Middle East & Africa)
Benefits of the Report:
Chapter 1 – Market Overview: Kickstarts the report with a comprehensive snapshot of the Global Nutritional Supplements Market, summarizing key segments by region, product type, and application. Highlights include market size, segment growth potential, and short- & long-term industry outlook.
Chapter 2 – Emerging Trends: Uncovers the game-changing trends and high-impact innovations shaping the future of the industry.
Chapter 3 – Competitive Landscape: Offers a deep dive into market competition, detailing revenue shares, strategic initiatives, and recent mergers & acquisitions.
Chapter 4 – Top Player Profiles: Features detailed company profiles, covering revenue, profit margins, product lines, and major milestones for leading market players.
Chapters 5 & 6 – Regional & Country Analysis: Breaks down revenue performance across global regions, providing insights on market sizes, opportunities, and growth prospects worldwide.
Chapter 7 – Segmentation Analysis: Explores market segmentation by type, revealing high-potential categories and guiding businesses towards lucrative areas.
Chapter 8 – Application Insights: Examines downstream markets and identifies promising sectors for expansion, showing how different applications are driving growth.
Chapter 9 – Supply Chain Mapping: Maps the entire industry supply chain, highlighting upstream and downstream activities for a holistic market perspective.
Chapter 10 – Key Takeaways: Concludes with critical insights and actionable strategies, equipping stakeholders to make informed decisions and stay ahead in the market.
Get Customization in the report as per your requirements: https://www.datamintelligence.com/customize/nutritional-supplements-market?kb
FAQ’s
Q1: What is the current size of the Global Nutritional Supplements Market and its future potential?
A: The Global Nutritional Supplements Market was valued at USD$ 365.5 billion in 2022 and is projected to surge to USD$ 595.4 billion by 2031
Q2: How fast is the Global Nutritional Supplements Market expected to grow in the coming years?
A: The market is forecast to expand at a robust CAGR of 6.2% between 2025 and 2032
Q3: Which regions are dominating the Global Nutritional Supplements Market and which are fastest-growing?
A: Key markets include North America, Europe, and Asia-Pacific, led by the U.S., Japan, China, and Germany.
Request 2 Days Free Trials with DataM Subscription Services: https://www.datamintelligence.com/reports-subscription?kb
Power your decisions with real-time competitor tracking, strategic forecasts, and global investment insights all in one place.
Have a look at our Subscription Dashboard: https://www.youtube.com/watch?v=x5oEiqEqTWg
Contact Us –
Company Name: DataM Intelligence
Contact Person: Sai Kiran
Email: Sai.k@datamintelligence.com
Phone: +1 877 441 4866
Website: https://www.datamintelligence.com
About Us –
DataM Intelligence is a Market Research and Consulting firm that provides end-to-end business solutions to organizations from Research to Consulting. We, at DataM Intelligence, leverage our top trademark trends, insights and developments to emancipate swift and astute solutions to clients like you. We encompass a multitude of syndicate reports and customized reports with a robust methodology.
Our research database features countless statistics and in-depth analyses across a wide range of 6300+ reports in 40+ domains creating business solutions for more than 200+ companies across 50+ countries; catering to the key business research needs that influence the growth trajectory of our vast clientele.
This release was published on openPR.
Cardano is entering a decisive phase as traders monitor key technical levels and shifting derivatives activity while the community anticipates possible updates from founder Charles Hoskinson. ADA trades near $0.43 after months of downward pressure, yet several indicators suggest the market is preparing for a potential shift.
The price remains below major moving averages, but futures interest and on-chain activity continue to signal strong trader engagement. Besides this, market watchers expect fresh direction as sentiment recovers from recent uncertainty.
Read The Full Article Cardano Price Prediction: Traders Eye Critical Levels as Market Awaits Hoskinson’s “Good Day” Signal On Coin Edition.
On Monday, December 8, 2025, oil prices are holding close to two‑week highs, with Brent crude trading just under $64 per barrel and U.S. West Texas Intermediate (WTI) hovering around $60 per barrel in early trade. [1]
The market is being pulled in two directions:
Below is a detailed look at where prices stand today, what’s driving the market on December 8, 2025, and how forecasts for 2026 and beyond are shaping trader sentiment.
As of Monday:
Both benchmarks are consolidating gains after notching their strongest closes in about two weeks at the end of last week. [6]
Even with today’s bounce, prices remain well below the $80+ levels seen in 2024, aligning with U.S. Energy Information Administration (EIA) estimates that Brent averaged around $81 per barrel last year. [7]
Oil is trading like a macro asset again, and today’s pricing is heavily influenced by expectations that the Federal Reserve will cut interest rates by 25 basis points at its December meeting.
Analysts quoted by Reuters say the market is in “wait‑and‑see” mode ahead of the Fed decision: strong confirmation of a rate‑cutting cycle could keep crude supported, while a more hawkish tone could quickly knock prices lower. [10]
Geopolitical risk remains a key ingredient in today’s price:
At the same time, Russia is assuring key buyers that supply will keep flowing. President Vladimir Putin recently pledged “uninterrupted” fuel shipments to India, underlining how Moscow is leaning on Asian markets to absorb barrels barred from Western buyers. [14]
The net effect: geopolitics is supportive for prices today, even as longer‑term forecasts point to oversupply.
Fresh data from Asia, released today, is another reason oil is firming.
Reuters data show that India’s fuel demand in November climbed to 21.27 million metric tons, a six‑month peak: [15]
These numbers tell traders that demand in one of the world’s fastest‑growing economies is still robust, helping offset weak spots elsewhere.
China’s customs data, also reported today, show crude oil imports of 50.89 million metric tons in November, equivalent to 12.38 million barrels per day – the highest daily level since August 2023. [18]
Interestingly, refinery utilization rates actually eased and refined product output fell by about 5.7% month‑on‑month, meaning Chinese refiners are stocking up on cheap feedstock ahead of 2026 import quotas rather than responding to a sudden consumption boom. [21]
For the oil market, this data suggests that Asian buyers are still absorbing large crude volumes, but part of today’s demand is opportunistic stocking – something that could soften later if prices or quotas move.
Behind today’s relatively firm prices is an increasingly bearish supply–demand balance for 2026.
In the longer term, the OPEC World Oil Outlook 2025 projects that global oil demand does not peak this decade, instead rising toward about 123 million barrels per day by 2050 in its central scenario. [25]
The International Energy Agency (IEA) is considerably more bearish for the mid‑2020s:
In short: the IEA sees the market “increasingly lopsided”, with supply forging ahead while demand growth looks modest by historical standards. [29]
The U.S. EIA’s latest Short‑Term Energy Outlook adds a clear price tag to this oversupply story:
Put together, the big three – OPEC, IEA and EIA – all now see some level of surplus in 2026. The disagreement is over how big that glut will be.
Wall Street and bank research desks are broadly aligned with the agencies:
Today’s Reuters piece also highlights analysis from the Commonwealth Bank of Australia: the bank sees oversupply fears eventually materializing, especially as Russian crude and refined products increasingly work around sanctions. Its base case is for futures to “gradually track towards $60 per barrel through 2026.” [35]
Given that Brent and WTI are trading very close to that $60 handle today, the market is behaving as if current prices are roughly in line with the medium‑term equilibrium, with limited conviction about a sustained move much higher or lower in the near term.
From today’s vantage point (December 8, 2025), traders are focused on a handful of catalysts that could quickly shift prices away from the current ~$60–64 band:
The combination of $60–64 crude and a 2026 outlook in the mid‑$50s suggests that:
As always, none of this should be considered personalized investment advice. Oil remains a highly volatile asset class, and sudden geopolitical or macro shocks can overwhelm even the best‑informed forecasts.
Q: What is the oil price today, December 8, 2025?
A: Brent crude is trading just under $64 per barrel, while WTI is around $60 per barrel, near two‑week highs. [46]
Q: Why are oil prices up today?
A: Prices are supported by expectations of a Fed rate cut, which could boost global growth, and by strong demand signals from India and China, alongside ongoing geopolitical risks around Russian supply and potential new sanctions. [47]
Q: Will oil prices rise or fall in 2026?
A: Most major forecasters – including the IEA, EIA, OPEC and large banks – see a market surplus in 2026 and expect Brent to average around the mid‑$50s, below today’s levels, though opinions differ on the scale of the glut. [48]
Q: What are the biggest risks to the current outlook?
A: The main wildcards are the Federal Reserve’s policy path, Russia‑Ukraine developments, the severity of sanctions on Russian and Venezuelan oil, and the strength of Asian demand. A large supply disruption or unexpectedly strong growth could push prices higher than forecast; a deeper glut could push them lower. [49]
1. www.reuters.com, 2. www.reuters.com, 3. www.reuters.com, 4. www.reuters.com, 5. www.reuters.com, 6. www.reuters.com, 7. www.foxbusiness.com, 8. www.reuters.com, 9. accesswdun.com, 10. www.reuters.com, 11. www.reuters.com, 12. www.reuters.com, 13. www.reuters.com, 14. www.bloomberg.com, 15. www.reuters.com, 16. www.reuters.com, 17. www.reuters.com, 18. www.reuters.com, 19. www.reuters.com, 20. www.reuters.com, 21. www.reuters.com, 22. www.reuters.com, 23. www.reuters.com, 24. www.reuters.com, 25. www.energyconnects.com, 26. www.reuters.com, 27. www.reuters.com, 28. www.reuters.com, 29. www.reuters.com, 30. www.eia.gov, 31. www.eia.gov, 32. www.jpmorgan.com, 33. www.reuters.com, 34. finance.yahoo.com, 35. www.reuters.com, 36. www.reuters.com, 37. www.reuters.com, 38. www.reuters.com, 39. www.reuters.com, 40. www.reuters.com, 41. www.eia.gov, 42. www.foxbusiness.com, 43. www.reuters.com, 44. www.ief.org, 45. www.reuters.com, 46. www.reuters.com, 47. www.reuters.com, 48. www.reuters.com, 49. www.reuters.com
The Pound has opened the week on a mild positive note, while the Japanese Yen drops across the board amid the positive market mood. The pair is trending higher, after bouncing at 206.20 lows on Friday, with bulls eyeing 17-month highs, at 207.35.
The fundamental context remains pound-supportive. Investors are moderately lenient to risk, and, in the UK, the tax-rising budget released by Chancellor Rachel Reeves last week has soothed concerns about the UK’s fiscal deficit, increasing speculative demand for the Pound.
The pair remains bid in a doleful week opening, with bulls aiming to retest the top of an ascending triangle pattern at the 207.35 area, which has capped upside attempts several times in late November and early December.
The 4-hour chart shows the pair trading at 207.10 at the time of writing, showing marginal gains on a daily basis. The Moving Average Convergence Divergence (MACD) remains flat around the zero line, reinforcing a neutral tone, while the Relative Strength Index (RSI), at 58.64, is positive without an overbought stretch.
A successful breach of the mentioned 207.35 area clears the path towards the 2024 peak, which coincides with the 127.2% Fibonacci extension of the November 20-26 rally at the 208.15 area. Further up, the 161.8% extension of the same cycle is at 209.15. The triangle’s measured target is at 210.30.
To the downside, the rising trend line from the November 21 low underpins the bias, offering support near 206.00, with horizontal backup at 205.18 (December 1 low) and the mentioned November 21 low, at the 204.30 area.
(The technical analysis of this story was written with the help of an AI tool).
The table below shows the percentage change of British Pound (GBP) against listed major currencies today. British Pound was the strongest against the Japanese Yen.
| USD | EUR | GBP | JPY | CAD | AUD | NZD | CHF | |
|---|---|---|---|---|---|---|---|---|
| USD | -0.06% | 0.09% | 0.09% | -0.05% | 0.03% | -0.21% | 0.00% | |
| EUR | 0.06% | 0.15% | 0.14% | 0.00% | 0.09% | -0.15% | 0.07% | |
| GBP | -0.09% | -0.15% | 0.00% | -0.14% | -0.06% | -0.30% | -0.10% | |
| JPY | -0.09% | -0.14% | 0.00% | -0.12% | -0.05% | -0.29% | -0.09% | |
| CAD | 0.05% | -0.01% | 0.14% | 0.12% | 0.08% | -0.17% | 0.04% | |
| AUD | -0.03% | -0.09% | 0.06% | 0.05% | -0.08% | -0.24% | -0.04% | |
| NZD | 0.21% | 0.15% | 0.30% | 0.29% | 0.17% | 0.24% | 0.20% | |
| CHF | -0.00% | -0.07% | 0.10% | 0.09% | -0.04% | 0.04% | -0.20% |
The heat map shows percentage changes of major currencies against each other. The base currency is picked from the left column, while the quote currency is picked from the top row. For example, if you pick the British Pound from the left column and move along the horizontal line to the US Dollar, the percentage change displayed in the box will represent GBP (base)/USD (quote).
The global green tea polyphenols demand is valued at USD 0.5 billion in 2025 and is forecasted to reach USD 1.1 billion by 2035, with a CAGR of 8.7%. Growth reflects consistent utilization of catechin-rich extracts in skin-care formulations designed for antioxidant, anti-ageing, and inflammation-control benefits. Commercial adoption aligns with a broader shift toward natural actives supported by safety validation and established consumer familiarity with tea-derived ingredients.
Skin care is the leading application category. Green tea polyphenols are incorporated into serums, masks, lotions, and sunscreens to support environmental defence, photoprotection, and collagen stability. Manufacturers integrate encapsulation technologies to improve bioavailability and maintain formulation transparency without compromising functional concentration.
Asia Pacific, Europe, and North America record the highest consumption due to strong personal-care manufacturing footprints and increasing alignment with clean-label preferences. Demand concentrates within premium and dermocosmetic product lines that emphasize efficacy supported by published research. Major suppliers include BASF SE, Croda International, Evonik Industries, Symrise, and Dow. Their focus involves process optimization for high-purity catechin extraction, clinical performance substantiation, and compatibility with multi-functional cosmetic ingredient systems.
A saturation point assessment for the global green tea polyphenols industry indicates that growth is steady but increasingly influenced by maturity in core supplement categories. Dietary supplements represent the most established segment, where high consumer awareness of antioxidant and anti-inflammatory benefits has already converted a large portion of health-focused users. This reduces headroom for rapid volume expansion and signals an approach toward partial saturation in developed regions.
Food and beverage applications provide incremental growth but also show limits, since product development depends on masking bitterness and maintaining ingredient stability, which slows broader adoption. Personal care remains less saturated, although usage is widespread in anti-aging and skin protection formulas. This segment still offers medium-term headroom because demand for natural actives continues to rise. Pharmaceutical and functional medical nutrition are the least saturated areas, reflecting ongoing research into metabolic, cardiovascular, and cognitive benefits. Stronger clinical evidence could delay saturation and unlock new therapeutic positioning. Regional saturation varies, with Asia Pacific being the most mature due to long-standing consumption patterns. North America and Europe offer more extension potential through clean label innovation and targeted health claims.
| Metric | Value |
|---|---|
| Market Value (2025) | USD 0.5 billion |
| Market Forecast Value (2035) | USD 1.1 billion |
| Forecast CAGR (2025-2035) | 8.7% |
Demand for green tea polyphenols is increasing worldwide because nutraceutical and beverage companies focus on ingredients that support metabolic health, antioxidant protection and cognitive wellness. Polyphenols such as catechins are widely used in dietary supplements targeting weight management, heart health and immune function, which align with growing interest in preventive health habits. Functional drink manufacturers include concentrated extracts in ready to drink teas, wellness shots and powdered blends to provide measurable health benefits in convenient formats.
Cosmetic producers adopt green tea polyphenols in anti-aging and anti-inflammation skincare products due to their potential role in reducing oxidative stress and supporting skin barrier resilience. Research continues to examine polyphenols in sports recovery and brain-health applications, encouraging broader product development in active lifestyle categories. Global expansion in clean label and plant derived ingredients strengthens adoption, supported by established supply from major tea growing regions.
Standardized extraction improves potency consistency for regulated markets in North America, Europe and Asia Pacific. Constraints include cost variations linked to tea leaf supply and the need for stability management in finished products that are sensitive to heat or light. Scientific validation remains important for health claims in highly regulated sectors.
Global demand for green tea polyphenols is driven by their antioxidant strength, anti-inflammatory support, and UV-protective capabilities. Beauty and personal-care brands integrate these actives to address aging, pigmentation, sensitivity, and environmental stress. Formulations highlight catechin-rich extracts for pollution defense and soothing benefits. Premium dermocosmetic and men’s grooming launches further support adoption, along with hybrid wellness products positioned for sensitive-skin compatibility. Innovation focuses on stability enhancement, bioavailability improvements, and clean-label compliance across global cosmetic regulations.

Skin care represents 10.1% of global consumption. Anti-aging, redness reduction, and improved skin texture remain primary claims, leading to deployment in serums, moisturizers, and essence-based systems. Body-care categories leverage antioxidants for firming and anti-pollution positioning. Hair-care formulations use catechins for scalp soothing and follicle protection from oxidative damage. Sun-care applications connect UV exposure defense with melanin-moderation benefits, while color cosmetics explore functional pigment stabilization. Men’s grooming benefits from sebum-balancing and after-shave soothing efficacy, and baby & kids care relies on gentler botanical protection. Dermocosmetic usage expands as brands prioritize clinical efficacy with minimal irritation.
Key Points:

Powder format accounts for 15.5%, driven by enhanced stability, high active concentration, and seamless integration into solid and water-based formats. Powders support wide regulatory acceptance and long shelf durability across regions. Liquid solutions enable better bioavailability in high-absorption serums and ampoules, while concentrated liquid extracts target functional dosing in premium categories. Dispersions, gels, and emulsions enhance sensorial performance and allow controlled release in soothing masks. Oil-based and paste variants focus on occlusion and scalp-repair benefits. Product-form decisions align with targeted delivery, formulation stability, and compatibility with natural preservatives.
Key Points:
Rising consumer demand for antioxidants, growing interest in wellness and expanded use across food, beverages and nutraceuticals drive demand.
Worldwide, green tea polyphenols, especially catechins such as EGCG are valued for antioxidant effects, supporting market growth in dietary supplements, functional beverages, and fortified foods. Increasing awareness of oxidative stress, cardiovascular health, and healthy aging encourages consumers in North America, Europe, and Asia to adopt polyphenol-based products. Beverage manufacturers integrate green tea polyphenols into ready-to-drink teas, juices, and energy drinks. Nutraceutical and dietary supplement producers market capsules, tablets, and powders targeting immunity, metabolism, and skin health. Growth in health-conscious lifestyles and rising middle-class purchasing power across emerging economies expand the target consumer base globally.
Variability in raw material quality, regulatory constraints on health claims, and possible negative perception of caffeine restrain growth.
Green tea polyphenol concentration varies depending on tea cultivation region, harvest timing, and extraction method, which complicates standardization for manufacturers. Regulatory authorities in different regions apply strict rules to health claims related to antioxidant or disease-prevention benefits. This limits marketing messaging and may reduce perceived value among informed consumers. Additionally, concerns about caffeine content and possible interactions with medications lead some individuals, especially those sensitive to stimulants to avoid polyphenol-rich formulations. These factors constrain rapid expansion in mature and regulated markets.
Shift toward standardized high-purity extracts, increased incorporation into non-beverage formats, and rising demand for clean-label natural antioxidants define key trends.
Suppliers are producing standardized green tea polyphenol extracts with verified catechin profiles to improve consistency and support regulatory compliance. Food and personal-care brands incorporate polyphenols into snacks, bakery items, skincare products, and oral-care formulations to leverage antioxidant and anti-inflammatory properties beyond traditional tea beverages. Demand for antioxidant supplements without synthetic additives supports growth of clean-label, vegan, and non-GMO certified products. Emerging research on polyphenol benefits in metabolic health, skin aging, and cognitive support drives product innovation and broader application. These developments suggest sustained, multi-segment demand for green tea polyphenols across global health, food, beverage, and personal care markets.
The global green tea polyphenols market is growing as consumers seek botanical antioxidants for metabolic regulation, cognitive support, skin health, and heart-wellness. Food, beverage, nutraceutical, and cosmetics manufacturers continue to expand applications using standardized extracts containing EGCG, catechins, and flavonoids. India registers 11.8% CAGR, driven by dietary supplement growth and herbal beverage premiumization.
China follows at 10.9%, supported by deep manufacturing integration and global export capability. Japan posts 10.1% with strong scientific validation and healthy-aging demand. The United Kingdom grows at 9.2% through preventive-nutrition categories. Germany records 8.3%, reinforcing regulated supplement use, while the United States expands at 7.4% through functional beverage innovation and clean-label positioning.

| Country | CAGR (%) |
|---|---|
| India | 11.8% |
| China | 10.9% |
| Japan | 10.1% |
| UK | 9.2% |
| Germany | 8.3% |
| USA | 7.4% |
India grows at 11.8% CAGR, reinforced by expanding nutraceutical manufacturing, Ayurveda-guided antioxidant positioning, and rapid adoption of wellness beverages. Standardized EGCG extracts are increasingly incorporated into weight-management, blood-sugar balance, and immune-support capsules targeting young professionals and fitness-focused users. Herbal tea brands emphasize catechin content and natural caffeine alternatives, influencing purchasing decisions in urban retail channels. Cosmetic manufacturers adopt polyphenols for anti-pollution serums and hair vitality formulations. Indian tea-growing states provide consistent raw-leaf supply, enabling cost-efficient extraction for both domestic and export markets. Clean-label claims and vegan formulations drive higher-value SKUs in e-commerce channels.
China achieves 10.9% CAGR, supported by its extensive green-tea agricultural base and large-scale polyphenol extraction facilities distributed across Zhejiang and Fujian. Beauty-from-within categories grow rapidly, with EGCG-based ingestible products positioned for skin brightening, detox support, and fatigue reduction. Pharmaceutical-adjacent companies explore polyphenols for cardiovascular and metabolic-health outcomes. Domestic beverage producers introduce RTD teas and functional health drinks with quantified catechin content. Regulatory monitoring of pesticide and heavy-metal compliance supports global export acceptance. Proprietary extraction methods improve purity ratios and dissolution performance for tablets and drink powders.

Japan grows at 10.1% CAGR, driven by healthy-aging priorities, clinical research focus, and consumer trust in green-tea bioactives. EGCG-based formulations target oxidative-stress management, skin rejuvenation, liver support, and cognitive maintenance for senior populations. Ready-to-drink health beverages, sachets, and powder sticks enable daily low-dose consumption aligned with local preferences. Supplement procurement requires validated bioavailability data, shelf-stability testing, and allergen-safe certifications suited for Japan’s regulatory environment. Collaboration between beverage manufacturers and research institutions sustains category credibility.
The United Kingdom posts 9.2% CAGR, led by preventive-nutrition interest and premium clean-label supplements. Brands promote green tea polyphenols for weight management, immune resilience, and skin support, packaged in capsules and flavored gummies tailored to habit-based supplementation. Supermarket and online subscription channels maintain consistent consumer access. Formulation diversity includes hybrids with collagen, vitamin C, probiotics, and minerals for targeted outcomes. Regulatory expectations around contaminant safety and oxidative marker stability shape supplier selections.

Germany expands at 8.3% CAGR, driven by regulated supplement pathways emphasizing cardiometabolic and weight-support benefits. Pharmacist-guided sales contribute to steady adoption of standardized EGCG capsules with traceable analytical profiles. Beverage and functional-food applications remain niche but expanding under controlled claim frameworks. Manufacturers prioritize solvent-free extraction, low-residue guarantees, and validated polyphenol stability. Recyclable packaging and sustainability certifications support procurement aligned with environmental governance expectations.

The United States grows at 7.4% CAGR, led by strong functional beverage development, sports-nutrition adoption, and antioxidant dietary supplements. Product labels highlight catechin concentration, caffeine synergy, and oxidative-stress protection to appeal to active lifestyle consumers. Gummies, powders, and liquid shots expand flavor-driven engagement. Skincare brands integrate polyphenols into anti-aging and anti-pollution formulations using green-tea-derived concentrates. Retailers require non-GMO, allergen-free, and organic certifications for premium shelf placement. Scientific storytelling supports category visibility in digital marketing and practitioner-recommended channels.

Global demand for green tea polyphenols spans nutraceutical, skincare, and functional beverage applications. Selection criteria emphasize EGCG concentration, oxidative-stability control, and traceability of leaf sourcing, particularly from Japan and China. Regulatory compliance requires suppliers to demonstrate contaminant testing, solvent-residue management, and accurate botanical identity. Buyers in North America, Europe, and East Asia prioritize predictable performance in formats targeting metabolic support, immune resilience, and environmental-stress defense for skin.
BASF SE holds roughly 11.7% share. It supplies tested extracts suitable for dermocosmetic lines and fortified nutrition products where validated antioxidant activity and shelf-life compatibility are required. Croda International supports premium skincare and personal-care formulations through concentrated actives designed for pollution-exposure routines and tone-support concepts. Evonik Industries and Symrise maintain influence in cosmetic channels by integrating polyphenols with delivery technologies that stabilize catechin activity under variable pH and temperature conditions.
Dow supports higher-volume wellness and beverage applications with reliable ingredient documentation and compatibility data. Ashland and Clariant supply clean-label-focused extracts that meet sustainability audits and environmental standards. Broader participation from Seppic, Lubrizol, Lonza, Inolex and related botanical specialists drives innovation in capsules, gummies, and skin defense serums. Competitive strength depends on controlled EGCG standardization, taste-profile optimization for beverages, and proven stability for topical use.
| Items | Values |
|---|---|
| Quantitative Units | USD billion |
| End Use Application | Skin Care, Body Care, Hair Care, Sun Care, Color Cosmetics, Men’s Grooming, Baby & Kids Care, Dermocosmetic / Professional Care |
| Product Form | Powder, Granules / Agglomerates, Flakes, Pellets / Prills, Liquid (Solution), Concentrate (High-active Liquid), Dispersion / Suspension, Emulsion, Paste, Gel, Wax / Solid Block, Oil |
| Regions Covered | Asia Pacific, Europe, North America, Latin America, Middle East & Africa |
| Countries Covered | India, China, USA, Germany, South Korea, Japan, Italy, and 40+ countries |
| Key Companies Profiled | BASF SE, Croda International, Evonik Industries, Symrise (incl. IFF/Givaudan actives), Dow / Dow Inc., Ashland, Clariant, Others (Seppic, Lubrizol, Lonza, Inolex etc.) |
| Additional Attributes | Dollar sales by application and product form; influence of antioxidant and anti-inflammatory benefits in cosmetic and personal care formulations; strong sourcing and supply chains from green tea-producing Asia Pacific countries; demand acceleration in anti-aging, UV-protection, and sensitive-skin products; increasing usage in premium and dermocosmetic categories; regulatory compliance for EGCG content standards; competitive developments in high-purity extraction and stabilization technologies. |
The global green tea polyphenols market is estimated to be valued at USD 0.5 billion in 2025.
The market size for the green tea polyphenols market is projected to reach USD 1.1 billion by 2035.
The green tea polyphenols market is expected to grow at a 8.7% CAGR between 2025 and 2035.
The key product types in green tea polyphenols market are skin care, body care, hair care, sun care, color cosmetics, men’s grooming, baby & kids care and dermocosmetic / professional care.
In terms of product form, powder segment to command 15.5% share in the green tea polyphenols market in 2025.