The main category of All News Articles.
You can use the search box below to find what you need.
[wd_asp id=1]
The main category of All News Articles.
You can use the search box below to find what you need.
[wd_asp id=1]
The demand for EPA and DHA omega-3 ingredients in the UK is projected to grow from USD 260.0 million in 2025 to approximately USD 408.0 million by 2035, the market will rise at a CAGR of 4.6% which recording an absolute increase of USD 148.0 million over the forecast period. The Marine Oils segment is projected to account for 63.0% of UK EPA and DHA omega-3 ingredient demand in 2025.
Marine oil sources are fundamental to the UK industry for several overlapping reasons, including their superior EPA and DHA concentration characteristics, established supply chain infrastructure, and proven effectiveness in delivering cardiovascular and cognitive health benefits while maintaining regulatory acceptance and consumer recognition.
The dietary supplements application segment is expected to represent 52.0% of UK EPA and DHA omega-3 ingredient demand in 2025. Health-conscious consumers are fundamental to the omega-3 ingredient industry because they provide the advanced nutritional requirements, comprehensive wellness opportunities, and standardized efficacy characteristics required for preventive healthcare success and functional nutrition integration.
Between 2025 and 2030, demand for EPA and DHA omega-3 ingredients in the UK is projected to expand from USD 260.0 million to USD 324.5 million, resulting in a value increase of USD 64.5 million, which represents 43.6% of the total forecast growth for the decade. This phase of growth will be shaped by rising health consciousness among aging populations, increasing scientific validation of omega-3 benefits, and growing demand for advanced nutritional ingredients across UK wellness sectors, particularly in regions where cardiovascular disease prevention and cognitive health awareness are accelerating omega-3 adoption. Increasing integration of omega-3 fortification in functional food formulations and growing adoption of preventive healthcare solutions continue to drive demand. Advanced supplement manufacturers and ingredient suppliers are expanding their production capabilities to address the growing complexity of modern health requirements and quality standards, with UK operations leading investments in bioavailability enhancement and purity assurance systems.
From 2030 to 2035, demand is forecast to grow from USD 324.5 million to USD 408.0 million, adding another USD 83.5 million, which constitutes 56.4% of the overall ten-year expansion. This period is expected to be characterized by expansion of algae-based omega-3 production and alternative sourcing methods, development of enhanced bioavailability formulations and targeted delivery systems, and implementation of comprehensive quality programs across different nutritional and pharmaceutical sectors. The growing adoption of personalized nutrition approaches and enhanced efficacy requirements, particularly in cardiovascular and cognitive health applications, will drive demand for more sophisticated omega-3 varieties and validated formulation solutions.
Between 2020 and 2025, EPA and DHA omega-3 ingredient demand in the UK experienced steady expansion, driven by increasing cardiovascular health awareness and growing recognition of omega-3 fatty acids as essential nutrients for enhancing brain function and providing comprehensive wellness solutions across diverse consumer applications. The sector developed as healthcare professionals and supplement manufacturers, especially in major urban centers, recognized the need for proven nutritional ingredients and effective health support systems to achieve wellness objectives while meeting consumer expectations and quality requirements. Omega-3 ingredient suppliers and formulation providers began emphasizing clinical research validation and quality assurance to maintain competitive advantages and commercial viability.
| Metric | Value |
|---|---|
| UK EPA and DHA Omega-3 Ingredient Sales Value (2025) | USD 260 million |
| UK EPA and DHA Omega-3 Ingredient Forecast Value (2035) | USD 408 million |
| UK EPA and DHA Omega-3 Ingredient Forecast CAGR (2025-2035) | 4.6% |
Demand expansion is being supported by the accelerating emphasis on cardiovascular health and preventive healthcare nationwide, with the UK maintaining its position as a leading wellness-focused consumer base, and the corresponding need for scientifically validated nutritional ingredients for heart health, brain function, and inflammatory response applications. Modern supplement manufacturers rely on EPA and DHA omega-3 ingredient technologies to ensure product efficacy, consumer acceptance, and optimal pathway achievement toward health optimization.
Healthcare professionals and supplement companies are increasingly investing in omega-3 ingredient sourcing and integrated formulation solutions to enhance product profiles, access clinical research trends, and demonstrate evidence leadership in competitive wellness environments. Quality standards and regulatory compliance requirements are establishing standardized efficacy pathways that require scientific validation systems and performance assurance, with UK operations often pioneering large-scale implementation of advanced omega-3 ingredient technologies.
The EPA and DHA omega-3 ingredient demand in the UK is positioned for steady expansion, growing from USD 260.0 million in 2025 to USD 408.0 million by 2035, reflecting a 4.6% CAGR. Rising adoption of functional nutrition systems in supplement formulations, infant nutrition products, and fortified food applications is driving growth as manufacturers seek omega-3 solutions that maximize health benefit characteristics and comply with stringent purity standards. Additionally, demand from cardiovascular health applications and cognitive enhancement implementations strengthens opportunities for both sophisticated ingredient platforms and integrated delivery solutions.
Suppliers focusing on clinical validation, bioavailability enhancement, and advanced purity capabilities stand to gain from evolving health standards and consumer expectations for ingredient effectiveness, and therapeutic optimization.
The industry is segmented by source, application, and form. By source, sales are divided into marine oils, algal, and concentrates/EE categories. In terms of application, the industry is segmented into dietary supplements, infant formula, and foods & pharma. By form, the industry is segmented into concentrates and standard oils. Regionally, the industry is divided into England, Scotland, Wales, and Northern Ireland, with England representing a key growth and innovation hub for advanced nutritional ingredient technologies.
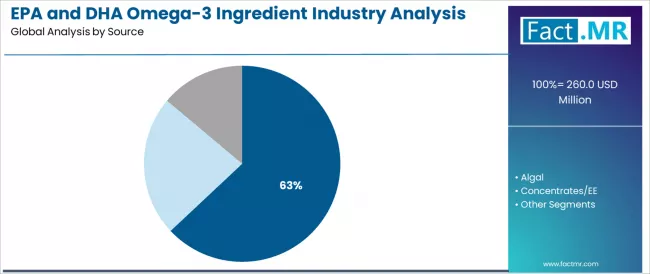
The Marine Oils segment is projected to account for 63.0% of UK EPA and DHA omega-3 ingredient demand in 2025, making it the leading source category across the sector. This dominance reflects the efficacy requirements and supply infrastructure needs of marine-derived systems for existing supplement formulations and nutritional applications where EPA and DHA concentration is optimized through superior extraction characteristics and reliable sourcing architecture.
In the UK, where substantial pharmaceutical infrastructure requires advanced ingredient integration without complete formulation redevelopment, marine oil platforms provide practical pathways for efficacy enhancement while maintaining product quality. Continuous innovations are improving concentration consistency, purity characteristics, and formulation integration parameters, enabling manufacturers to achieve high therapeutic standards while maximizing consumer acceptance.
The segment’s strong position is reinforced by the extensive existing supplement products requiring proven ingredient capabilities and growing availability of marine oil suppliers with established commercial experience.
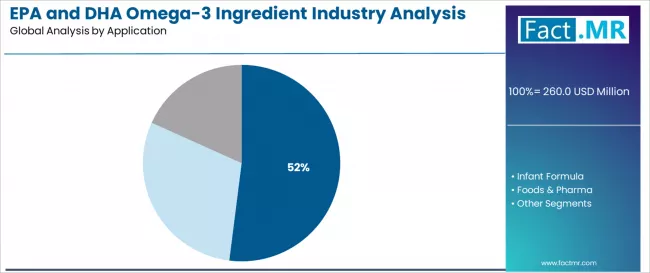
The Dietary Supplements segment is expected to represent 52.0% of UK EPA and DHA omega-3 ingredient demand in 2025, highlighting the critical importance of consumer health operations requiring comprehensive nutritional solutions. Wellness sector facilities including cardiovascular health supplements, cognitive enhancement products, and general wellness formulations generate consistent demand for EPA and DHA omega-3 ingredient systems that are clinically and commercially favorable for advanced health support applications.
The segment benefits from ingredient characteristics that often provide superior therapeutic outcomes compared to dietary alternatives, reducing health intervention complexity and improving consumer compliance. Dietary supplement applications also access enhanced efficacy optimization through formulation innovation that improves health outcomes and consumer appeal.
In the UK, where preventive healthcare operations represent substantial portions of wellness development, clinical excellence requires ingredient integration across diverse supplement formulations. In England and Scotland regions, where major pharmaceutical concentrations are significant, EPA and DHA omega-3 ingredient demand is elevated by emphasis on maintaining efficacy excellence while achieving consumer satisfaction targets.
UK EPA and DHA omega-3 ingredient demand is advancing steadily due to increasing cardiovascular health awareness and growing recognition of omega-3 fatty acids necessity for preventive healthcare, with England region serving as a key driver of innovation and application development. The sector faces challenges including competition from plant-based omega-3 alternatives, need for specialized purification infrastructure development, and ongoing concerns regarding raw material price volatility and marine sourcing considerations.
National health regulations and regional-level wellness initiatives, particularly preventive healthcare programs in England and Scotland regions, continue to influence EPA and DHA omega-3 ingredient selection and adoption timelines.
The enhancement of cardiovascular health research, gaining particular significance through government preventive care mandates and wellness awareness campaigns, is enabling omega-3 ingredient suppliers to achieve differentiation without prohibitive development costs, providing predictable demand patterns through healthcare professional recommendations and consumer health preferences. Enhanced clinical standards offering substantial opportunities for scientifically validated ingredients and evidence-based applications provide foundational dynamics while allowing suppliers to secure pharmaceutical agreements and research partnerships.
These trends are particularly valuable for first-mover suppliers and premium ingredient development that require substantial quality investments without immediate cost advantages.
Modern EPA and DHA omega-3 ingredient suppliers and premium pharmaceutical operators are establishing advanced production networks and centralized manufacturing facilities that improve operational efficiency through bioavailability enhancement and economies of scale. Integration of purification systems, high-precision concentration technology, and coordinated quality management enables more efficient omega-3 ingredient production across multiple manufacturing facilities.
Advanced production concepts also support next-generation health applications including personalized nutrition integration, therapeutic optimization, and regional ingredient supply networks that optimize system-level economics while enabling comprehensive purity monitoring across production regions, with UK developments increasingly adopting collaborative manufacturing models to reduce individual supplier costs and accelerate deployment.
| Region | CAGR (2025-2035) |
|---|---|
| England | 4.9% |
| Scotland | 4.5% |
| Wales | 4.2% |
| Northern Ireland | 3.9% |
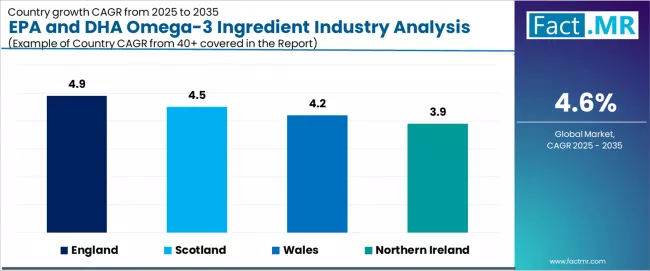
The UK EPA and DHA omega-3 ingredient demand is witnessing steady growth, supported by rising cardiovascular health awareness, expanding preventive healthcare initiatives, and the deployment of advanced nutritional ingredient technologies across regions. England leads the nation with a 4.9% CAGR, reflecting progressive health trends, substantial pharmaceutical innovation, and early adoption of premium supplement systems.
Scotland follows with a 4.5% CAGR, driven by extensive healthcare infrastructure, favorable wellness demographics, and concentration of research operations that enhance application development. Wales grows at 4.2%, as health optimization and preventive care opportunities increasingly drive EPA and DHA omega-3 ingredient deployment. Northern Ireland demonstrates growth at 3.9%, supported by expanding pharmaceutical facilities and regional healthcare initiatives.
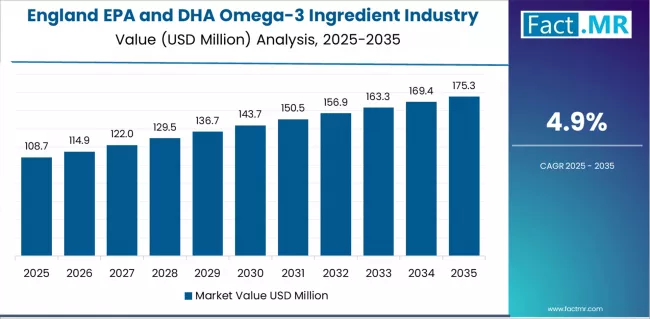
Demand for EPA and DHA omega-3 ingredients in England is projected to exhibit strong growth with a CAGR of 4.9% through 2035, driven by progressive health operational preferences, substantial pharmaceutical development creating premium ingredient opportunities, and concentration of advanced wellness advancement across London, Manchester, and Birmingham healthcare areas.
As the dominant region with extensive pharmaceutical infrastructure and innovation-focused health policies, England’s emphasis on comprehensive cardiovascular excellence and preventive care leadership is creating significant demand for advanced EPA and DHA omega-3 ingredient systems with proven efficacy and reliable therapeutic potential. Major supplement manufacturers and omega-3 ingredient suppliers are establishing comprehensive research development programs to support formulation advancement and premium health deployment across diverse applications.
Demand for EPA and DHA omega-3 ingredients in Scotland is expanding at a CAGR of 4.5%, supported by extensive healthcare facilities including cardiovascular health operations, advanced research institutions, and specialty pharmaceutical manufacturers generating concentrated demand favorable for omega-3 ingredient systems. The region’s health characteristics, featuring substantial pharmaceutical infrastructure and research requirements ideal for premium ingredient integration, provide operational advantages.
Healthcare expertise concentrated in Glasgow, Edinburgh, and regional research corridors facilitates application development and formulation management. EPA and DHA omega-3 ingredient suppliers and manufacturers are implementing comprehensive efficacy strategies to serve expanding precision-focused requirements throughout Scotland.
Demand for EPA and DHA omega-3 ingredients in Wales is growing at a CAGR of 4.2%, driven by substantial healthcare facilities from wellness operations, advanced pharmaceutical plants, and regional health consumption requiring advanced nutritional pathways.
The region’s healthcare base, supporting critical preventive care operations, is increasingly adopting advanced omega-3 ingredient technologies to maintain competitiveness while meeting health expectations. Manufacturers and EPA and DHA omega-3 ingredient suppliers are investing in formulation integration systems and regional supply infrastructure to address growing efficacy management requirements.
Demand for EPA and DHA omega-3 ingredients in Northern Ireland is advancing at a CAGR of 3.9%, supported by expanding healthcare facilities, regional pharmaceutical development including premium wellness consumption and health operations, and growing emphasis on efficacy solutions across the region.
Healthcare modernization and pharmaceutical facility expansion are driving consideration of EPA and DHA omega-3 ingredient systems as therapeutic enhancement pathways. Premium manufacturers and omega-3 ingredient suppliers are developing regional capabilities to support emerging efficacy deployment requirements.
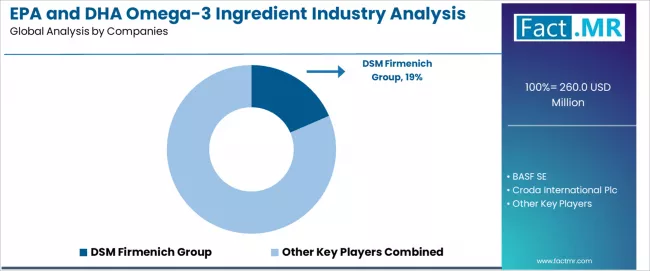
UK EPA and DHA omega-3 ingredient demand is defined by competition among specialized marine ingredient manufacturers, biotechnology companies, and integrated nutritional solution providers, with major pharmaceutical corporations maintaining significant influence through research resources and application development capabilities. Companies are investing in omega-3 ingredient advancement, manufacturing infrastructure optimization, quality network structures, and comprehensive technical services to deliver effective, reliable, and high-performance nutritional ingredient solutions across UK pharmaceutical and supplement applications.
Strategic partnerships, manufacturing infrastructure development, and first-mover application execution are central to strengthening competitive positioning and presence across efficacy, purity, and health technology applications.
DSM Firmenich Group, internationally recognized nutritional ingredient leader, leads with 18.5% share, offering comprehensive EPA and DHA omega-3 ingredient solutions including formulation development, manufacturing, and technical services with focus on pharmaceutical applications, bioavailability optimization, and quality enhancement across UK operations. BASF SE, operating with extensive UK presence, provides integrated nutritional ingredient solutions leveraging German chemical expertise, application development, and quality management capabilities.
Croda International Plc delivers full-service omega-3 ingredient implementation including biotechnology development, purity optimization, and formulation integration serving UK and international pharmaceutical projects. Epax AS emphasizes comprehensive marine oil solutions with integrated purification capabilities, specialty concentrates, and application features leveraging advanced Norwegian sector expertise. GC Rieber AS offers EPA and DHA omega-3 ingredient application development and manufacturing operations for pharmaceutical facilities and supplement companies across UK operations.
| Item | Value |
|---|---|
| Quantitative Units (2035F) | USD 408 million |
| Source | Marine Oils, Algal, Concentrates/EE |
| Application | Dietary Supplements, Infant Formula, Foods & Pharma |
| Form | Concentrates, Standard Oils |
| Regions Covered | England, Scotland, Wales, Northern Ireland |
| Key Companies | DSM Firmenich Group, BASF SE, Croda International Plc, Epax AS, GC Rieber AS |
| Additional Attributes | Sales by source and application segment; regional demand trends across England, Scotland, Wales, and Northern Ireland; competitive landscape with established ingredient manufacturers and specialized biotechnology firms; manufacturer preferences for marine oils versus algal sources; integration with preventive healthcare programs and cardiovascular health policies, particularly advanced in the England region |
Jakarta, Pintu News – Dogecoin has experienced a consistent decline since its peak in November 2024. There was a brief attempt at recovery in September 2025, but it quickly lost momentum and DOGE continued to slide, hitting a yearly low earlier this month.
However, late last week, DOGE finally experienced a price bounce, following the rebound trend that also occurred in a number of other meme coins such as Fartcoin . One of the main triggers that allegedly drove this rise was the launch of Grayscale’s Dogecoin ETF(exchange-traded fund), which officially started trading today.
ETF debuts usually attract an influx of institutional funds, and ETF launches for other cryptocurrencies have sparked short-term rallies in the past. Now, traders are watching closely to see if the Dogecoin ETF will have a similar positive effect, or if this bounce will end like previous rebounds that failed to hold.
Read also: Ethereum Climbs to $2,900 Today: Is a Bigger Rally on the Horizon?
On November 25, 2025, Dogecoin saw a 1.94% gain over the past 24 hours, trading at $0.1515 — approximately IDR 2,518. During this period, DOGE fluctuated between IDR 2,401 and IDR 2,565.
At the time of writing, Dogecoin’s market capitalization is estimated at around IDR 380.8 trillion, with a 24-hour trading volume of roughly IDR 28.23 trillion.
Since early September, Dogecoin (DOGE) has formed afive-wave decline pattern, with the last wave forming a diagonal ending pattern-a patternthat is often considered a sign that the downtrend is starting to lose steam.
This pattern is important because the ending diagonal usually appears at the end of a major selling phase and can be an early signal that the momentum direction is starting to reverse. Currently, the momentum indicator is starting to support the possibility of such a reversal.
The Relative Strength Index (RSI) indicator shows a bullish divergence, which is when the price prints a new low, but the RSI forms a higher low. This is a classic signal that selling pressure is starting to weaken.
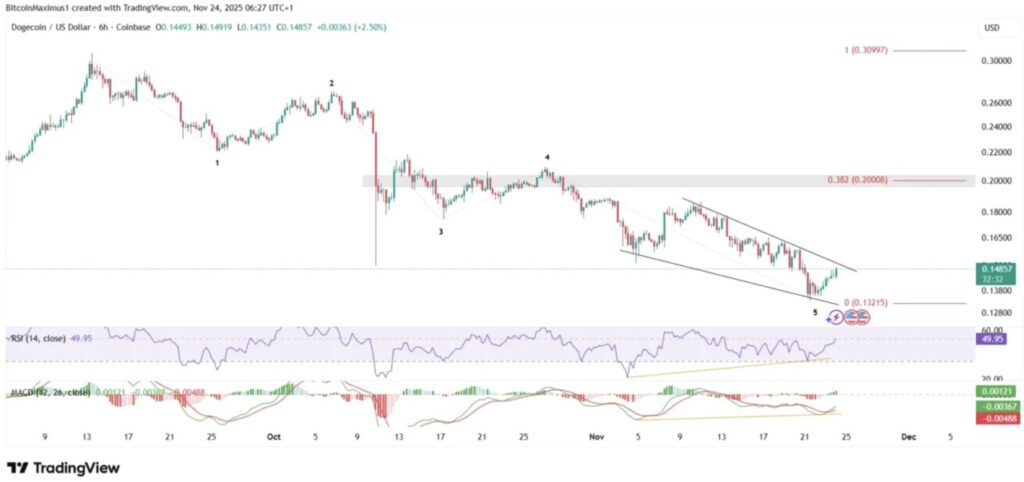
The RSI is also approaching the key level of 50. If it manages to break above this level, it usually signals the beginning of a trend reversal. In addition, the Moving Average Convergence/Divergence (MACD) indicator is also showing a similar divergence.
If the Dogecoin price manages to break out of the wedge pattern formed, a quick spike to the horizontal area around $0.20 is highly likely. This breakout would confirm the end of the five-wave bearish pattern.
Rotational moves in the memecoin market like this often trigger sharp rallies in DOGE, as traders get back into the biggest meme coins by market capitalization.
Although the short-term chart gives hope for a price bounce, the weekly chart shows a clear bearish trend.
The weekly chart shows the moment when the trend turned down (marked by the red icon). In November, Dogecoin broke the upside support trend line that had been in place for 763 days. This was significant because it signaled that the uptrend of the past two years was over.
As a result of this breakout, traders are now eyeing a potential drop towards $0.115, which is the nearest horizontal support area – about 20% below the current price.
Read also: Bitcoin Holds Steady at $87,000, Is a 10–12% Price Surge on the Horizon?
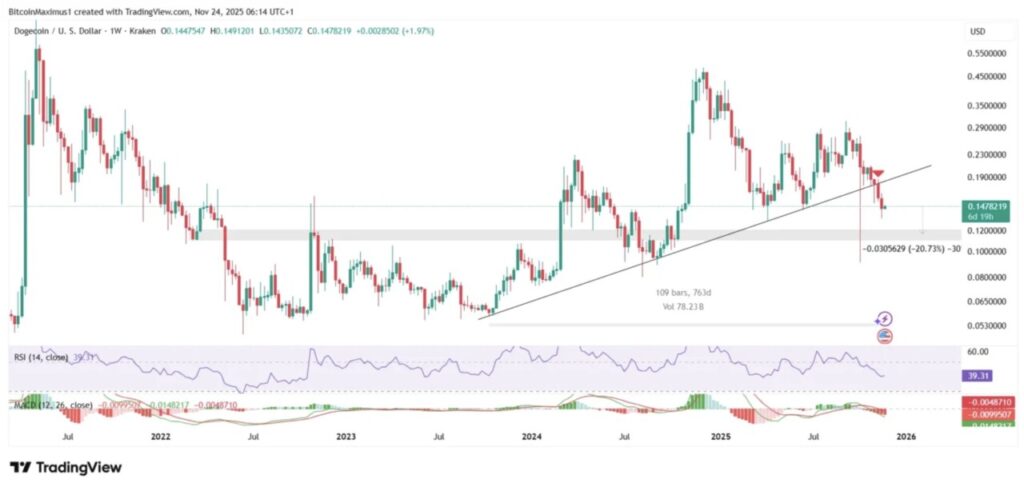
Momentum indicators reinforce this negative view. The RSI dropped below the 50 level, indicating the dominance of the bearish trend. This signal becomes even stronger when combined with the MACD movement, which has also turned negative, confirming the change in trend direction.
If these signals continue, Dogecoin will most likely continue to fall in the long term, with a downside target of at least the $0.115 range.
The main reason why Dogecoin surged over the weekend and continues to rise today is the launch of Grayscale’s Dogecoin ETF which is scheduled to officially launch today.
ETFs like this usually attract liquidity from institutional investors, which can push asset prices up significantly. Given the bullish short-term technical signals, the price of DOGE has the potential to break out of the wedge pattern and rise to the $0.200 area.
However, the long-term projection still remains bearish. Dogecoin is expected to weaken again and most likely drop to the next support level around $0.115.
Traders are advised to closely monitor the movement of DOGE – specifically whether the price manages to break out of the wedge pattern, and then watch the market reaction at the $0.20 area as the next key level.
That’s the latest information about crypto. Follow us on Google News to get the latest crypto news about crypto projects and blockchain technology. Also, learn crypto from scratch with complete discussion through Pintu Academy and stay up-to-date with the latest crypto market such as bitcoin price today, xrp coin price today, dogecoin and other crypto asset prices through Pintu Market.
Enjoy an easy and secure crypto trading experience by downloading Pintu crypto app via Google Play Store or App Store now. Also, get a web trading experience with various advanced trading tools such as pro charting, various types of order types, and portfolio tracker only at Pintu Pro.
*Disclaimer
This content aims to enrich readers’ information. Pintu collects this information from various relevant sources and is not influenced by outside parties. Note that an asset’s past performance does not determine its projected future performance. Trading crypto carries high risk and volatility, always do your own research and use cold hard cash before investing. All activities of buying and selling bitcoin and other crypto asset investments are the responsibility of the reader.
Reference:
Copper price began forming bullish waves yesterday, attempting to face the temporary negative pressure to reinforce the dominance of the main bullish scenario, to fluctuate near $5.0500 level now.
We expect to provide mixed trading, noting that the attempt to resume the bullish attack requires breaching the initial barrier near $5.2000, while the stability below it might force it to form corrective wave to reach towards the initial support at $4.7500.
The expected trading range for today is between $4.9500 and $5.2000
Trend forecast: Fluctuated
The GBPJPY pair provided mixed trading yesterday, affected by the contradiction between the main indicators, which might cause activating the bearish corrective track, so the stability below 206.90 forms main factor to confirm the negative suggestion in the near-term trading, therefore, we will keep waiting for its activation with stochastic negativity, to begin targeting corrective stations that might begin at 203.75.
Note that the price attempt to rally above 206.00 may delay the corrective trading in the current period, paving the way for retesting the mentioned barrier before reaching the suggested corrective targets.
The expected trading range for today is between 203.75 and 206.00
Trend forecast: Bearish
Global consumers are living through ongoing uncertainty, influencing daily choices and long-term plans.
People want control of their emotional and physical well-being, yet rising barriers to healthy living, along with financial stress and global conflict, leave many feeling less in control.
As a result, consumers are turning to small pleasures, meaningful relationships and products that offer comfort, value or escape.
Meanwhile, growing distrust of information sources and concerns that society is “changing too fast” are reshaping expectations throughout food, drink and wellness.
Our 2026 outlook highlights ten major global consumer trends, with the first five and their subtrends outlined here.
Silver (XAG/USD) rallies sharply during the North American session, edged up more than 2.50% after bouncing off daily lows of $49.73 and trades at $51.37 at the time of writing. Expectations that the Federal Reserve might ease policy in December push US Treasury yields lower, a tailwind for the non-yielding metal.
Silver’s uptrend in the short-term resumed, but traders need to clear key resistance at $52.46, November 13 high. A breach of the latter will expose the yearly high of 54.46 reached in mid-October, ahead of the $55.00 milestone.
Momentum as measured by the Relative Strength Index (RSI) is bullish, hence the path of least resistance is upwards.
Conversely, if XAG/USD tumbles below $51.00, look for a drop towards $50.00. Once cleared, the 20-day SMA is up next at $49.67, followed by the 50-day SMA at $48.45
Silver is a precious metal highly traded among investors. It has been historically used as a store of value and a medium of exchange. Although less popular than Gold, traders may turn to Silver to diversify their investment portfolio, for its intrinsic value or as a potential hedge during high-inflation periods. Investors can buy physical Silver, in coins or in bars, or trade it through vehicles such as Exchange Traded Funds, which track its price on international markets.
Silver prices can move due to a wide range of factors. Geopolitical instability or fears of a deep recession can make Silver price escalate due to its safe-haven status, although to a lesser extent than Gold’s. As a yieldless asset, Silver tends to rise with lower interest rates. Its moves also depend on how the US Dollar (USD) behaves as the asset is priced in dollars (XAG/USD). A strong Dollar tends to keep the price of Silver at bay, whereas a weaker Dollar is likely to propel prices up. Other factors such as investment demand, mining supply – Silver is much more abundant than Gold – and recycling rates can also affect prices.
Silver is widely used in industry, particularly in sectors such as electronics or solar energy, as it has one of the highest electric conductivity of all metals – more than Copper and Gold. A surge in demand can increase prices, while a decline tends to lower them. Dynamics in the US, Chinese and Indian economies can also contribute to price swings: for the US and particularly China, their big industrial sectors use Silver in various processes; in India, consumers’ demand for the precious metal for jewellery also plays a key role in setting prices.
Silver prices tend to follow Gold’s moves. When Gold prices rise, Silver typically follows suit, as their status as safe-haven assets is similar. The Gold/Silver ratio, which shows the number of ounces of Silver needed to equal the value of one ounce of Gold, may help to determine the relative valuation between both metals. Some investors may consider a high ratio as an indicator that Silver is undervalued, or Gold is overvalued. On the contrary, a low ratio might suggest that Gold is undervalued relative to Silver.
Solana is back in focus as traders position themselves ahead of the upcoming Fed decision, hoping the market finally gets the spark it needs.
The SOL price today hovers near key resistance, and investor sentiment is shifting as ETF inflows rise and network upgrades progress.
With institutional demand growing and volatility tightening, many are asking the same question: does Solana have enough strength to make a real push toward $200 again?
Solana is back on traders’ radar as fresh institutional flows push optimism higher ahead of the upcoming Fed interest rates decision due this week. The latest SOL news shows momentum building again, with Solana spot ETFs from Bitwise, Grayscale, Fidelity, VanEck, and 21Shares pulling in $476 million over 17 straight days.
This strong demand has started shaping a new SOL price prediction as investors speculate whether the network can regain enough strength to make a run toward $200.
On-chain Solana news also highlights an active governance vote aiming to speed up Solana’s supply-curve reduction, a move that could support long-term value. Meanwhile, Coinbase’s acquisition of Vector, a Solana-based DEX, is expanding trading tools and attracting more institutional users.

Solana price source: Brave New Coin SOL market data
Still, the short-term picture remains complicated. Indicators show bearish pressure, even though the SOL price today sits near zones where oversold signals usually spark relief rallies. Momentum remains weak, but several oscillators suggest the downside could be limited. Many traders now expect consolidation before any decisive move.
For now, the key Solana price prediction hinges on one thing — whether Solana can hold support above $121 and maintain its current break above $133. If buyers return before the Fed announcement, the path toward $150 becomes clearer, with $200 still possible if ETF inflows continue.
| Token | Remittix | Solana |
| Token Profile | Emerging PayFi project focused on real-world money movement | Established Layer-1 blockchain known for speed and low fees |
| Primary Use Case | Instant crypto-to-fiat settlements, global payments, business APIs | High-throughput smart contracts, DeFi, NFTs, gaming |
| Market Narrative | Attracting payment-focused investors and whales seeking utility | Traders watching for recovery and ETF-driven demand |
| Main Risk | Early-stage execution and adoption timelines | Network congestion history and volatility around Fed decisions |
| Investor Appeal | Utility-first, revenue-aligned design, strong transparency | Scalability, institutional inflows, strong ecosystem presence |

As traders debate whether Solana has enough strength to reclaim $200 ahead of the Fed decision, Remittix is becoming the unexpected winner in the background. While SOL news focuses on ETF inflows and governance changes, some investors are taking a close look at Remittix. The reason is simple. Remittix offers real payment utility at a time when the market is tired of speculation.
The project is building a full PayFi system that lets users convert crypto to fiat and send money globally in minutes. It supports more than 100 cryptocurrencies and offers instant settlement. It also removes the foreign exchange fees that frustrate freelancers, remote workers, and businesses.
Its traction grows because Remittix is delivering real progress:
Wallet now in beta testing with active community feedback
Fully audited smart contracts from CertiK and a verified development team
Confirmed listings on BitMart and more top exchanges coming
Built for a global payments market worth more than $19 trillion
Investors say the combination of transparency, product readiness, and global demand makes Remittix one of the most credible new entrants. Momentum increased further after the team launched a referral system that gives users 15% of each referred purchase in USDT, claimable daily.
While traders debate the next Solana price prediction, Remittix is gaining long-term positioning with payment-focused investors. If utility becomes the main theme of the year, RTX could be the real outperformer.
Discover the future of PayFi with Remittix by checking out their project here:
Website: https://remittix.io/
Socials: https://linktr.ee/remittix
$250K Giveaway: https://gleam.io/competitions/nz84L-250000-remittix-giveaway
How risky are new crypto tokens?
Early crypto projects come with higher risk since their teams, technology, and market depth are not yet proven. Strong audits, transparent founders, and real utility reduce that risk, but investors should still approach early projects with caution.
What catalysts could push Solana higher?
Solana could climb if ETF inflows continue, on-chain activity rebounds, and its governance proposal to reduce token issuance passes. Institutional adoption and Coinbase’s new Solana trading integrations may also give the network fresh momentum.
This is a sponsored article. Opinions expressed are solely those of the sponsor and readers should conduct their own due diligence before taking any action based on information presented in this article.
Gold price (XAU/USD) attracts some buyers to around $4,140 during the early Asian session on Tuesday. The precious metal rises on growing expectations of a US Federal Reserve (Fed) interest rate cut in the December policy meeting. Traders await the release of the US ADP Employment Change Weekly, Retail Sales, and Producer Price reports, which are due later on Tuesday.
Several Fed officials signalled support for a December rate reduction, which underpins the yellow metal. Fed Governor Christopher Waller said on Monday that available data showed the US job market remains weak enough to warrant another quarter-point rate cut at the Fed’s December policy meeting. Meanwhile, San Francisco Fed President Mary Daly stated that the US central bank should cut the rates as the labor market has become increasingly vulnerable.
“The market is increasingly getting convinced that the U.S. Federal Reserve is on track to cut interest rates in December,” said Bart Melek, head of commodity strategies at TD Securities. Lower interest rates could reduce the opportunity cost of holding Gold, supporting the non-yielding precious metal. Markets are now pricing in nearly an 80% chance of a Fed interest rate cut of a quarter-point next month, up from 30% odds before their remarks, according to the CME FedWatch tool.
Traders brace for fresh US economic data later on Tuesday for further clues on the monetary policy. The US Producer Price Index (PPI) is expected to show an increase of 0.3% MoM in September, while the Retail Sales are projected to show a rise of 0.4% MoM during the same period. If the reports show hotter-than-expected outcomes, this could lift the US Dollar (USD) and weigh on the USD-denominated commodity price.
Gold has played a key role in human’s history as it has been widely used as a store of value and medium of exchange. Currently, apart from its shine and usage for jewelry, the precious metal is widely seen as a safe-haven asset, meaning that it is considered a good investment during turbulent times. Gold is also widely seen as a hedge against inflation and against depreciating currencies as it doesn’t rely on any specific issuer or government.
Central banks are the biggest Gold holders. In their aim to support their currencies in turbulent times, central banks tend to diversify their reserves and buy Gold to improve the perceived strength of the economy and the currency. High Gold reserves can be a source of trust for a country’s solvency. Central banks added 1,136 tonnes of Gold worth around $70 billion to their reserves in 2022, according to data from the World Gold Council. This is the highest yearly purchase since records began. Central banks from emerging economies such as China, India and Turkey are quickly increasing their Gold reserves.
Gold has an inverse correlation with the US Dollar and US Treasuries, which are both major reserve and safe-haven assets. When the Dollar depreciates, Gold tends to rise, enabling investors and central banks to diversify their assets in turbulent times. Gold is also inversely correlated with risk assets. A rally in the stock market tends to weaken Gold price, while sell-offs in riskier markets tend to favor the precious metal.
The price can move due to a wide range of factors. Geopolitical instability or fears of a deep recession can quickly make Gold price escalate due to its safe-haven status. As a yield-less asset, Gold tends to rise with lower interest rates, while higher cost of money usually weighs down on the yellow metal. Still, most moves depend on how the US Dollar (USD) behaves as the asset is priced in dollars (XAU/USD). A strong Dollar tends to keep the price of Gold controlled, whereas a weaker Dollar is likely to push Gold prices up.
The company, founded by Thanh Hung Nguyen and Minh Anh Le in 2023, has so far launched capsules and powder products made using spirulina, a blue-green algae. Nguyen was also inspired by his grandfather, Professor Duong Duc Tien, a leading scientist for algae and spirulina research in Vietnam.
It is also tapping into the benefits of other types of algae, including brown algae and red algae, to formulate a variety of wellness products.
An upcoming launch is TA Vital Carb & Fat Block – a weight management product that uses brown algae extract.
The product is said to support weight control by inhibiting the body’s digestion and absorption of carbohydrates and fats.
Brown algae extract works by inhibiting the active site of the enzyme lipase and preventing fat molecules from being broken down into monoglycerides.
Undigested fat molecules will then be passed down to the colon, where they will be excreted from the body.
According to the duo, the “carbohydrate and fat-blocking” method differs from most weight management solutions currently sold in Vietnam, where breaking down fats or lipids is a common mechanism seen in weight management supplements.
“In the Vietnamese market, many traditional weight-management solutions rely on ingredients such as mangosteen extract, which is commonly promoted for its ability to break down existing or stored fats in the body,” Le told NutraIngredients.
“However, products built around this approach often push the body into rapid fat-mobilisation pathways. This can create fatigue and place stress on the body’s internal balance, which is not ideal for long-term health in a hot and humid climate.”
He said that other popular solutions on the market include “flush-out” or diuretic-type products that work by expelling water from the body.
Although the method may produce quick results, it can also cause dehydration, especially in Southeast Asia, where the humid climate is already causing people to perspire more than usual.
“We do not consider this a healthy or sustainable method of managing weight.
“Our development approach with TA Vital Carb & Fat Block is different. Instead of forcing the body into an extreme fat-burning state, we focus on reducing the digestion and absorption of carbs and fats from daily meals.
“This supports weight control while maintaining internal metabolic stability – allowing consumers to continue enjoying indulgences like rice, noodles, and local comfort foods without drastic lifestyle changes,” he said.
The company has conducted an in-house 16-week study of the product on eight overweight women with a body mass index (BMI) of 28 to 35.
He said that findings have shown a statistically significant reduction in body weight, body fat, and abdominal fat in individuals who took brown algae extract.
A study published in Nutrients in 2023 also reported how brown seaweed supplementation – specifically Laminaria digitata, Undaria pinnatifida, Acophyllum nodosum, and Fucus vesiculosus species – was significantly associated with improvements in postprandial blood glucose levels.
Nguyen added that a weight management supplement that acts by blocking carbohydrate absorption can allow consumers to continue with their usual diets.
“Vietnamese cuisine — similar to many Southeast Asian diets — is naturally carbohydrate-heavy, centred around rice, noodles, banh mi, and pho. Completely avoiding these staples would be unrealistic and uncomfortable for most people.
“A carbohydrate-blocking product aligns well with this lifestyle by offering a way to support weight management without requiring people to give up their cultural food habits, enabling a more sustainable and approachable path to healthier living,” he said.
Spirulina is not new to Vietnamese consumers, but the market is largely dominated by Japanese brands, said Nguyen, who aims to build TA Vital as the go-to spirulina brand in Vietnam.
He said that among the Vietnamese, spirulina was known for blood lipid control and immune support. Lately, there is also a trend of consuming spirulina as a source of protein among vegans.
He added that most Vietnamese accessed spirulina products or fucoidan – a polysaccharide found in brown algae – during their trips to Japan, which could work to the firm’s favor as well.
“The Vietnamese spirulina market today is still dominated by Japanese brands, mostly brought in through tourist hand-carry channels.
“This leads to inconsistent pricing, limited brand support, and no structured consumer education. TA Vital sees an opportunity to build a more reliable and accessible presence in this category locally,” he said.
The company manufactures its health supplements via an OEM firm in Singapore.
The company also plans to make spirulina and algae bioactives into meal replacement and supplements for sleep, stress, and immune support.
Nguyen believes that spirulina and algae will not remain only as health ingredients, but could become a strategic food source in the future.
“We anticipate a significant rise in urban populations over the next few decades. As cities grow denser, the pressure on food systems will increase, and consumers will seek nutrient-dense, safe, and convenient functional foods to support modern, active lifestyles.
“This is why our R&D pipeline is moving toward microalgae-based nutrition, leveraging spirulina and other algae proteins for future meal-replacement formulas and functional beverages. The goal is to create convenient formats that support daily needs such as sleep, stress, immunity, and overall energy—using algae bioactives as the core foundation,” he said.
The company currently sells its products through e-commerce, boutique clinics, and over-the-counter (OTC) channels in Vietnam. It is also looking to launch in Singapore after the Lunar New Year next year, as well as in Hong Kong and the Philippines.
XRP has climbed back above the $2 threshold after a volatile week, drawing renewed market interest as traders assess whether improving technical conditions can support a move toward the $3 region.
The rebound follows a sharp correction below $1.80, and current price action now reflects a blend of cautious optimism and structural uncertainty—conditions that typically precede major directional moves in the XRP market.
As of November 23, 2025, XRP is trading around $2.04, up 6.4% in the last 24 hours, though it remains down 10.2% week-over-week and 16.5% on the month. The token is still trading more than 45% below its July 2025 all-time high, underscoring the scale of the prior correction.
Analysts from the crypto market data group CRYPTOWZRD, which tracks high-timeframe liquidity flows, note a significant sell wall between $2.00 and $2.10.They explain that a daily close above $2.10 would mark a meaningful shift in short-term sentiment, as this zone has acted as a liquidity barrier during recent attempts to reclaim higher levels.
Approximately 1.80 billion XRP were accumulated near $1.75, establishing it as a significant support level. Source: Ali Martinez via X
On-chain distribution data referenced by market analyst Ali Martinez, who frequently analyzes tokenholder clusters, suggests that roughly 1.8 billion XRP were accumulated around the $1.75 zone. This makes the level a structurally important support if the price weakens.
Should buying pressure persist, the next major resistance sits near $2.60, a region historically associated with high-volume trading activity.
Several short-term indicators point to improving momentum.Technical analyst QuantumFox (@QantaFox)—known for tracking breakout structures across major altcoins—notes that XRP’s 1-hour chart has recently broken above a descending triangle formation.
Instead of framing this as an imminent “explosive” move, a more evidence-based interpretation is

The post highlights a potential XRP breakout above $2.05 as the price rebounds to $2.04, while replies debate regulatory needs and mock an earlier missed $5 forecast. Source: QuantumFox via X
If the breakout is confirmed by sustained volume and a closing price above $2.10, the current structure could support a continuation toward the mid-$2 range and potentially higher targets.
This aligns with a broader pattern seen in XRP’s prior compression phases—for example, the late-2023 consolidation period, when XRP required multiple days of elevated volume before clearing a major resistance pivot.
Recent market developments are contributing to improved sentiment, though their impact varies:
Ripple’s commitment of $500 million to expand infrastructure and partnerships may increase long-term confidence.While such investments don’t directly affect price, they often influence trader psychology by signaling strong ecosystem support and reinforcing expectations for future network growth.
Binance’s XRP balance has reportedly declined to 2.785 billion tokens, according to exchange reserve trackers.
Lower supply on major exchanges can tighten liquidity—especially during periods of rising demand—and historically this has improved the probability of sustained rallies.However, the effect depends on whether broader market conditions continue to favor risk assets.
XRP has a history of extended consolidation followed by sharp trend expansions. Last year’s 400% rally occurred after a multi-week base and coincided with favorable liquidity conditions.
Analysts cite Fibonacci extensions to outline potential targets:
These levels are technically relevant because they often align with profit-taking zones and trend exhaustion points during strong momentum phases.

Last year’s 400% post-consolidation rally suggests that, if similar conditions align, XRP could again approach the $3.40 Fibonacci 1.272 level and potentially the $4.30 1.618 extension. Source: Randal255 on TradingView
However, current market conditions differ from prior cycles—regulatory scrutiny remains elevated, liquidity is fragmented, and macro volatility is higher. Therefore, historical performance should be viewed as context, not a guarantee.
Despite positive momentum, multiple risk factors could interrupt upside progress:
1. Resistance Clusters: A dense block of limit orders between $2.00 and $2.10 could stall the rally if buying pressure weakens.
2. Low-Volume Nodes: Regions quickly passed during prior rallies may attract retests, causing short-term pullbacks.
3. CVD (Cumulative Volume Delta) Divergence: If CVD shows buyers losing strength while price rises, it may signal absorption—a common precursor to a retracement.

XRP is rallying, but clustered limit orders may trigger a pullback into low-volume areas; I’m watching CVD and price action for a potential short. Source: DrStrangeTrades on TradingView
A daily close below $1.90, indicating failed breakout confirmation
Volume is declining during upward movement
Rejection at $2.10 accompanied by a strong sell-side delta
Such signals would point toward consolidation or renewed downside pressure before any attempt to reclaim higher levels.
XRP’s return above the $2 mark reflects a stabilizing market structure after weeks of volatility. With a major resistance band between $2.00 and $2.10, upcoming price action will determine whether the token can build enough momentum to attempt a push toward the mid-$2 region and, eventually, the $3 tier.

XRP was trading at around 2.06, up 0.73% in the last 24 hours at press time. Source: XRP price via Brave New Coin
Technical indicators, historical context, and improving market catalysts offer a cautiously bullish backdrop—but risks remain.
For traders, monitoring volume trends, CVD, and daily closes around key resistance levels provides the clearest guidance on whether the current recovery can evolve into a sustained breakout.