The main tag of Forex News Today Articles.
You can use the search box below to find what you need.
[wd_asp id=1]

5 08, 2026

USD/JPY Price Forecast: 200-day SMA caps rebound after intervention-led selloff

By |2026-08-05T06:49:34+03:00August 5, 2026|Forex News, News|0 Comments

USD/JPY trades modestly higher on Tuesday despite a softer US Dollar (USD), as the impact of recent intervention fades and the Japanese Yen (JPY) comes under pressure again. At the time of writing, the pair trades around 157.60, recovering after briefly falling toward 155 on Monday, its lowest level since May 6.

Analysts at Societe Generale argue that a lasting recovery in the Yen will hinge on the domestic growth story rather than policy theatrics, maintaining that “what will trigger a durable yen rally will be a rise in consensus forecasts of Japanese growth, rather than more, bigger intervention, coordinated or otherwise.”

They add that “more, or faster BoJ rate hikes won’t solve the problem either, unless the Japanese growth outlook makes them appear realistic,” cautioning that “if Japanese growth remains weak, higher JGB yields will increasingly be unhelpful for the yen.”

In contrast, strategists at BBH focus on the near-term impact of recent official action, noting that “the coordinated US-Japan intervention – and officials’ warning that they stand ready to act again – significantly raises the cost of fighting a stronger yen and puts a much firmer ceiling on USD/JPY.”

From a technical perspective, the intervention-driven pullback in USD/JPY has weakened the near-term bullish structure, with the pair slipping below key moving averages.

On the daily chart, the 200-day Simple Moving Average (SMA) at 158 offers immediate resistance. Further up, the 100-day SMA at 160 guards the path toward the 50-day SMA at 161.26 and the 21-day SMA at 161.89, ahead of a more distant structural hurdle at 164.

The Relative Strength Index (RSI) at 27 signals oversold conditions, while the Moving Average Convergence Divergence (MACD) remains below zero, reflecting the recent shift in momentum to the downside.

On the downside, the 155.00 psychological mark offers immediate support. A decisive break below this level could expose the 152.50 area, with the 150.00 psychological mark emerging as the next major downside target.

(The technical analysis of this story was written with the help of an AI tool. Know more.)

Japanese Yen Price Today

The table below shows the percentage change of Japanese Yen (JPY) against listed major currencies today. Japanese Yen was the strongest against the Canadian Dollar.

USD EUR GBP JPY CAD AUD NZD CHF
USD -0.15% -0.06% 0.25% 0.18% -0.59% -0.34% -0.09%
EUR 0.15% 0.06% 0.44% 0.32% -0.45% -0.22% 0.07%
GBP 0.06% -0.06% 0.36% 0.27% -0.50% -0.27% 0.00%
JPY -0.25% -0.44% -0.36% -0.09% -0.85% -0.64% -0.24%
CAD -0.18% -0.32% -0.27% 0.09% -0.77% -0.55% -0.26%
AUD 0.59% 0.45% 0.50% 0.85% 0.77% 0.22% 0.51%
NZD 0.34% 0.22% 0.27% 0.64% 0.55% -0.22% 0.29%
CHF 0.09% -0.07% -0.01% 0.24% 0.26% -0.51% -0.29%

The heat map shows percentage changes of major currencies against each other. The base currency is picked from the left column, while the quote currency is picked from the top row. For example, if you pick the Japanese Yen from the left column and move along the horizontal line to the US Dollar, the percentage change displayed in the box will represent JPY (base)/USD (quote).


Source link

5 08, 2026

EUR/USD Forecast: Decisive Break Of 1.1600 Needed For Sustained Upside

By |2026-08-05T02:48:41+03:00August 5, 2026|Forex News, News|0 Comments


Source link

4 08, 2026

GBP/JPY Price Forecast: Bears test 200-day SMA after sharp sell-off

By |2026-08-04T22:46:29+03:00August 4, 2026|Forex News, News|0 Comments

GBP/JPY rises on Tuesday as the Japanese Yen (JPY) gives back part of its recent rally, which was driven by coordinated intervention from Tokyo and Washington.

At the time of writing, the cross trades around 211.55, up 0.20% on the day.

Yen support from US intervention seen as limited and time-buying

Analysts at MUFG/BTMU argue that the recent bout of joint FX intervention offers only partial and temporary relief for the Yen. They stress that, “on balance, we expect US intervention to support the [Y]en to remain relatively small in scale,” even if coordinated action with Japan helps steady the currency in the near term. In their view, “while joint intervention may prove more effective at helping to provide support for the [Y]en in the near-term, we still believe that it can only buy time.” MUFG/BTMU conclude that, ultimately, “there will need to be a change in fundamentals as well to encourage a sustainable reversal of the [Y]en weakening trend that has been in place over the last five years.”

Despite Tuesday’s rebound, the near-term technical picture for GBP/JPY has turned bearish. The recent sell-off pushed the cross decisively below the 100-day Simple Moving Average (SMA) for the first time since April 2025, with the pair now testing the 200-day SMA.

Technical analysis

On the daily chart, GBP/JPY trades below the 100-day Simple Moving Average (SMA) at 214.45 and hovers around the 200-day SMA at 211.75, keeping the near-term bias tilted to the downside.

The Relative Strength Index (RSI) near 30 hints at oversold conditions and the Moving Average Convergence Divergence (MACD) remains deeply negative, reinforcing selling pressure.

On the topside, initial resistance is located at the 100-day SMA at 214.45, followed by the horizontal barrier at 216.50, with a stronger cap emerging near 220.

On the downside, the 200-day SMA at 211.75 marks first support ahead of the 210 level, with deeper floors at 207 and 205, where bears could start to lose momentum if the RSI slips further into oversold territory.

(The technical analysis of this story was written with the help of an AI tool. Know more.)

Japanese Yen Price Today

The table below shows the percentage change of Japanese Yen (JPY) against listed major currencies today. Japanese Yen was the strongest against the Canadian Dollar.

USD EUR GBP JPY CAD AUD NZD CHF
USD -0.06% -0.08% 0.14% 0.10% -0.44% -0.22% -0.15%
EUR 0.06% -0.04% 0.22% 0.15% -0.41% -0.19% -0.08%
GBP 0.08% 0.04% 0.28% 0.21% -0.35% -0.13% -0.04%
JPY -0.14% -0.22% -0.28% -0.06% -0.60% -0.41% -0.19%
CAD -0.10% -0.15% -0.21% 0.06% -0.54% -0.34% -0.24%
AUD 0.44% 0.41% 0.35% 0.60% 0.54% 0.22% 0.30%
NZD 0.22% 0.19% 0.13% 0.41% 0.34% -0.22% 0.10%
CHF 0.15% 0.08% 0.04% 0.19% 0.24% -0.30% -0.10%

The heat map shows percentage changes of major currencies against each other. The base currency is picked from the left column, while the quote currency is picked from the top row. For example, if you pick the Japanese Yen from the left column and move along the horizontal line to the US Dollar, the percentage change displayed in the box will represent JPY (base)/USD (quote).

Source link

4 08, 2026

EUR/JPY Forecast 04/08: Euro Stabilizes After BoJ Action

By |2026-08-04T18:45:08+03:00August 4, 2026|Forex News, News|0 Comments

EUR/JPY is starting to bounce; now the question is whether or not we are going to continue?

EUR/JPY

The Euro has fallen a bit during the trading session here on Monday against the Japanese yen, but it has bounced a bit. We’re starting to see a little bit of a pushback from the coordinated effort between the Fed and the Bank of Japan to save the Japanese yen, basically.

Really, what we’ve got here is a situation where a lot of borrowing in Japanese yen means that a rapidly depreciating yen can cause systemic concerns. It’s really not so much about the level of the yen per se as it is the relentless selling of it. Now, this pair is a little bit different because it involves the Euro as opposed to the US dollar, which was the true concern.

The Euro itself is a currency that’s somewhat lackluster, but it is starting to see a little bit of benefit from US weakness. Now, having said that, the US numbers today were the manufacturing PMI and the ISM numbers, and they actually came out a little bit ahead, about 1.5 points. So, we’ve turned around from seeing everything miss for a couple of weeks to suddenly inflation in orders are starting to pick up.

So, what’s going to happen to the US dollar? I suspect interest rates will continue to remain high. So, converting that over here, once the market starts to push back against the Bank of Japan, you have a scenario where the Euro will possibly rise. It probably won’t rise as quickly as the US dollar because we also have to worry about inflationary pressures coming out of the Middle East.

Central Bank Interventions Focus on Slowing Trends Rather Than Reversals

The Europeans are going to have a serious problem if the Strait of Hormuz cannot get opened. The Qataris are already buying natural gas from the Americans, meaning that they are, in a roundabout way, importing LNG from the US to the EU in this winter. If that keeps up, it’s going to cause a lot of problems in the European Union, and that will show itself here in the Euro.

So, with that being said, if we can recapture the 200-day EMA, it is a potential drift higher. Right now, I think we’re in the middle of stabilizing. This is generally the pattern you see after an intervention. You get 1 or 2 really big drops, and then you get a little bit of stabilization like we’ve seen a couple of times before.

When looked at through the big picture, it’s but a blip on the radar. In general, these interventions are all about slowing down something, not changing the trend. EUR/JPY is a pair that a year and a half ago was down here near 155. We find ourselves at 180. Still very bullish, but you’re going to have to be patient. You have to enter positions slowly.

Begin trading our daily forecasts and analysis. Here is a list of Forex brokers in Japan to work with.

Christopher Lewis is a technical analyst and market commentator at DailyForex with more than two decades of trading experience in Forex and other leveraged markets. Based in Columbus, Ohio, he specializes in chart-based analysis of major currency pairs, stock indices, commodities, and energy markets, focusing on clear support and resistance levels, trend structure, and risk management. Christopher produces daily written and video analysis for traders who rely on technical setups to navigate volatile market conditions

As seen on: Pairs Of Aces Podcast,The Trader Guy, FXEmpire

Source link

4 08, 2026

GBP/USD Price Forecast: Downward-sloping trendline near 1.3470 remains key barrier

By |2026-08-04T14:44:33+03:00August 4, 2026|Forex News, News|0 Comments

The British pound (GBP) faces selling pressure against its major currency peers, trading 0.1% lower at around 1.3420 against the US Dollar (USD) during the European trading session on Tuesday.

Pound Sterling Price Today

The table below shows the percentage change of British Pound (GBP) against listed major currencies today. British Pound was the weakest against the Australian Dollar.

USD EUR GBP JPY CAD AUD NZD CHF
USD 0.03% 0.08% 0.35% 0.12% -0.22% 0.13% -0.01%
EUR -0.03% 0.03% 0.36% 0.08% -0.26% 0.08% -0.02%
GBP -0.08% -0.03% 0.32% 0.06% -0.29% 0.04% -0.06%
JPY -0.35% -0.36% -0.32% -0.25% -0.58% -0.27% -0.25%
CAD -0.12% -0.08% -0.06% 0.25% -0.33% -0.01% -0.11%
AUD 0.22% 0.26% 0.29% 0.58% 0.33% 0.33% 0.19%
NZD -0.13% -0.08% -0.04% 0.27% 0.01% -0.33% -0.09%
CHF 0.00% 0.02% 0.06% 0.25% 0.11% -0.19% 0.09%

The heat map shows percentage changes of major currencies against each other. The base currency is picked from the left column, while the quote currency is picked from the top row. For example, if you pick the British Pound from the left column and move along the horizontal line to the US Dollar, the percentage change displayed in the box will represent GBP (base)/USD (quote).

Pound struggles for support as BoE hawkish split meets dovish Bailey tone

Analysts at Rabobank highlight that “GBP net shorts bounced higher last week ahead of the BoE policy meeting,” underscoring renewed speculative pressure on the Pound. They note that, “despite a more hawkish voting split than the market had expected from the MPC, Governor Bailey’s tone was dovish,” which in their view “suggest[ed] little support for the pound from the BoE.” This combination of positioning and communication leaves Sterling lacking clear policy backing despite the ostensibly firmer stance implied by the vote split.

In BoE Bailey’s last week’s press conference, he said, “Please do not leave this room thinking that the Bank of England is edging towards a hike, because frankly, there’s nothing in what I said, and I think any of us have said, along those lines,” Reuters reported.

The selling pressure in the GBP/USD pair is also driven by the higher US Dollar. As of writing, the US Dollar Index (DXY), which gauges the Greenback’s value against six major currencies, trades slightly higher to near 100.05. The USD Index recovered sharply on Monday after posting a fresh two-week high at 99.42.

The Greenback extends Monday’s recovery further as investors turn cautious ahead of key United States (US) economic releases.

Investors will pay close attention to the US Nonfarm Payrolls (NFP) data for July on Friday to get fresh cues regarding the Federal Reserve’s (Fed) monetary policy. Fed’s new policy “say no to so-called forward-guidance” has increased investors’ dependency on economic releases to project the Fed’s next policy move.

Later in the day, investors will focus on the US JOLTS Job Openings data for June, which will be published at 14:00 GMT. The data is expected to arrive at 7.45 million fresh jobs, slightly lower than 7.594 million in May.

GBP/USD technical analysis

GBP/USD trades slightly lower at around 1.3423, but is holding above the 20-day exponential moving average (EMA) at 1.3389 and retaining a mildly bullish near-term bias. The pair has reclaimed short-term trend support, while the downward resistance trend line, with a key break reference at 1.3473, now caps the topside.

The Relative Strength Index (RSI) at roughly 54 leans constructive without signaling overbought conditions, suggesting scope for further gains while acknowledging nearby overhead supply.

On the topside, immediate resistance is seen at the trend-line break area near 1.3473, ahead of the psychological level at 13500. On the downside, initial support is provided by the 20-day EMA at 1.3389, which should act as a cushion on pullbacks; a daily close back below this level would weaken the current bullish tone and expose it to the July 28 low at 1.3274.

(The technical analysis of this story was written with the help of an AI tool. Know more.)

Pound Sterling FAQs

The Pound Sterling (GBP) is the oldest currency in the world (886 AD) and the official currency of the United Kingdom. It is the fourth most traded unit for foreign exchange (FX) in the world, accounting for 12% of all transactions, averaging $630 billion a day, according to 2022 data.
Its key trading pairs are GBP/USD, also known as ‘Cable’, which accounts for 11% of FX, GBP/JPY, or the ‘Dragon’ as it is known by traders (3%), and EUR/GBP (2%). The Pound Sterling is issued by the Bank of England (BoE).

The single most important factor influencing the value of the Pound Sterling is monetary policy decided by the Bank of England. The BoE bases its decisions on whether it has achieved its primary goal of “price stability” – a steady inflation rate of around 2%. Its primary tool for achieving this is the adjustment of interest rates.
When inflation is too high, the BoE will try to rein it in by raising interest rates, making it more expensive for people and businesses to access credit. This is generally positive for GBP, as higher interest rates make the UK a more attractive place for global investors to park their money.
When inflation falls too low it is a sign economic growth is slowing. In this scenario, the BoE will consider lowering interest rates to cheapen credit so businesses will borrow more to invest in growth-generating projects.

Data releases gauge the health of the economy and can impact the value of the Pound Sterling. Indicators such as GDP, Manufacturing and Services PMIs, and employment can all influence the direction of the GBP.
A strong economy is good for Sterling. Not only does it attract more foreign investment but it may encourage the BoE to put up interest rates, which will directly strengthen GBP. Otherwise, if economic data is weak, the Pound Sterling is likely to fall.

Another significant data release for the Pound Sterling is the Trade Balance. This indicator measures the difference between what a country earns from its exports and what it spends on imports over a given period.
If a country produces highly sought-after exports, its currency will benefit purely from the extra demand created from foreign buyers seeking to purchase these goods. Therefore, a positive net Trade Balance strengthens a currency and vice versa for a negative balance.

Source link

4 08, 2026

USD/JPY Forecast: Dollar Gains Respite, But 160.00 Holds As Key Hurdle

By |2026-08-04T10:43:24+03:00August 4, 2026|Forex News, News|0 Comments


Source link

4 08, 2026

Bank Of America Euro To Dollar Forecast: EUR/USD At 1.12 Before Year-End Recovery

By |2026-08-04T06:42:23+03:00August 4, 2026|Forex News, News|0 Comments

The euro’s recovery against the dollar has strengthened, but Bank of America still sees scope for a near-term pullback.

The Euro to US Dollar exchange rate (EUR/USD) slipped to around 1.1504 on Monday after opening near 1.1548, leaving the pair at the bottom of its intraday range.

Today's EUR/USD intraday chart
Image: Today’s EUR/USD intraday chart

EUR/USD ended July around 1.1530, having recovered from a monthly low near 1.1354.

The pair remains 1.7% lower for 2026, with this year’s trading range extending from 1.1325 to 1.2075.

The Euro-to-Dollar exchange rate - historical year-to-date chart for 2026
Image: The Euro-to-Dollar exchange rate – historical year-to-date chart for 2026

Bank of America says the July Fed press conference “injected uncertainty around the Fed’s inflation-fighting commitment and reaction function”.

The bank described the meeting as “doved and confused”, with Chair Kevin Warsh suggesting that financial markets had already delivered some of the tightening that might otherwise have required higher rates.

BofA said this was “not reassuring”, adding that the Dollar should respond differently to “a central bank credibly doing the tightening” than one which “outsources the tightening to the market”.

That credibility concern has shifted the near-term risk balance against the Dollar. However, BofA still sees support from resilient US economic conditions, artificial-intelligence investment and geopolitical uncertainty.

The bank also believes the Fed may ultimately need to respond more forcefully.

“Ironically, we think the need to re-establish credibility increases the probability that the Fed will hike in September,” BofA said.

Its economists continue to forecast three 25-basis-point increases over the remaining meetings of 2026.

BofA forecasts EUR/USD at 1.12 in September, 1.15 at year-end and 1.20 by the end of 2027.

The Euro’s technical recovery has improved after the late-July surge, but 1.1500 remains the immediate test.

A sustained hold above it would keep 1.1555 and 1.1600 in view, while a renewed break lower would expose 1.1450 and the 1.1370 area.

Exchange Rates UK Research

Our currency coverage draws on live market data, official economic releases and published bank research.

Source link

4 08, 2026

USD to YEN Forecast: Rare US Intervention Sends Pair to 155; Will It Fall Further?

By |2026-08-04T02:41:21+03:00August 4, 2026|Forex News, News|0 Comments

TradingKey – As of the European session on August 3, the US dollar against the Japanese yen ( USD/JPY) was trading near 156.70, having briefly plummeted to 155.20 intraday before paring some of its losses. Last week, USD/JPY neared 164.00, hitting a roughly 40-year high, but the exchange rate has fallen for four consecutive trading sessions as Japan and the US successively bought yen.

Why the Dollar Is Falling Against the Yen?

The direct cause of the current decline in USD/JPY is the joint foreign exchange intervention by the US and Japan. Japan’s Ministry of Finance confirmed that after Japan bought yen in the New York market last week, the US Treasury Department also participated in buying yen through the New York Fed to curb the currency’s recent excessive volatility and disorderly depreciation. This is the first joint intervention by the US and Japan since 1998, releasing a policy signal far stronger than unilateral intervention by Japan.

Japanese Finance Minister Satsuki Katayama stated that if the yen experiences sharp volatility again, Japan and the US will not hesitate to take further joint action. US Treasury Secretary Bessent also indicated that Washington is prepared to repeat intervention if necessary. Because the market cannot accurately predict the timing and scale of the authorities’ next entry, some investors who previously bet on the continuous depreciation of the yen began to unwind their positions, driving USD/JPY down rapidly from above 163 to near 155.

The direct participation of the US in this intervention has also changed the market’s assessment of the yen. In the past, unilateral yen purchases by Japan usually only triggered a short-term rally because the wide US-Japan interest rate gap meant investors still preferred to borrow low-yield yen to buy dollar assets. However, the US’s participation implies that the yen’s depreciation is no longer merely a domestic issue for Japan, but is instead seen as a risk that could affect global financial stability and the US Treasury market.

Japan holds a massive amount of US Treasuries. If Japan were to sell off US Treasuries in a concentrated manner to raise intervention funds, it could push up US Treasury yields and increase borrowing costs for the US government. Direct yen purchases by the US Treasury, or utilizing the New York Fed to provide dollar liquidity, can reduce Japan’s need to conduct large-scale sales of US Treasuries, which is likely one of the key reasons why the US is willing to participate in the intervention.

The Bank of Japan’s policy stance has also begun to provide support for the yen. While the BOJ kept its policy rate unchanged at 1% at its July meeting, it stated in its economic outlook that it will continue to raise rates in the future as underlying inflation gradually approaches 2%. BOJ Governor Kazuo Ueda also noted that if upside risks to inflation expand, the central bank will discuss whether faster action is needed. The combination of the joint intervention and the BOJ keeping the door open to rate hikes has further weakened the upward momentum of USD/JPY.

Can the Yen Continue to Appreciate?

Whether the yen can sustain its appreciation remains uncertain. U.S. interest rates are still significantly higher than Japan’s, and with low yen financing costs, the foundation for the carry trade has not fully disappeared. Meanwhile, Japan’s expansionary fiscal policy could increase government debt and inflationary pressures, which would also limit the yen’s long-term appreciation potential.

ING believes that if expectations for Fed rate hikes do not cool significantly and the Bank of Japan does not tighten policy further, USD/JPY could still climb back above 160.

USD TO YEN Technical Analysis

USD/JPY Daily Chart, Source: TradingView

According to the USD/JPY daily chart, the pair previously approached the 164.00 level before falling rapidly, breaking below two key levels of 160.00 and 158.00 in quick succession, indicating that short-term market sentiment has shifted to the bearish side. Following joint intervention by the U.S. and Japan, bearish momentum has significantly strengthened. However, the exchange rate quickly rebounded from near 155.20 to around 157.00, suggesting some support remains near the 155.00 level.

On the downside, initial support for the pair is located near the 155.00 level. A break below this level could lead to further declines toward 152.00, with a potential test of the key 150.00 level.

On the upside, immediate resistance sits near the 158.00 level. If the pair breaks and holds above this point, further room for a rebound would open up, potentially testing the 160.00 level. However, with both the U.S. and Japan clearly indicating that further interventions remain on the table, levels above 160 will face stronger policy pressure. Only a decisive break and consolidation above 160 would allow USD/JPY to challenge the 162 to 164 range once again.

This content was translated using AI and reviewed for clarity. It is for informational purposes only.

Disclaimer: The content of this article solely represents the author’s personal opinions and does not reflect the official stance of Tradingkey. It should not be considered as investment advice. The article is intended for reference purposes only, and readers should not base any investment decisions solely on its content. Tradingkey bears no responsibility for any trading outcomes resulting from reliance on this article. Furthermore, Tradingkey cannot guarantee the accuracy of the article’s content. Before making any investment decisions, it is advisable to consult an independent financial advisor to fully understand the associated risks.


Source link

3 08, 2026

GBP/USD Analysis: Pound holds firm after BoE decision

By |2026-08-03T22:40:22+03:00August 3, 2026|Forex News, News|0 Comments

The pound sterling has started to show relevant strength against the U.S. dollar. At the moment, GBP/USD has gained slightly more than 1.3% in the short term, reflecting an important buying bias.

Buying pressure began to gain relevance after the Federal Reserve decision during yesterday’s session and strengthened even further after the Bank of England decision today. For now, the central bank dynamic could continue to be key for demand in the pound sterling and maintain possible buying pressure on GBP/USD over the next few trading sessions.

Fed and BoE signals shape the outlook

During today’s session, the Bank of England published its interest rate decision and kept the reference rate at 3.75%, in line with expectations. However, the vote delivered an important signal: 6 members voted to keep rates unchanged, while 3 members voted for a 0.25% hike.

Although the rate did not change, this division was interpreted as a slightly more aggressive signal, as it shows that an important part of the committee is starting to consider the need for further increases over the coming months.

In the statement after the decision, the central bank highlighted that energy prices remain volatile and that this factor could continue to pressure inflation. For this reason, although additional hikes were not confirmed, the BoE does not appear ready to ease its stance either. If annual inflation fails to move closer to the 2.00% target, the central bank could continue to consider a more restrictive monetary policy.

The dynamic in the United States was slightly different. Although the Federal Reserve also kept rates unchanged in the 3.50% – 3.75% range, Kevin Warsh’s comments after the decision did not offer a clear signal of a possible hike in September.

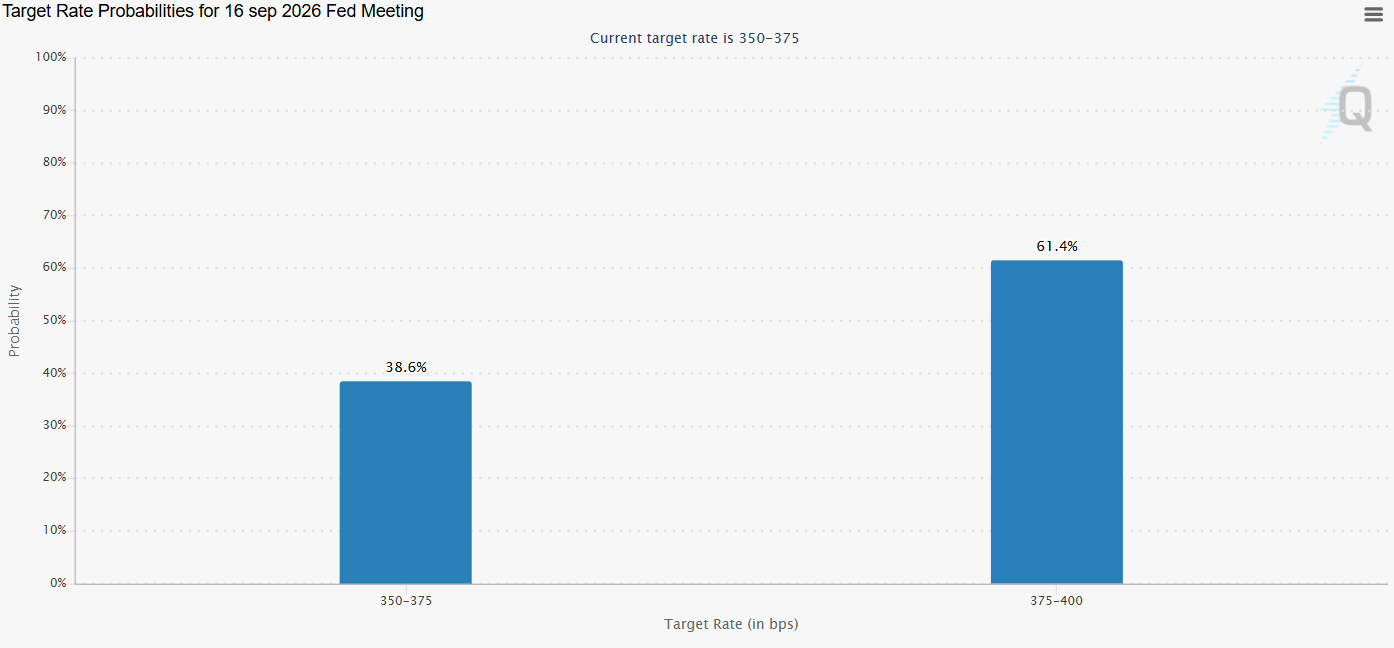
This difference is important because the market expected a more aggressive stance from the Fed, but the event did not confirm that expectation. According to the CME Group probability table, for the September 16 decision, there is still a probability near 61% of a rate hike in the United States. However, a probability of almost 40% that rates remain unchanged has also started to emerge, something that had not been observed with the same strength in previous weeks.

Source: CMEGROUP

As a result, the market is facing an interesting dynamic. In the United States, expectations of a more aggressive Fed have lost strength, while in the United Kingdom, the BoE showed internal division that keeps open the possibility of a more restrictive stance if inflation remains a problem.

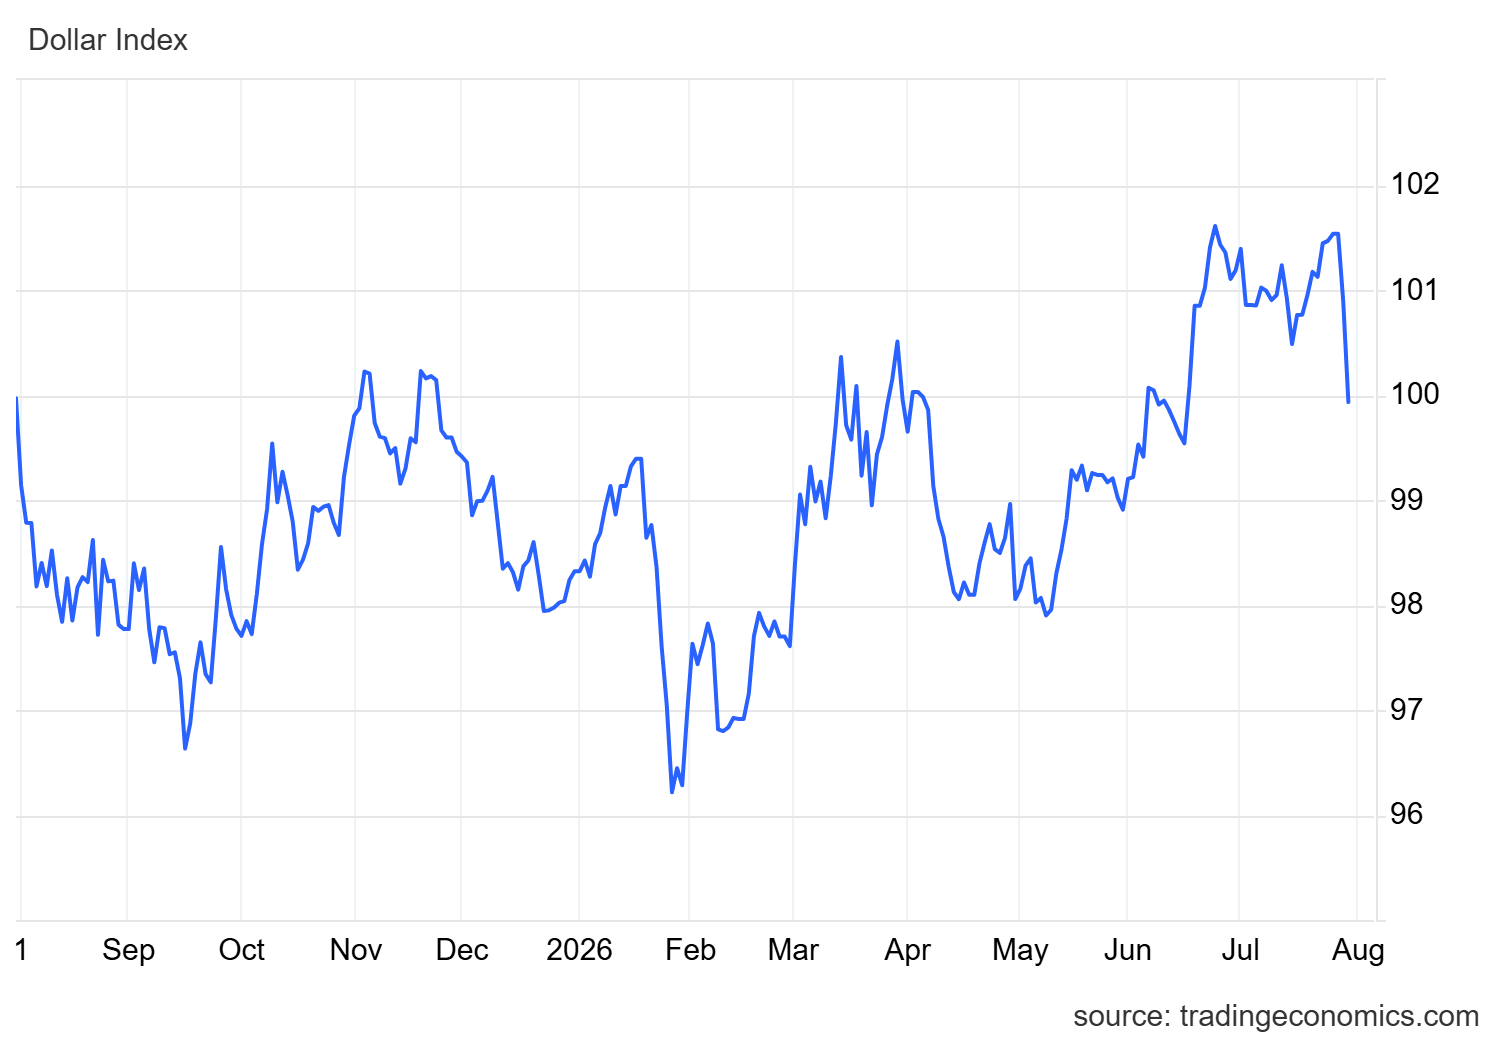
This contrast has started to be reflected in the U.S. dollar. The DXY index, which measures the dollar’s strength against its main peers, has shown a relevant decline since the Federal Reserve announcement and is now below the 100-point area. This suggests that demand for the dollar has started to weaken significantly after the U.S. central bank decision.

Source: TradingEconomics

With this in mind, and considering that both the United States and the United Kingdom maintain rates near 3.75%, the main difference lies in each central bank’s message. While the market is starting to price in a Bank of England that appears more willing to act if necessary, the Federal Reserve has reduced signals of early rate increases.

This dynamic could continue to weigh on the dollar and open room for the pound sterling to recover more consistently. If this scenario remains in place, GBP/USD could continue to show buying pressure over the next few trading sessions.


Technical forecast for GBP/USD

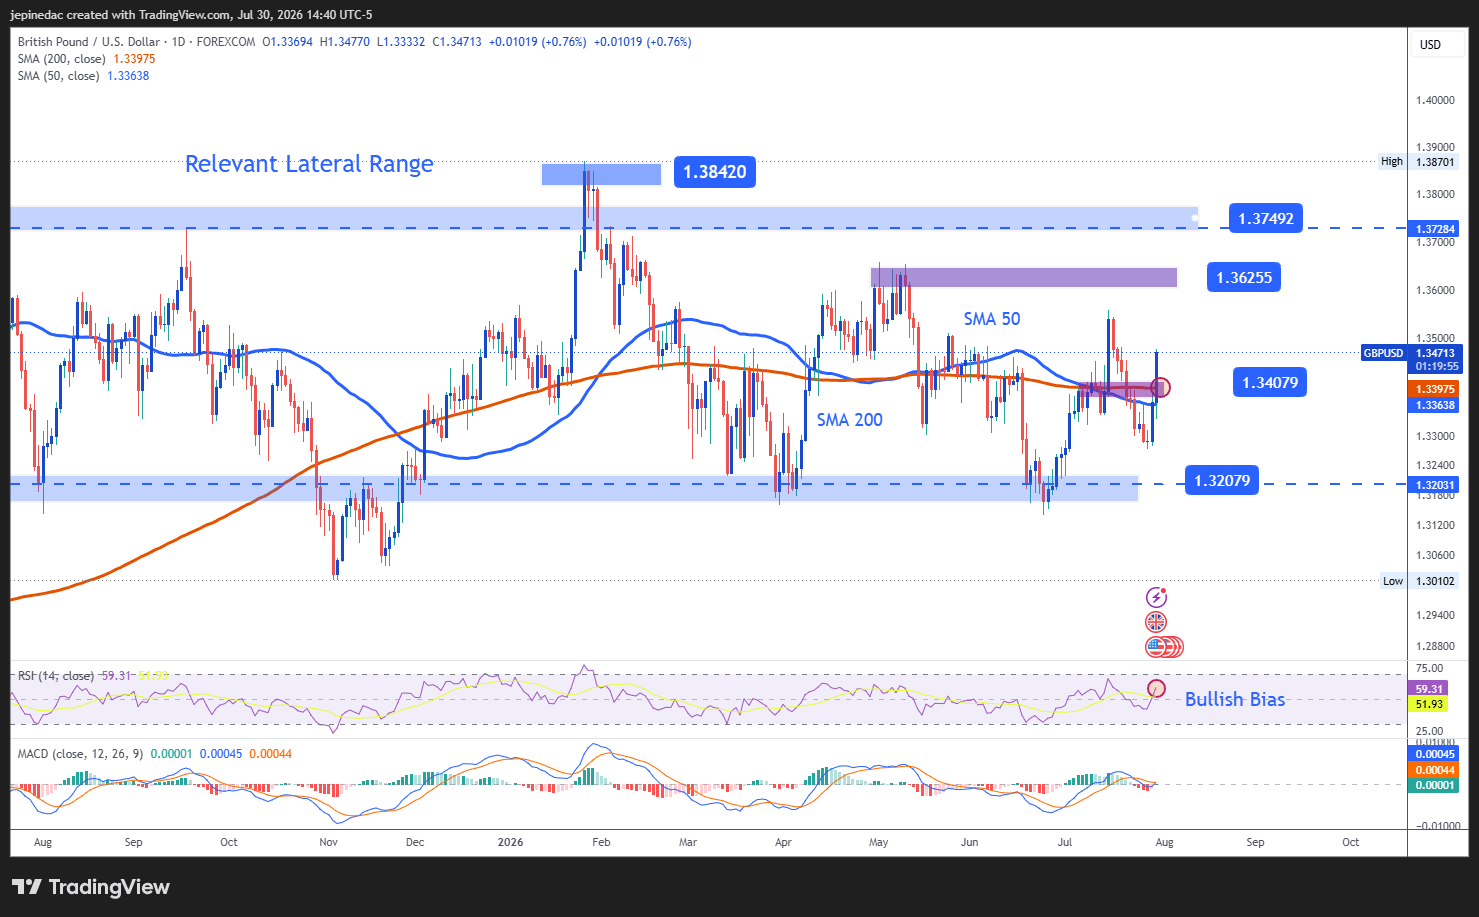
Source: StoneX, Tradingview

  • The broad sideways range continues to dominate: Despite GBP/USD’s recovery attempts, the chart continues to show a broad sideways channel that has acted as the main technical structure for several months. This range remains between an upper area near 1.37492 and support around 1.32079. If price fails to break consistently out of these levels, the sideways structure will remain the most relevant pattern and could continue to reflect indecision over the coming trading weeks.
     
  • RSI: Now, the RSI remains above the neutral 50 level, suggesting that bullish impulses have started to gain relevance in the short term. If this dynamic continues, the indicator could keep supporting the formation of a more important buying bias over the next few sessions.
     
  • MACD: The MACD shows a histogram near the neutral 0 area, suggesting balance in the strength of short-term moving averages. This reading indicates that, although the pound has gained strength, the indecision bias has not completely disappeared from the GBP/USD chart.
     

Key levels:

  • 1.36255 – Relevant resistance: This relevant high is positioned as the main bullish barrier in the short term. Price movements toward this area could reinforce the current buying pressure and open room for a more consistent bullish bias over the next few sessions. In addition, a clear break above this level could start to put at risk the broad sideways range that has remained in place for several months.
     
  • 1.34079 – Near-term barrier: This recent neutral area coincides with the 50- and 200-period simple moving averages. If price moves back toward this level consistently, it could once again highlight a phase of indecision and keep the sideways range as the dominant technical structure.
     
  • 1.32079 – Crucial support: This low coincides with the lower barrier of the broad sideways range. Sustained moves below this point could reflect a dominant selling bias and open room for the formation of a short-term bearish trend line over the coming trading weeks.
     

Written by Julian Pineda, CFA, CMT – Market Analyst

Follow him on: @julianpineda25


Source link

3 08, 2026

US, Japan, and South Korea Join Forces to Support Yen. Forecast as of 03.08.2026

By |2026-08-03T18:39:20+03:00August 3, 2026|Forex News, News|0 Comments

Over the past few weeks, the USD/JPY pair has been trading amid concerns about potential currency interventions. Eventually, the Forex market saw them happen. The coordinated intervention was meant to further temper speculators. Let’s discuss this topic and develop a trading plan.

The article covers the following subjects:

Major Takeaways

  • The yen was supported by a coordinated intervention.
  • The Bank of Japan’s sluggish response is helping the USD/JPY.
  • The US does not want to allow Treasury yields to rise.
  • Long positions can be considered as long as the USD/JPY remains above 156.

Weekly Fundamental Forecast for Yen

The first coordinated currency intervention since 1998 aimed at supporting the yen has raised many questions. Is Japan truly so vulnerable that it cannot counter USD/JPY bulls on its own? Why would the US support such an effort? Which other countries, if any, were involved? Finally, why did the euro become a target for selling pressure rather than the US dollar alone?

According to Bloomberg, around $53 billion was deployed on the first day of intervention. Since September 2022, Japan has spent approximately $255 billion on currency interventions. With foreign exchange reserves exceeding $1 trillion, Tokyo theoretically had sufficient resources to act independently. However, a significant portion of those reserves is invested in US Treasury securities. Selling these assets aggressively would push Treasury yields higher—an outcome that does not align with US policy objectives.

US and Japanese Bond Yields

Source: Bloomberg.

According to Mizuho Bank, it was precisely the Ministry of Finance—led by Scott Bessent—that did not want volatility in Japan’s debt market to continue negatively affecting the US debt market, and this was the main reason for US participation in the coordinated intervention.

Why was the euro chosen as the target? The answer may be simpler than attempts to link it to the concept of a strong dollar. According to JPMorgan, the US Treasury’s Exchange Stabilization Fund held assets of approximately $13 billion and €25 billion. While this amount alone would clearly be insufficient for a large-scale intervention, the combined resources of Japan and a potential third participant could have provided a more substantial firepower. Against this backdrop, the FX market speculates that South Korea may also have taken part in the coordinated currency intervention.

Speculative Positions on Japanese Yen

Source: Bloomberg.

Notably, the timing was perfect. Speculators had pushed net short positions in the yen to their highest levels since 2024, while hedge funds’ short positions had soared to their highest level since 2007. Confusion over whether Kevin Warsh wants to raise rates or will wait until the last minute caused investors to flee the US dollar.

The key question is whether the current USD/JPY exchange rate is fundamentally justified. Based on the yield spread between US and Japanese government bonds, the pair appears to have moved closer to levels supported by market fundamentals. However, currency markets are also pricing in expectations for future Fed and Bank of Japan interest-rate policies. This is where Tokyo’s cautious approach could become a vulnerability—potentially leading to the pattern seen after the interventions in April and May. In that scenario, the dollar could resume its advance.

Market Expectations for Fed and BOJ Interest Rates

Source: Bloomberg.

Weekly USDJPY Trading Plan

The joint intervention managed to scare speculators but hardly discouraged traders from attempting to recover their losses. In currency markets, every victory comes with the possibility of a setback. The strategy of selling USD/JPY from 163.35 proved highly effective. However, the Bank of Japan’s slow response and the renewed activity of carry traders create conditions for taking profits and considering long positions—at least while the pair remains above ¥156.


This forecast is based on the analysis of fundamental factors, including official statements from financial institutions and regulators, various geopolitical and economic developments, and statistical data. Historical market data are also considered.

Price chart of USDJPY in real time mode

The content of this article reflects the author’s opinion and does not necessarily reflect the official position of LiteFinance broker. The material published on this page is provided for informational purposes only and should not be considered as the provision of investment advice for the purposes of Directive 2014/65/EU.


According to copyright law, this article is considered intellectual property, which includes a prohibition on copying and distributing it without consent.

Rate this article:

{{value}} ( {{count}} {{title}} )


Source link

Go to Top