The main tag of Forex News Today Articles.
You can use the search box below to find what you need.
[wd_asp id=1]

19 04, 2026

Japanese Yen Forecast: USD/JPY Consolidation Masks Rising Intervention Risks

By |2026-04-19T22:05:04+02:00April 19, 2026|Forex News, News|0 Comments

Japanese Yen, USD/JPY Key Points

  • Ongoing yen weakness has prompted aggressive verbal intervention from Japan’s Finance Ministry.
  • Back in January, coordinated “price checks” between the US and Japan led to a 2100-pip drop in USD/JPY over 10 trading days.
  • Other yen crosses are at even more extreme levels, with GBP/JPY at 18-year highs and EUR/JPY testing 43-year highs.

With headlines out of the Middle East seemingly trending in the right direction (for today at least!), traders are refocusing on more traditional market drivers like economic data and policy decisions.

On the former front, the US reported another solid reading on initial unemployment claims this morning, showing just 207K new Americans claiming unemployment benefits last week, below the 213K expected by markets, bringing the 4-week moving average to an historically low 210K. On the back of this report, the US dollar is the second strongest major currency on the day.

Arguably the most important (non-Iran) headline of the week so far comes from the policy side, where Japan’s Finance Minister Satsuki Katayama has upped her “verbal intervention” in recent days. In today’s Asian session, she noted that authorities are “closely watching” FX moves, that the recent round of yen weakness is “affecting livelihoods” of Japanese citizens, that she plans to “further intensify” communication with US Treasury Secretary Bessent and is prepared to take “bold action” if necessary.

For readers not used to reading between the lines of policymaker comments, it’s clear that Japan’s Finance Ministry is growing increasingly uncomfortable with the yen’s ongoing weakness, raising the odds of outright intervention in the forex market to support the yen.

Traders will recall a similar situation in January, where Katayama and Bessent worked together to conduct price checks in the market, the final step before outright intervention, which led to a near-term bottom in the yen, though it’s now weakened beyond that point. Because the current US Administration is loathe to see continued strength in the greenback, continued coordination across the Pacific on this situation makes sense.

As we head into the weekend, readers should be aware of the risk of a similar situation playing out, especially if USD/JPY rallies above the psychologically-significant 160 level.

Japanese Yen Technical Analysis: USD/JPY Daily Chart


image-20260416131609-1

Source: Tradingview, StoneX

Technically speaking, the recent consolidation in USD/JPY masks the broader yen weakness that we’re seeing in other crosses. As the chart above shows, both GBP/JPY and EUR/JPY have seen larger rallies so far this month, taking those pairs to 18-year and 43-year (!!) highs respectively.

If USD/JPY plays catch-up with those crosses (potentially on the back of another delay in US-Iran peace talks over the weekend), Japanese authorities may feel compelled to intervene, likely leading to a large downside move in yen crosses. To put some numbers around it, January’s price checks kicked off a 2100-pip drop in USD/JPY over the next 10 days, and that fell short of direct intervention.

For traders, the takeaway is clear: While the current fundamental and technical setup favors continued strength in USD/JPY and other yen crosses, the risk of a sharp downside reversal is rising, especially if USD/JPY breaks above the 160.00 level heading into the weekend.

— Written by Matt Weller, Global Head of Research

Check out Matt’s Daily Market Update videos on YouTube and be sure to follow Matt on Twitter: @MWellerFX


Source link

19 04, 2026

EUR/JPY Price Forecast: Surges to Stunning Record Highs Near 188.00

By |2026-04-19T06:00:44+02:00April 19, 2026|Forex News, News|0 Comments

BitcoinWorld

EUR/JPY Price Forecast: Surges to Stunning Record Highs Near 188.00

The EUR/JPY currency pair has achieved a significant milestone, reaching fresh record highs near the 188.00 level in recent trading sessions. This remarkable movement represents the highest exchange rate ever recorded between the Euro and Japanese Yen, marking a pivotal moment for forex traders and global financial markets. The sustained upward trajectory reflects complex interactions between European and Japanese monetary policies, economic data releases, and shifting global risk sentiment. Market analysts now closely monitor whether this breakthrough represents a temporary peak or the beginning of a new trading paradigm for this influential currency cross.

EUR/JPY Price Forecast Technical Analysis

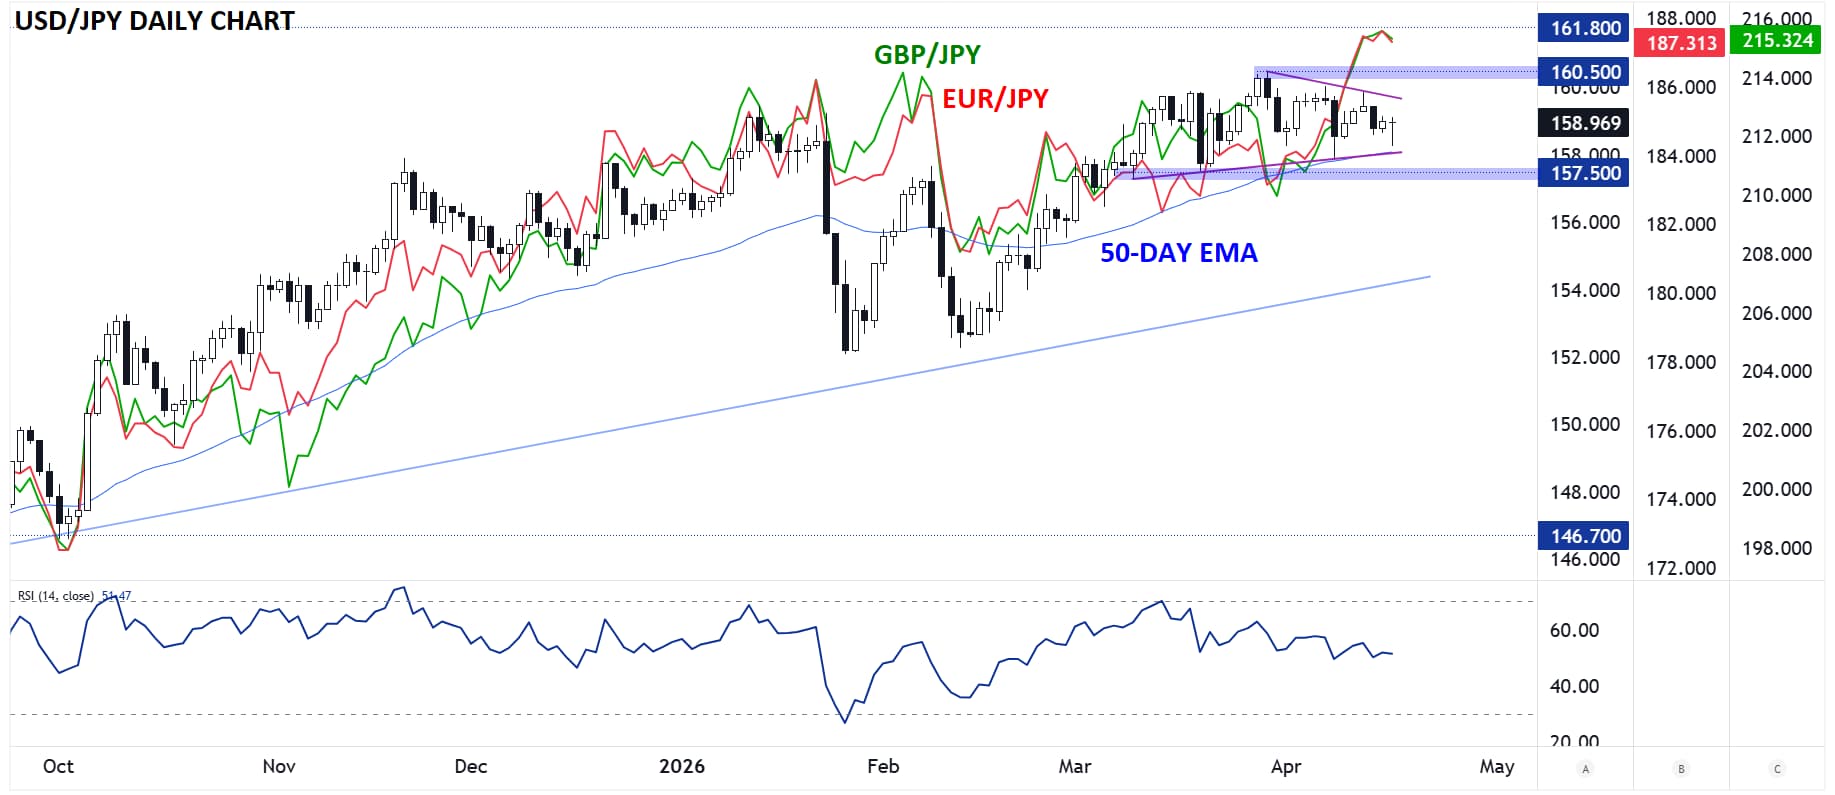
Technical charts reveal compelling patterns behind the EUR/JPY’s ascent to record territory. The currency pair has demonstrated consistent bullish momentum throughout recent months, breaking through multiple historical resistance levels with surprising ease. Furthermore, moving average convergence divergence indicators show strong positive alignment across various timeframes. The 50-day and 200-day simple moving averages maintain a widening bullish spread, typically signaling sustained upward pressure. Additionally, relative strength index readings approach overbought territory but show no immediate divergence patterns that would suggest imminent reversal. Volume analysis confirms institutional participation in the rally, with higher trading volumes accompanying upward movements than during consolidation periods.

Several key technical levels now define the EUR/JPY landscape. The immediate support zone rests between 186.50 and 187.00, where previous resistance has transformed into support through classic technical principle. Meanwhile, psychological resistance emerges at the round number of 190.00, though no historical precedent exists at these elevated levels. Fibonacci extension tools, when applied to the most recent major swing, project potential targets between 189.50 and 191.50 if current momentum persists. However, traders remain cautious about potential profit-taking episodes given the extended nature of the current rally. Bollinger Band analysis shows the pair trading near the upper band boundary, suggesting elevated volatility may accompany further advances.

Fundamental Drivers Behind Record Highs

Multiple fundamental factors converge to propel the EUR/JPY to unprecedented levels. The European Central Bank maintains a comparatively hawkish monetary policy stance relative to the Bank of Japan. While the ECB has signaled potential rate cuts, its timeline remains measured against persistent inflation concerns in the Eurozone. Conversely, the Bank of Japan continues its ultra-accommodative policy framework despite recent minor adjustments. This policy divergence creates substantial interest rate differentials that favor Euro holdings over Yen-denominated assets. Moreover, Japan’s Ministry of Finance has demonstrated limited appetite for aggressive currency intervention despite the Yen’s broad weakness.

Economic performance metrics further explain the EUR/JPY dynamics. Eurozone economic data, particularly from Germany and France, shows signs of stabilization after previous contractionary periods. Industrial production figures and business confidence surveys have exceeded expectations in recent releases. Meanwhile, Japan’s economic recovery faces structural challenges including demographic pressures and persistent deflationary psychology. Trade balance statistics reveal Japan’s increasing import costs, partially driven by Yen depreciation, which ironically creates additional downward pressure on the currency. Global capital flows increasingly favor European assets as investors seek yield in a low-interest-rate environment, further supporting Euro demand.

Central Bank Policy Divergence Analysis

Monetary policy trajectories provide crucial context for the EUR/JPY forecast. The European Central Bank faces complex balancing between inflation control and economic support. Recent ECB communications emphasize data-dependent approaches to future policy adjustments. Market participants generally anticipate gradual rather than aggressive easing cycles from Frankfurt. Meanwhile, the Bank of Japan navigates unprecedented territory as it attempts to normalize policy without disrupting fragile economic recovery. Governor Kazuo Ueda’s statements consistently emphasize patience and gradual adjustment, maintaining negative interest rates while allowing greater yield curve flexibility. This policy asymmetry directly translates to currency valuation effects, with capital naturally flowing toward higher-yielding Euro-denominated instruments.

Key Economic Indicators Comparison: Eurozone vs Japan

Indicator Eurozone Japan
Central Bank Policy Rate 3.50% -0.10%
10-Year Government Bond Yield 2.40% 0.70%
Latest CPI Inflation 2.60% 2.20%
GDP Growth Forecast 2025 0.80% 0.50%
Trade Balance €25B Surplus ¥-900B Deficit

Market Implications and Trading Considerations

The EUR/JPY’s record highs carry significant implications across financial markets. Currency traders face both opportunity and risk at these unprecedented levels. Position sizing requires particular caution given reduced historical precedent for price action near 188.00. Many trading algorithms lack extensive backtest data for these valuation ranges, potentially increasing volatility during market stress events. Additionally, multinational corporations with Euro-Japan exposure must reassess hedging strategies and budget assumptions. Japanese exporters benefit from competitive advantages when converting Euro revenues to Yen, while European importers face rising costs for Japanese goods and components.

Several risk factors warrant careful monitoring in the EUR/JPY forecast. First, unexpected Bank of Japan policy shifts could trigger rapid Yen appreciation, potentially creating sharp reversals. Second, geopolitical developments affecting either economic region might disrupt current trends. Third, technical indicators suggest the pair approaches overextended territory, increasing vulnerability to correction. Fourth, changes in global risk sentiment could alter capital flow patterns between these currencies. Fifth, differential economic data surprises could recalibrate growth expectations and monetary policy projections. Prudent risk management therefore becomes increasingly crucial at these elevated valuation levels.

  • Carry Trade Dynamics: The substantial interest rate differential supports ongoing carry trade positions favoring Euro longs against Yen shorts.
  • Volatility Expectations: Options pricing indicates elevated anticipated volatility, reflecting uncertainty at record levels.
  • Correlation Patterns: EUR/JPY maintains strong positive correlation with global equity indices during risk-on periods.
  • Liquidity Conditions: Trading volume remains robust, though some participants report reduced liquidity during Asian session overlaps.

Historical Context and Pattern Analysis

The current EUR/JPY movement represents the culmination of a multi-year trend rather than an isolated event. Since the European debt crisis resolution and subsequent Japanese monetary expansion programs, the currency pair has generally trended upward with periodic corrections. The breakthrough above previous record highs near 165.00 in early 2024 established the current bullish phase. Each successive resistance level has surrendered with decreasing consolidation periods, suggesting accelerating momentum. Historical volatility analysis reveals that while absolute price movements have increased, volatility relative to price has actually decreased, indicating maturing market acceptance of higher valuation ranges.

Comparative analysis with other Yen crosses provides additional perspective. The USD/JPY has similarly reached multi-decade highs, confirming broad Yen weakness rather than isolated Euro strength. However, EUR/JPY outperformance relative to USD/JPY suggests additional Euro-specific factors at play. The correlation between EUR/JPY and global commodity prices, particularly energy, has strengthened recently given Europe’s import dependency and Japan’s resource constraints. This relationship introduces additional complexity to forecasting exercises, requiring integrated analysis across asset classes rather than isolated currency examination.

Expert Perspectives on Sustainability

Financial institution research departments offer varied assessments of the EUR/JPY forecast. Major European banks generally emphasize structural factors supporting continued Euro resilience, citing improving current account balances and reduced political fragmentation risks. Japanese financial analysts frequently highlight potential policy normalization catalysts that could reverse Yen weakness. Independent research firms note that positioning data shows substantial speculative long Euro positions, creating vulnerability to rapid unwinding during sentiment shifts. Academic economists point to fundamental valuation models that suggest increasing divergence from purchasing power parity estimates, though such divergences can persist for extended periods in currency markets.

Conclusion

The EUR/JPY price forecast remains decidedly bullish as the currency pair establishes fresh record highs near 188.00. Technical charts show strong momentum with limited immediate reversal signals, while fundamental drivers centered on policy divergence continue to support Euro appreciation against the Yen. However, traders must acknowledge increasing risks at these unprecedented valuation levels, including potential policy shifts, technical corrections, and changing global risk dynamics. The EUR/JPY forecast ultimately depends on the evolving balance between European economic resilience and Japan’s monetary policy normalization timeline. Market participants should maintain flexible frameworks that account for both continuation patterns and potential inflection points in this historically significant currency movement.

FAQs

Q1: What does EUR/JPY reaching 188.00 mean for forex traders?
The EUR/JPY at 188.00 represents unprecedented territory, requiring adjusted technical analysis approaches since historical resistance levels don’t exist. Traders must rely more on momentum indicators, Fibonacci extensions, and fundamental drivers while implementing strict risk management due to increased uncertainty at record highs.

Q2: Why is the Euro strengthening against the Yen?
The Euro strengthens against the Yen primarily due to monetary policy divergence between the European Central Bank and Bank of Japan. The ECB maintains higher interest rates while the BOJ continues ultra-accommodative policies. Additionally, improving Eurozone economic data and persistent Japanese trade deficits contribute to the trend.

Q3: How does EUR/JPY affect international businesses?
Japanese exporters benefit significantly as Euro revenues convert to more Yen, boosting profitability. European importers of Japanese goods face higher costs. Multinational corporations must adjust hedging strategies, budget assumptions, and supply chain decisions based on these sustained exchange rate movements.

Q4: Could the Bank of Japan intervene to weaken EUR/JPY?
While possible, direct intervention appears unlikely at current levels. The Ministry of Finance typically intervenes during disorderly movements rather than against sustained trends. Recent statements suggest tolerance for gradual Yen weakness, focusing instead on excessive volatility that might disrupt economic stability.

Q5: What technical levels should traders watch now?
Immediate support rests between 186.50-187.00 where previous resistance transformed to support. Psychological resistance awaits at 190.00. Fibonacci extension targets suggest 189.50-191.50 if momentum continues. Traders should monitor RSI divergence and moving average crosses for potential trend exhaustion signals.

This post EUR/JPY Price Forecast: Surges to Stunning Record Highs Near 188.00 first appeared on BitcoinWorld.

Source link

19 04, 2026

USD/JPY Price Forecast: Soars to Mid-159.00s Yet Remains Trapped in Familiar Range

By |2026-04-19T01:59:11+02:00April 19, 2026|Forex News, News|0 Comments

BitcoinWorld

USD/JPY Price Forecast: Soars to Mid-159.00s Yet Remains Trapped in Familiar Range

The USD/JPY currency pair has climbed decisively to the mid-159.00s, marking a significant level for forex traders globally. However, this ascent occurs within a well-defined and familiar trading range that has characterized the pair’s movement for weeks. Market participants now closely monitor whether this represents a genuine breakout or merely another test of established resistance. Consequently, understanding the technical landscape and fundamental drivers becomes paramount for any informed trading decision.

USD/JPY Forecast: Technical Analysis of the Current Range

The recent climb to the mid-159.00s places the USD/JPY pair near the upper boundary of its recent consolidation zone. Technical analysts identify several key levels that define this range. Firstly, support appears firm around the 157.50 level, where buying interest has consistently emerged. Secondly, resistance has proven formidable in the 159.50 to 160.00 band, a zone that has repeatedly capped rallies. The pair’s behavior within this corridor suggests a market in equilibrium, awaiting a fresh catalyst.

Furthermore, moving averages provide additional context. The 50-day and 200-day simple moving averages currently slope upward, indicating a broader bullish trend. However, the price action’s failure to sustain breaks above 160.00 highlights underlying caution. Chart patterns, including recent doji candlesticks near the highs, signal indecision among traders. This technical setup implies that while the trend favors the US dollar, immediate upside may be limited without a fundamental shift.

Fundamental Drivers Behind the Yen’s Movement

The confinement of the USD/JPY pair within its range stems directly from competing fundamental forces. On one side, the interest rate differential between the US Federal Reserve and the Bank of Japan (BoJ) remains the dominant macro theme. The Fed’s “higher for longer” stance on rates continues to underpin dollar strength. Conversely, the BoJ’s ultra-accommodative policy, despite a historic shift away from negative rates, maintains a wide yield gap that pressures the yen.

Meanwhile, other economic indicators create crosscurrents. Robust US employment data supports the dollar’s yield appeal. In contrast, periodic interventions by Japanese authorities to support the yen inject volatility and establish psychological barriers near the 160.00 level. Additionally, global risk sentiment influences the pair; a risk-off environment often triggers yen buying as a traditional safe-haven asset. These conflicting forces create the push-and-pull dynamic evident in the price chart.

Expert Analysis: The Intervention Watch

Market strategists consistently highlight the 160.00 level as a critical line in the sand for Japanese policymakers. Historical data shows that verbal and actual intervention has intensified as the pair approaches this threshold. Financial institutions like Nomura and Goldman Sachs publish regular notes analyzing the Ministry of Finance’s (MoF) likely tolerance levels. Their consensus suggests that while the mid-159.00s are acceptable, a sustained break above 160.00 would dramatically increase the probability of direct market action by Japan. This overhang effectively caps bullish momentum and reinforces the range-bound trading pattern.

Comparative Performance Against Other Major Pairs

The USD/JPY’s range-bound behavior contrasts with movements in other major currency pairs. The following table illustrates this divergence over a recent one-month period:

Currency Pair Price Change Market Characterization
USD/JPY +1.2% Range-Bound, Consolidation
EUR/USD -2.1% Trending, Bearish
GBP/USD -1.8% Trending, Bearish
AUD/USD -3.0% Trending, Bearish

This comparison reveals a key insight: the US dollar’s broad strength is unambiguous, but the Japanese yen has shown relative resilience compared to European and commodity-linked currencies. This resilience is not due to yen strength but rather to the specific containment policy focused on the USD/JPY exchange rate. The pair’s performance is therefore an outlier, dictated by unique political and interventionist factors not present in other forex markets.

Market Impact and Trader Positioning

The persistent range in USD/JPY has tangible effects on market participants. For institutional hedgers, the stability provides a clearer environment for planning international transactions. However, for speculative traders, the low volatility within the range compresses potential profits, pushing strategies toward selling options or betting on a breakout. Commitments of Traders (COT) reports from the CFTC show that leveraged funds maintain a sizable net-long position in USD/JPY futures, reflecting the prevailing bullish bias, but the growth of this position has stalled alongside the price consolidation.

Moreover, the range influences global capital flows. Japan’s significant holdings of foreign assets, particularly US Treasuries, become more sensitive to exchange rate stability. A stable or predictably weak yen supports the outward investment strategy of Japanese institutions. Conversely, a sudden, intervention-driven yen spike could trigger rapid, destabilizing capital repatriation. This systemic importance ensures that global macro funds monitor the 159.00-160.00 zone with intense scrutiny.

Conclusion

The USD/JPY price forecast remains tightly linked to its ongoing battle between bullish interest rate dynamics and bearish intervention risks. The climb to the mid-159.00s demonstrates underlying dollar strength, yet the pair’s confinement within a familiar range underscores the powerful influence of Japanese monetary authorities. Traders should prepare for continued volatility around key technical levels, with a sustained break above 160.00 likely requiring a fundamental change in policy stance from either the Fed or the BoJ. Until then, the familiar range prevails.

FAQs

Q1: What does it mean that USD/JPY is “confined in a familiar range”?
It means the currency pair’s price is oscillating between a consistent high (resistance) and low (support) level, unable to break out in either direction for a sustained period. This indicates a balance between buying and selling forces.

Q2: Why is the 160.00 level so important for USD/JPY?
The 160.00 level is viewed as a critical psychological and technical threshold. Japanese authorities have historically intervened in the forex market to support the yen when USD/JPY approaches or breaches this level, making it a key line for traders to watch.

Q3: What are the main fundamental factors driving the USD/JPY exchange rate?
The primary driver is the wide interest rate differential between the US (high rates) and Japan (very low rates). Secondary factors include the Bank of Japan’s policy trajectory, US economic data, global risk sentiment, and the threat of currency intervention by Japan.

Q4: How does a range-bound market affect trading strategies?
A range-bound market favors strategies like selling options (to collect premium from low volatility) or range-trading (buying near support, selling near resistance). It is less favorable for trend-following strategies that require sustained directional movement.

Q5: What would likely cause a definitive breakout from the current USD/JPY range?
A breakout would likely require a major shift in fundamentals, such as the Federal Reserve signaling aggressive rate cuts, the Bank of Japan committing to a rapid tightening cycle, or Japanese authorities explicitly abandoning their intervention stance—none of which are currently the base case.

This post USD/JPY Price Forecast: Soars to Mid-159.00s Yet Remains Trapped in Familiar Range first appeared on BitcoinWorld.

Source link

18 04, 2026

Goldman Pound To Dollar Forecast: Sell GBP/USD, 3-Month Target Is 1.33

By |2026-04-18T17:57:00+02:00April 18, 2026|Forex News, News|0 Comments

The Pound to Dollar (GBP/USD) exchange rate found support below 1.32 in early April and has rallied strongly to above 1.35, recouping Iran-related losses as the dollar has lost ground. Risk appetite has also recovered which has helped underpin the Pound.

Over the last few months, Goldman Sachs has recommended selling GBP/EUR to take advantage of expectations of Pound vulnerability due to UK economic and political risks.

The bank still considers that the Pound is vulnerable, but has changed its stance and now considers that Pound vulnerability is best expressed through selling GBP/USD. The bank has a 3-month GBP/USD target of 1.33.

Goldman maintains a cautious stance towards Sterling on political and economic grounds. The bank notes political risks surrounding the May local elections, especially with opinion polls still indicating that the Labour Party will suffer sharp losses, increasing the risk of a challenge to Prime MInister Starmer once the Iran conflict ends.

The bank also notes that the UK economy will be vulnerable to the energy shock and there is also a risk that markets are being complacent over the domestic and global economic risks, increasing the Pound risk profile.

foreign exchange rates

Source link

18 04, 2026

Danske Bank Euro To Dollar Forecast: EUR/USD To Rise To 1.22 In Next 12 Months

By |2026-04-18T13:56:02+02:00April 18, 2026|Forex News, News|0 Comments

The Euro to Dollar (EUR/USD) exchange rate has rallied to highs around 1.18 as hopes for a resolution in the US-Iran conflict have undermined near-term dollar demand.

Danske Bank notes a high degree of uncertainty in the short term, but it has shifted its bias and is no longer backing significant short-term EUR/USD losses. The bank is also backing 12-month EUR/USD gains to 1.22 as the dollar retreats further.

It does, however, note that any escalation in the Middle East conflict would trigger renewed dollar demand with the threat of high volatility.

Danske expects monetary policy will be a key medium-term feature for FX markets. After no change in the short term, Danske is backing two Federal Reserve rate cuts by the end of 2026. In contrast, the ECB is expecting rate hikes in June and July which will erode the dollar’s yield support.

It also expects that US inflation will be higher which will undermine real dollar rates while a retreat in energy prices would help underpin the Euro. Danske also considers that fair value for EUR/USD is around 1.25 which means a net tailwind for the Euro.

EUR/USD — Key Rate Highlights:

Current Rate: 1.177250 (17 Apr 2026, 22:29 UTC)

Daily Move: -0.07% (-0.000824)

foreign exchange rates

Latest Close: 1.177250 (17 Apr)

April Range: 1.150650 – 1.184920

April Performance: +1.72%

12-Month Range: 1.106540 – 1.207544

Recent Trend: EUR/USD holding firm near recent highs after a strong April rally, with slight consolidation in latest sessions


Disclaimer: For information only, not investment advice. This EUR to USD forecast summarises and interprets third-party research; views expressed are those of the original source and may not fully reflect the source’s complete analysis. Neither the source nor we accept liability for reliance on this interpretation.

Source link

18 04, 2026

EUR/GBP Forecast: Critical Upside Bias Emerges Amid UK Economic Uncertainty

By |2026-04-18T09:55:03+02:00April 18, 2026|Forex News, News|0 Comments


EUR/GBP Forecast: Critical Upside Bias Emerges Amid UK Economic Uncertainty


Skip to content


Source link

18 04, 2026

GBP/USD Forecast: Critical 50% Fibonacci Retracement at 1.3500 Emerges as Pivotal Support Zone

By |2026-04-18T01:53:02+02:00April 18, 2026|Forex News, News|0 Comments

BitcoinWorld

GBP/USD Forecast: Critical 50% Fibonacci Retracement at 1.3500 Emerges as Pivotal Support Zone

LONDON, March 2025 – The GBP/USD currency pair, commonly known as ‘Cable,’ is currently navigating a critical technical juncture as the 50% Fibonacci retracement level near the 1.3500 handle solidifies into a formidable support zone. This development follows a period of heightened volatility driven by shifting monetary policy expectations and geopolitical developments. Consequently, market participants are closely monitoring this price region for signals that will dictate the pair’s medium-term trajectory. This analysis provides a comprehensive examination of the technical landscape, fundamental drivers, and historical context surrounding this pivotal level.

GBP/USD Forecast: Decoding the Fibonacci Framework

Technical analysts utilize Fibonacci retracement levels to identify potential support and resistance areas following a significant price move. The tool draws horizontal lines at key percentages of the prior trend’s range. For GBP/USD, traders have applied the Fibonacci retracement to the notable decline from the July 2024 high near 1.4200 to the October 2024 low around 1.2800. The resulting 50% retracement level sits precisely at 1.3500, a major psychological and technical benchmark.

Market behavior around these levels often provides critical insights. Recently, the pair has tested the 1.3500 region on multiple occasions, with each test resulting in a bounce or consolidation. This repeated interaction confirms the zone’s significance. Furthermore, the 38.2% and 61.8% Fibonacci levels at 1.3310 and 1.3690, respectively, act as secondary support and resistance markers, framing the current trading range.

  • Key Fibonacci Levels: 38.2% (1.3310), 50% (1.3500), 61.8% (1.3690).
  • Psychological Level: The 1.3500 handle represents a major round number.
  • Confluence: This area aligns with a previous resistance-turned-support zone from Q1 2024.

Fundamental Backdrop Influencing Cable’s Trajectory

The technical setup exists within a complex fundamental environment. On the British pound side, the Bank of England’s (BoE) ongoing balancing act between persistent services inflation and a weakening labor market continues to create uncertainty. Market pricing suggests a slower pace of rate cuts compared to the Federal Reserve, providing a relative yield support for sterling. However, concerns over UK economic growth and fiscal sustainability present headwinds.

Conversely, the US dollar’s direction hinges on Federal Reserve policy and broader risk sentiment. Recent softer inflation prints have reinforced expectations for an impending Fed easing cycle, which typically weighs on the dollar. Nonetheless, its status as a global safe-haven currency can trigger inflows during periods of geopolitical stress, as witnessed in early 2025. This fundamental tug-of-war directly impacts the GBP/USD equilibrium.

Expert Analysis and Market Sentiment Indicators

Institutional research desks have published varied outlooks. For instance, analysts at major banks note that a sustained hold above the 1.3500 Fibonacci support could open a path toward testing the 1.3690 (61.8% retracement) resistance. A breakdown, however, would target the 1.3310 level and potentially challenge the 2024 lows. Commitment of Traders (COT) reports from the CFTC show that leveraged funds have recently reduced net short positions on GBP, indicating a less pessimistic stance.

Option market dynamics also offer clues. The concentration of option expiries and heightened implied volatility around the 1.3500 strike price often acts as a ‘gravitational pull’ for the spot price in the days leading to expiry. This phenomenon, known as ‘pinning,’ can temporarily amplify support or resistance effects at these technical levels.

Historical Precedents and Comparative Analysis

Examining past behavior provides context for current price action. Historically, the 50% Fibonacci retracement has served as a reliable pivot point for GBP/USD across multiple market cycles. For example, during the post-Brexit vote recovery in 2017, the 50% retracement of the 2014-2016 decline acted as a sturdy platform for a multi-month consolidation before a further rally ensued.

A comparative analysis with other major currency pairs reveals similar patterns. The EUR/USD pair, for instance, recently respected its own 50% Fibonacci level during the 2023-2024 cycle, demonstrating the broad applicability of this technical tool in forex markets. The table below summarizes key technical indicators for GBP/USD as of March 2025:

Indicator Level Signal
50-Day Moving Average 1.3475 Dynamic Support
200-Day Moving Average 1.3380 Long-Term Trend
RSI (14-day) 48 Neutral
Key Fibonacci Support 1.3500 (50%) Primary Zone

Conclusion

The GBP/USD forecast remains tightly linked to the integrity of the 50% Fibonacci retracement support near 1.3500. This zone represents a confluence of technical significance, psychological importance, and current market positioning. While fundamental factors from both the UK and US will ultimately drive the long-term trend, the price action around this 1.3500 handle will likely serve as a critical barometer for trader sentiment and risk appetite in the forex market. A decisive break, either above the 1.3690 resistance or below the 1.3310 support, will be required to establish the next sustained directional move for Cable.

FAQs

Q1: What is a Fibonacci retracement level in forex trading?
A Fibonacci retracement is a technical analysis tool that identifies potential support and resistance levels based on key ratios derived from the Fibonacci sequence. Traders apply it to a prior significant price swing to forecast where pullbacks might find support or face resistance.

Q2: Why is the 1.3500 level specifically important for GBP/USD?
The 1.3500 level is important because it represents the exact 50% retracement of the pair’s 2024 decline, acts as a major psychological round number, and coincides with a previous price structure from early 2024, creating a strong zone of technical confluence.

Q3: What fundamental factors could cause GBP/USD to break below 1.3500 support?
A more aggressive than expected shift to dovish policy by the Bank of England, a significant weakening of UK economic data, a surge in safe-haven demand for the US dollar due to geopolitical risk, or a more hawkish recalibration of Federal Reserve policy could all pressure the pair below this support.

Q4: How do traders use the 50% Fibonacci level in their strategies?
Traders may look for bullish reversal patterns or oversold signals when the price approaches the 50% level from above, using it as a potential entry zone for long positions with a stop loss placed below the next Fibonacci level (e.g., 61.8%). Conversely, a break below it may be used as a signal for short positions.

Q5: What are the next key technical levels if GBP/USD holds above 1.3500?
If the pair holds the 1.3500 support, the immediate upside resistance to watch is the 61.8% Fibonacci retracement near 1.3690. Beyond that, the 1.3800 psychological level and the 2024 high near 1.4200 would become longer-term targets for a bullish scenario.

This post GBP/USD Forecast: Critical 50% Fibonacci Retracement at 1.3500 Emerges as Pivotal Support Zone first appeared on BitcoinWorld.

Source link

17 04, 2026

Forecast update for EURUSD -17-04-2026.

By |2026-04-17T21:52:00+02:00April 17, 2026|Forex News, News|0 Comments

The GBPJPY pair needs positive momentum until this moment, forcing it to form weak sideways trading by its stability near 215.40, note that the stability of the trading above the initial support at 214.15 in the current period, to confirm the continuation of the positivity, which might target 216.20 level reaching 217.00.


While facing negative pressure and reaching below 214.15 will push it to activate the bearish corrective track, to expect suffering several losses by reaching 213.60 and 213.30.


The expected trading range for today is between 214.55 and 216.20


Trend forecast: Bullish


Source link

17 04, 2026

USD/JPY, AUD/USD and GBP/JPY Forecasts – Yen Continues to Face Pressure

By |2026-04-17T17:51:01+02:00April 17, 2026|Forex News, News|0 Comments

The Australian dollar has actually hit a fresh new high against the Japanese yen as we have cleared the 114 level. I am bullish of this pair and I do think short-term pullbacks will continue to offer buying opportunities, not only due to the interest rate differential but the fact that this is a bit of a commodity play and of course, a play on the fact that Australia is one of the few central banks around the world that has actually raised rates recently.

Ultimately, I do think that we go looking to a much higher level, perhaps 118 yen. That is a longer-term thought, that is not anything we are going to see in the next few days, but I like owning this pair.

GBP/JPY Technical Analysis

Source link

17 04, 2026

The EURJPY remains bullish– Forecast today – 17-4-2026

By |2026-04-17T13:50:08+02:00April 17, 2026|Forex News, News|0 Comments

Copper price began its trading by losing the bullish momentum due to stochastic attempt to end the bullish rally, to settle again near $5.9700 level, which formed strong barrier in the previous trading.


The stability above $5.9700 supports the chances of gathering the required extra positive momentum to motivate the bullish rally that might target $6.1550 and $6.2500, while the decline below it might force it to provide temporary trading, to target $5.8100 before reaching the additional positive targets.


The expected trading range for today is between $5.9100 and $6.1550


Trend forecast: Fluctuated


Source link

Go to Top