The main tag of Gold Price Articles.
You can use the search box below to find what you need.
[wd_asp id=1]
The main tag of Gold Price Articles.
You can use the search box below to find what you need.
[wd_asp id=1]
Domestic coffee prices today
Coffee prices today in the domestic market simultaneously increased sharply in key production areas. The average price was recorded at 96,800 VND/kg, an increase of 4,000 VND/kg compared to the previous update.
In Dak Lak, coffee prices increased by 3,900 VND/kg, reaching 96,700 VND/kg. In Gia Lai, coffee prices increased by 4,000 VND/kg, reaching 96,800 VND/kg.
In Lam Dong, coffee prices today increased by 3,900 VND/kg, to 96,200 VND/kg. This is still the lowest level among the surveyed areas.
The old Dak Nong area continued to have the highest purchase price, reaching 97,000 VND/kg, an increase of 4,000 VND/kg.
Thus, domestic coffee prices currently fluctuate from 96. 200-97. 000 VND/kg. The gap between the region with the highest and lowest prices is 800 VND/kg.
After a strong increase, the domestic coffee price level has approached the 110,000 VND/kg mark. This is a notable increase after a period of strong market fluctuations at the end of June and the beginning of July.
The USD/VND exchange rate according to Vietcombank is recorded at 26,072 VND/USD.
World coffee prices
World coffee prices increased very strongly in the most recent trading session. Both Robusta on the London exchange and Arabica on the New York exchange simultaneously went up.
On the London exchange, the September 2026 Robusta futures contract increased by 328 USD/ton, equivalent to 8.83%, to 4,044 USD/ton.
During the session, this contract at one point increased to 4,110 USD/ton. Trading volume reached 15,802 lots.
Robusta for November 2026 delivery increased by 328 USD/ton, equivalent to 8.92%, to 4,007 USD/ton.
The January and March 2027 terms also increased by 328 USD/ton, to 3,974 USD/ton and 3,942 USD/ton respectively.
The July 2026 Robusta contract was recorded at 4,604 USD/ton, up 161 USD/ton. However, the trading volume only reached 21 lots because this term was close to maturity. Therefore, the September contract more clearly reflects the market trend.
On the New York exchange, Arabica coffee prices surged. The September 2026 Arabica futures contract increased by 48.75 US cents/lb, equivalent to 16.19%, to 349.95 US cents/lb.
During the session, this contract at one point touched 357.00 US cents/lb. Trading volume reached 47,909 lots.
Arabica December 2026 futures increased by 49.10 US cents/lb, equivalent to 17.15%, to 335.40 US cents/lb.
The March and May 2027 terms increased by 48.65 US cents/lb and 47.20 US cents/lb respectively, to 329.75 US cents/lb and 328.10 US cents/lb.
This development shows that world coffee prices are reacting very strongly to information about harvest progress in Brazil, low inventories and weather risks in the coming months.
Coffee price assessment
According to data from Barchart, coffee prices surged in the first session of the week, in which Arabica rose to a high of about 5 and a half months, and Robusta rose to a high of about 5 months.
The main supporting factor comes from the slow harvest progress in Brazil. Brazil’s consulting firm Safras & Mercado said that the 2026-2027 coffee crop harvest in this country has only completed 52% as of July 1.
This level is lower than 60% in the same period last year and also lower than the 5-year average of 55%. Slow harvest progress increases concerns that spot supply will be tightened in the short term.
The rise in coffee prices is also supported by unfavorable weather forecasts. Brazil’s Rural Climate Meteorological Company said that widespread rain may occur in Brazil in mid-July, adversely affecting some crops, including coffee.
Rain in harvest season can hinder harvesting, transportation and drying. If humidity persists, coffee bean quality is also at risk of being affected.
However, the Brazilian meteorological company Somar Meteorologia said that Minas Gerais state, the country’s largest coffee growing region, did not record rain in the week ending July 5. This shows that weather risks still need to be monitored for each production region.
Another factor supporting the price is the Brazilian real rising to a 2-week high against the USD. A strong real often causes Brazilian farmers to reduce export sales motivation, as revenue converted into domestic currency is less attractive.
Standard Arabica coffee inventories on the US Intercontinental Exchange continued to fall sharply, to 3,66,756 bags. This is the lowest level in more than 2 years, making the market more sensitive to unfavorable information about supply.
Meanwhile, Robusta inventories on the European Intercontinental Exchange increased to 4,109 lots last weekend, the highest level in about 3 months. This factor partly creates resistance for Robusta, but is not enough to stop the strong increase in the latest session.
El Niño risk continues to be monitored by businesses. The US National Oceanic and Atmospheric Administration (NOAA) assesses that there is a 63% chance that El Niño will reach very strong intensity in the period from November 2026 to January 2027.
El Niño may change rainfall in Brazil during the coffee tree flowering period in September and October, and also affect Robusta production conditions in some Asian countries. However, the specific impact depends on the intensity and timing of appearance in each region.
In terms of pressure, the Foreign Agricultural Services Agency of the US Department of Agriculture (USDA/FAS) still forecasts Brazil to have a large coffee crop in the 2026-2027 crop year. Rabobank of the Netherlands also raised its global Arabica surplus forecast for the 2026-2027 crop year from 7 million bags to 9.5 million bags.
Regarding Robusta, the Statistics Department (Ministry of Finance) said that Vietnam’s coffee exports in the first 6 months of 2026 reached about 1.05 million tons, an increase of 7.3% compared to the same period. Vietnam is the world’s largest Robusta producer, so increased supply is still a factor that can curb price increases in the medium term.
Welcome, my fellow traders! I have prepared a price forecast for the USCrude, XAUUSD, and EURUSD using a combination of the margin zones method and technical analysis. Based on the market analysis, I suggest entry signals for intraday traders.
The euro continues to keep its bearish bias.
The article covers the following subjects:
USCrude: Oil is attempting to rebound, but selling pressure still persists.
XAUUSD: Gold is approaching the support A of 4,091–4,080.
EURUSD: The euro is declining from the resistance B of 1.1482–1.1468.
Oil is correcting upward within the short-term downtrend, targeting the resistance level A of 73.23–72.67. Once this resistance is reached, consider short positions with targets of 70.15 and 67.06.
If the resistance A is pierced, the correction will likely continue toward the resistance B of 76.31–75.47. Short positions can also be considered near this key level.
Sell near resistance A at 73.23–72.67. TakeProfit: 70.15, 67.06. StopLoss: 74.65.
Gold is correcting downward in the short-term uptrend toward the support A of 4,091–4,080. Once this zone is reached, consider long positions with targets of 4,141 and 4,202. If the support A is broken through today, the price will likely reach the support B of 4,036–4,019. This level acts as a trend boundary, so buying opportunities may also appear near it.
Buy near support A of 4,091–4,080. TakeProfit: 4,141, 4,202. StopLoss: 4,052.
The euro keeps its bearish bias today. Last week, the price tested the resistance B of 1.1482–1.1468. Sellers defended the zone, and the price began to decline toward the first bearish target of 1.1403. Therefore, short positions can be kept open today until this target is reached. The second target is the June low near 1.1324.
If the euro exceeds the resistance B today, the short-term downtrend will reverse. In that case, consider buying the pair with a target in the upper Target Zone of 1.1641–1.1612.
Hold short trades opened at resistance B of 1.1482 – 1.1468. TakeProfit: 1.1403, 1.1324. StopLoss: 1.1512.
Would you like to learn more about technical analysis methods and principles? Explore our comprehensive guide.
P.S. Did you like my article? Share it in social networks: it will be the best “thank you” 🙂
Useful links:
The content of this article reflects the author’s opinion and does not necessarily reflect the official position of LiteFinance broker. The material published on this page is provided for informational purposes only and should not be considered as the provision of investment advice for the purposes of Directive 2014/65/EU.
According to copyright law, this article is considered intellectual property, which includes a prohibition on copying and distributing it without consent.
Platinum price attempted to settle within the minor bearish channel’s levels by its fluctuation near $1605.00 level, taking advantage of the negative factors that are represented by forming main barrier at $1745.00 level, besides the attempt of providing negative momentum by the main indicators, especially by stochastic stability below 80 level.
Therefore, we will keep preferring the bearish trend in the near trading, to expect breaking $1600.00 level and holding below it to begin targeting negative stations, which might begin at $1570.00 and $1510.00.
The expected trading range for today is between $1570.00 and $1650.00
Trend forecast: Bearish
Silver (XAG/USD) pauses a four-day winning streak on Monday as buyers take a breather following last week’s 5.55% rally. A firmer US Dollar (USD) is also capping the precious metal’s upside. At the time of writing, XAG/USD is trading around $61.75, easing from its intraday high of $63.28, the highest level since June 23.
The US Dollar Index (DXY), which tracks the Greenback’s value against a basket of six major currencies is trading around 101.12, up 0.22% on the day.
Despite Monday’s modest pullback, Silver’s near-term outlook remains supported by easing expectations of a near-term Federal Reserve (Fed) interest rate hike following weaker-than-expected US Nonfarm Payrolls (NFP) data released on Thursday.
However, the technical picture tells a different story, as Silver remains capped below both its short- and long-term moving averages.
In the daily chart, XAG/USD remains in a bearish near-term bias as price holds below the 21-day Simple Moving Average (SMA) at $63.45 and the broader 200-day SMA at $70.06, underscoring a market that is still capped by medium- and long-term trend resistance.
The Relative Strength Index (RSI) has recovered from oversold levels but remains around 42, while the Moving Average Convergence Divergence (MACD) has turned slightly positive, suggesting the rebound may be temporary within the broader downtrend.
On the topside, initial resistance emerges at the 21-day SMA near $63.45, with a more meaningful barrier at the $70 horizontal level, reinforced by the 200-day SMA at $70.06 and the 50-day SMA at $71.05 clustering just above.
Further up, the 100-day SMA around $74.81 precedes additional caps at $80 and $90. On the downside, the next notable support is the horizontal floor near $55.00, where buyers could attempt to stabilize the decline if bearish pressure resumes.
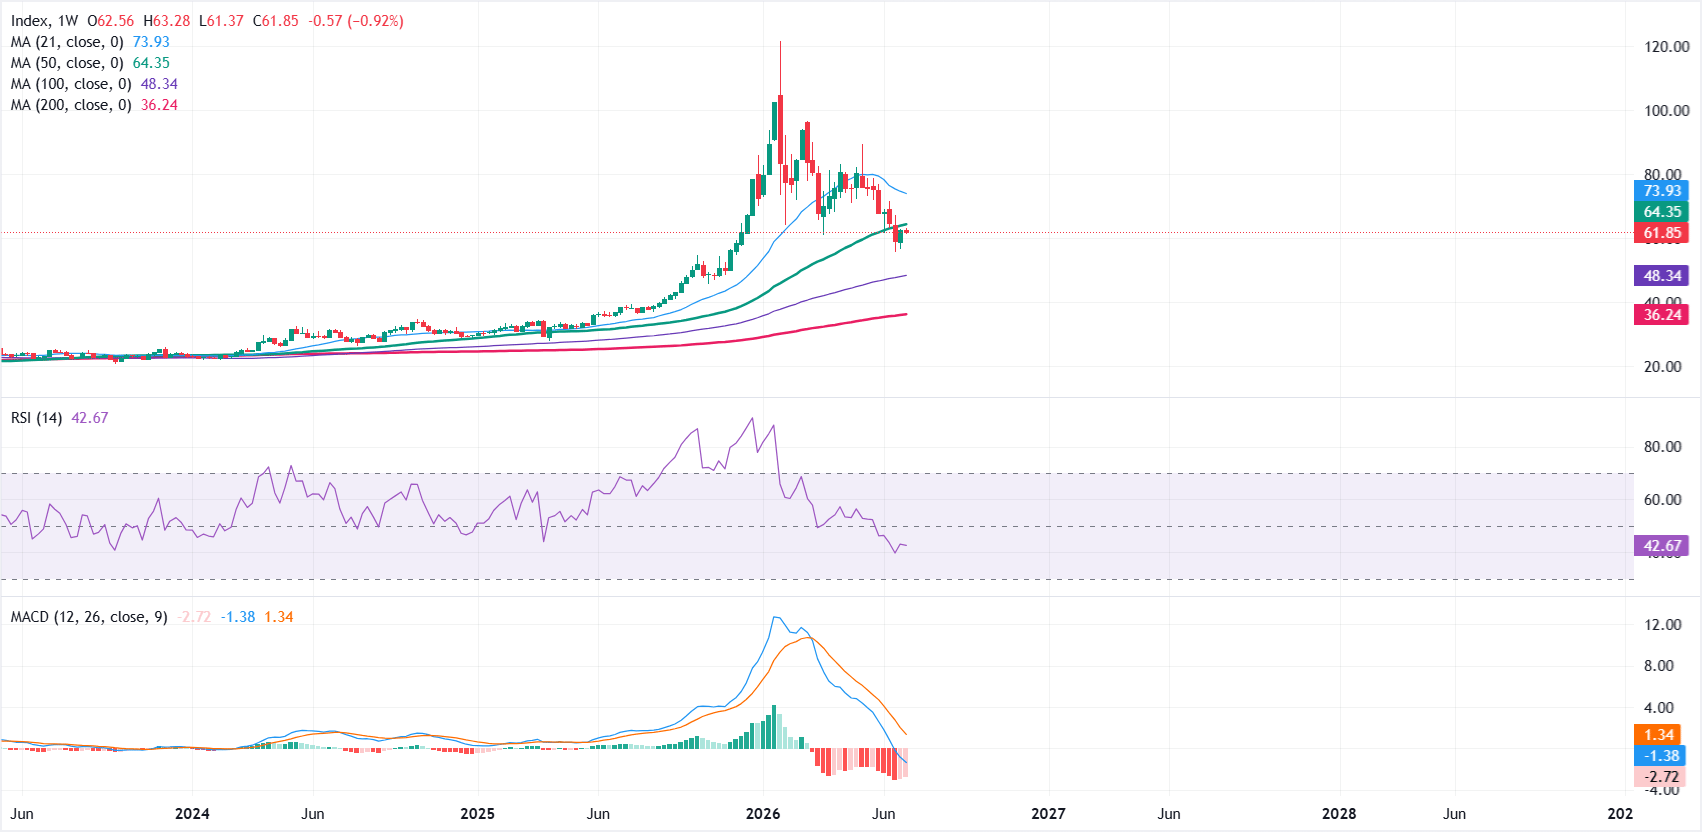
In the weekly chart, XAG/USD holds a clear bullish structural bias as price remains well above the 100-week and 200-week Simple Moving Averages (SMAs) at roughly $48.34 and $36.24, respectively, underscoring a firmly supported medium-term uptrend.
Momentum, however, looks subdued: the RSI hovers near 43, while the Moving Average Convergence Divergence (MACD) remains negative, which together hint that upside traction is waning despite the broader bullish backdrop.
On the topside, initial resistance emerges at the 50-week SMA near $64.35, with a stronger barrier higher up at the 21-week SMA around $73.93, levels that would need to be reclaimed to revive a more aggressive bullish phase.
On the downside, immediate support is seen at the 100-week SMA at $48.34, ahead of the deeper structural floor at the 200-week SMA near $36.24, where the broader bullish trend would be expected to attract buyers on a more pronounced correction.
(The technical analysis of this story was written with the help of an AI tool. Know more.)
Silver is a precious metal highly traded among investors. It has been historically used as a store of value and a medium of exchange. Although less popular than Gold, traders may turn to Silver to diversify their investment portfolio, for its intrinsic value or as a potential hedge during high-inflation periods. Investors can buy physical Silver, in coins or in bars, or trade it through vehicles such as Exchange Traded Funds, which track its price on international markets.
Silver prices can move due to a wide range of factors. Geopolitical instability or fears of a deep recession can make Silver price escalate due to its safe-haven status, although to a lesser extent than Gold’s. As a yieldless asset, Silver tends to rise with lower interest rates. Its moves also depend on how the US Dollar (USD) behaves as the asset is priced in dollars (XAG/USD). A strong Dollar tends to keep the price of Silver at bay, whereas a weaker Dollar is likely to propel prices up. Other factors such as investment demand, mining supply – Silver is much more abundant than Gold – and recycling rates can also affect prices.
Silver is widely used in industry, particularly in sectors such as electronics or solar energy, as it has one of the highest electric conductivity of all metals – more than Copper and Gold. A surge in demand can increase prices, while a decline tends to lower them. Dynamics in the US, Chinese and Indian economies can also contribute to price swings: for the US and particularly China, their big industrial sectors use Silver in various processes; in India, consumers’ demand for the precious metal for jewellery also plays a key role in setting prices.
Silver prices tend to follow Gold’s moves. When Gold prices rise, Silver typically follows suit, as their status as safe-haven assets is similar. The Gold/Silver ratio, which shows the number of ounces of Silver needed to equal the value of one ounce of Gold, may help to determine the relative valuation between both metals. Some investors may consider a high ratio as an indicator that Silver is undervalued, or Gold is overvalued. On the contrary, a low ratio might suggest that Gold is undervalued relative to Silver.
TradingKey – As of the Asian session on July 6, WTI ( USOIL) crude oil prices extended last Friday’s rebound during intraday trading, peaking at $69.26 before consolidating around $68.60. From a technical perspective, oil prices have recovered after falling to a near four-month low, but the strength of the rebound remains limited. This is primarily due to the ongoing transit through the Strait of Hormuz and OPEC’s production increase measures.
From a fundamental perspective, WTI crude oil prices rebounded before paring gains today. The core reason is that while short-term prices rebounded due to previous oversold conditions and some Middle East uncertainties, the medium-term supply side is releasing more bearish signals.
First, the gradual recovery of transit through the Strait of Hormuz is a key factor suppressing the upward movement of oil prices. Previously, conflicts involving the U.S., Israel, and Iran briefly led to increased shipping risks in the Gulf, causing some tankers to reroute or delay transit through critical waterways, which drove up the oil price risk premium on fears of disrupted Middle East crude exports. However, the latest updates indicate that while some tankers still took unusual detours on Saturday, the main shipping lanes of the Strait of Hormuz had returned to near-normal by Sunday.
For WTI, the restoration of transit through the Strait of Hormuz directly eroded the geopolitical risk premium. Previously, oil prices were able to find some support at lower levels primarily due to market concerns over Middle East supply disruptions. Once the critical transport corridor recovered, traders shifted their focus back to actual supply and demand rather than continuing to bet on a war premium.
Second, the latest OPEC+ decision to increase output has further heightened oversupply concerns. OPEC+ has approved a production hike of 188,000 barrels per day for next month, driven mainly by Saudi Arabia and Russia.
In addition, the potential return of Iranian exports is putting further pressure on oil prices. The latest reports indicate that Iran has begun discussions with Japanese companies to resume crude oil sales under a temporary U.S. sanctions waiver framework. The waiver is valid for 60 days and will run until August 21. If Japanese buyers ultimately resume purchasing Iranian crude, it would mark a significant shift since 2019 and suggest that Iranian crude could reopen parts of the Asian market outside of China.
WTI crude oil daily chart, Source: TradingView
Looking at the daily chart of WTI crude oil, although today’s oil price continued last week’s rebound at the open and briefly surged above $69 during the session, it fell back to around $68 intraday. This indicates heavy upward pressure on market bulls, with market sentiment leaning more towards the bears. Meanwhile, the recent K-line movement of oil prices has remained below the 5-day Simple Moving Average (SMA5), further proving that market sentiment is tilted to the bearish side.
Currently, as oil prices have broken below the $70 psychological level and the Fibonacci 0.786 retracement level of $69.40, the downside space for oil prices has opened up further. The primary target will be to test the $60 psychological level on the downside. If oil prices fail to hold $60, they will fall further toward the Fibonacci 1.0 retracement level near $56.
On the upside, key resistance levels above to watch are $69.40-$70. Only if oil prices can establish a firm foothold above $70 will the upside space be opened, with the potential to test $73 on the upside, and further up, watch $78.
This content was translated using AI and reviewed for clarity. It is for informational purposes only.
(ETHUSD) declined slightly in its latest intraday trading, due to the stability of the resistance at $1,775, which was our last expected targets, with the beginning of negative overlapping signals’ emergence on the relative strength indicators after reaching overbought levels, and there is a possibility to form negative divergence.
On the other hand, the price is benefited from the continuation of the dynamic support that is represented by its trading above EMA50, with the dominance of the bullish corrective trend on the short-term basis, so we might witness some bearish corrective rebounds to look for a new rising low, that might provide bullish momentum to help the price breach this resistance.
Platinum prices forced to delay the negative trading due to the continuation of providing positive momentum by stochastic, fluctuating above the minor bearish channel’s resistance, to settle near $1640.00.
The price might manage to record some gains by its rally towards $1695.00, however it will not change the main bearish scenario due to its stability below $1745.00 barrier, while the decline below $1600.00 will force it to provide sharp negative trading, to target $1570.00 level reaching the next negative target near $1510.00.
The expected trading range for today is between $1600.00 and $1690.00
Trend forecast: Fluctuating within the bearish trend
World oil prices today
In the past week, world gasoline and oil prices continued to decrease. WTI crude oil decreased from 69.23 USD/barrel at the end of last week to 68.78 USD/barrel at the end of this week. Overall for the week, WTI oil prices decreased by 0.45 USD/barrel, equivalent to about 0.65% compared to the end of last week.
Brent oil fell from 72.60 USD/barrel at the end of last week to 72.12 USD/barrel at the end of this week. Over the past week, Brent oil prices fell 0.48 USD/barrel, equivalent to about 0.66% compared to the end of last week.
According to analysts, world oil prices continued to fall last week as investors expect negotiations between the US and Iran to achieve positive results, contributing to cooling tensions in the Middle East and reducing the risk of supply disruptions.
However, experts note that the flow of ships through the Strait of Hormuz is still significantly lower than normal. This shows that geopolitical risks have not been completely eliminated and are still a factor supporting oil prices.
Closing the last trading session of the second quarter, oil prices recorded the strongest monthly and quarterly decrease since the Covid-19 pandemic broke out. According to analysts, although the market still partially assesses geopolitical risks, the increasing number of oil tankers leaving the Persian Gulf region has helped free up previously stranded ships, thereby temporarily improving supply.
In that context, Morgan Stanley bank forecasts that the global oil market will have a surplus of about 4.8 million barrels/day by 2027.
Experts also believe that the OPEC+ alliance is likely to continue to raise production targets at the meeting on July 5. If approved, this decision will add more supply to the market in the context of weakening oil prices and transportation through the Strait of Hormuz gradually returning to normal.
In the opposite direction, the US Energy Information Administration (EIA) said that US crude oil inventories last week fell to their lowest level since 2018 due to increased demand from oil refineries. The country’s gasoline inventories also recorded a decrease.
Meanwhile, Morgan Stanley bank forecasts that the global oil market will have a surplus of about 4.8 million barrels/day by 2027.
UBS Bank also lowered its Brent oil price forecast due to the increasing volume of oil transported through the Strait of Hormuz. Specifically, UBS lowered its Brent oil price forecast for the third quarter to 80 USD/barrel, 25 USD lower than the previous forecast; the forecast for the fourth quarter was also lowered by 10 USD to 80 USD/barrel. At the same time, this bank lowered its Brent oil price forecast for 2027 to 75 USD/barrel, 10 USD lower than the previous forecast.
Domestic gasoline prices today
On July 5th, retail gasoline and oil prices according to the price list announced by Petrolimex in region 1 and region 2 are as follows:
The above domestic retail gasoline and oil prices were adjusted by Petrolimex according to the inter-ministry of Industry and Trade – Finance’s management period from 4:00 PM on July 2nd. Accordingly, gasoline and oil prices simultaneously decreased.
Gasoline and oil discount today
– Tu Luc Petroleum Joint Stock Company 1:
+ Diesel oil 0.05S – II: 0 VND/liter;
+ Diesel oil 0.001S-V: 0 VND/liter.
+ E10 RON 95-III gasoline: 50 VND/liter
+ E5 RON 92 – II gasoline: 0 VND/liter
– MIPEC Petroleum Trading and Trading Co., Ltd. – MIPEC Petro (applied to the Northern region):
+ E10 gasoline: 400 VND/liter.
+ Diesel oil 0.05S-II: 100 VND/liter.
Domestic gasoline and oil price forecast for the next period
According to a representative of a gasoline and oil business, it is predicted that in the next price adjustment period, retail gasoline and oil prices may have opposite adjustments.
In which:
– E10 gasoline reduced by about 600 VND/liter;
– E5 RON 92 – II gasoline reduced by about 600 VND/liter;
– Diesel oil increased by about 700 VND/liter.
Today’s gasoline and oil prices are for reference only and may change according to market developments.
Refer to more articles about gasoline and oil prices HERE.


