The main tag of Gold Price Articles.
You can use the search box below to find what you need.
[wd_asp id=1]
The main tag of Gold Price Articles.
You can use the search box below to find what you need.
[wd_asp id=1]
Brent crude oil remains under limited and cautious gains during recent intraday trading, recovering part of its previous losses. The price has also eased its oversold conditions on relative strength indicators, which have now moved into overbought territory compared with price action. This suggests the beginning of a negative divergence, adding further downside pressure, especially with the indicators starting to show a bearish crossover.
Meanwhile, the price continues to face negative pressure from trading below the EMA50, while the short-term bearish trend remains dominant, limiting the chances of a sustained recovery.
The article covers the following subjects:
Consider short positions from corrections below the level of 80.45 with a target of 70.00–65.00.
Breakout and consolidation above the level of 80.45 will allow the asset to continue rising to the levels of 91.80–105.17.
A descending correction appears to have formed as the second wave of larger degree (2) on the weekly chart, with wave C of (2) completed as its part. On the daily time frame, an ascending third wave (3) is developing. Within it, the first wave of smaller degree 1 of (3) has formed, and a downward correction is unfolding as the second wave 2 of (3). Wave c of 2 is presumably developing on the H4 chart; within it, wave (v) of c is unfolding. If the presumption is correct, WTI will continue to decline to the levels of 70.00–65.00. The level of 80.45 is critical in this scenario as a breakout above it will enable the asset to continue rising to the levels of 91.80–105.17.
This forecast is based on the Elliott Wave Theory. When developing trading strategies, it is essential to consider fundamental factors, as the market situation can change at any time.
The content of this article reflects the author’s opinion and does not necessarily reflect the official position of LiteFinance broker. The material published on this page is provided for informational purposes only and should not be considered as the provision of investment advice for the purposes of Directive 2014/65/EU.
According to copyright law, this article is considered intellectual property, which includes a prohibition on copying and distributing it without consent.
There is no change in the bearish trend of natural gas prices, as the market continues to stabilize below the key barrier at $3.520. In addition, repeated trading below the 55-period moving average increases the likelihood of forming new bearish waves in the near term, targeting $2.920 initially and then the major support level at $2.620.
On the other hand, if the price succeeds in breaking above $3.520 and maintains stability above it, this would confirm a shift to a bullish trend. In that case, a strong upward rally could develop, with initial targets at $3.730 and $3.950, respectively.
The expected trading range for today is between $2.920 and $3.300
Trend forecast: Bearish
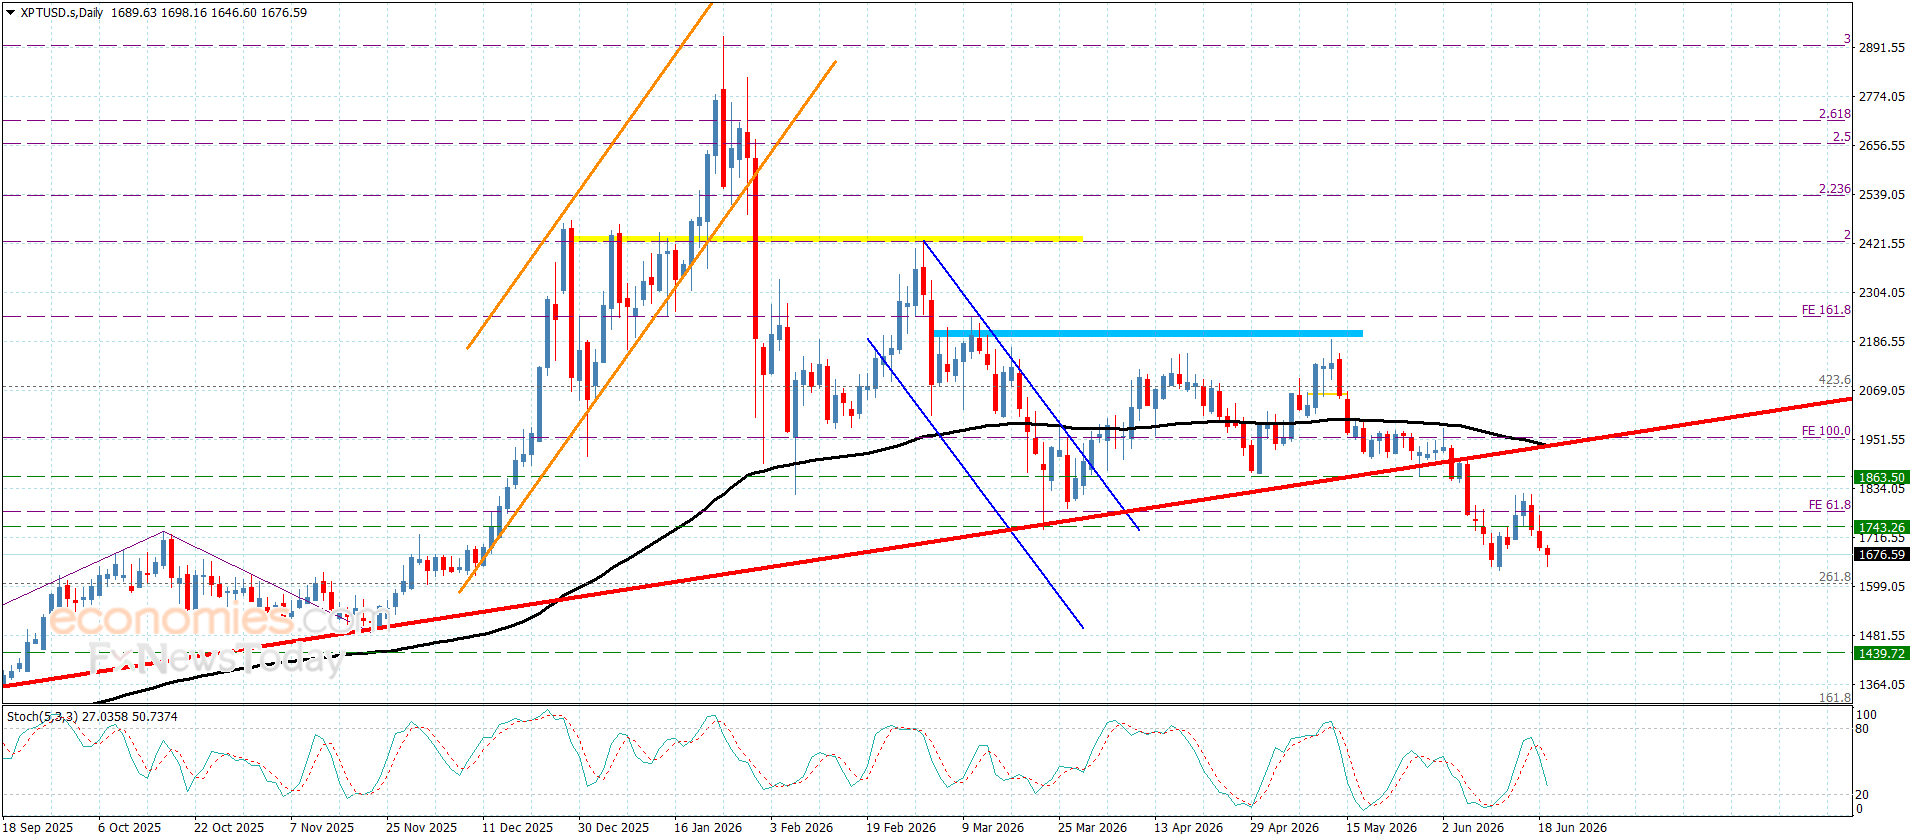
Platinum price formed several negative waves yesterday, benefiting from the alignment of the main indicators in providing negative momentum. As a result, the price has now reached the first target at $1,655.00, which has recently acted as an obstacle to further bearish movement.
The price may be forced to move sideways for a period in the short term. However, the continued presence of negative factors encourages expectations of a break below the current barrier, which would strengthen the chances of reaching additional bearish targets starting at $1,605.00 and then $1,565.00.
The expected trading range for today is between $1,605.00 and $1,745.00
Trend forecast: Bearish
Silver
traded at $68.91 per ounce on Thursday, June 18, 2026, up 1.5% on the day and
back above the 200 EMA it had broken just one week earlier. The reclaim
reverses the bearish signal that defined my last analysis and drops price back
inside the $66 to $89 consolidation that has framed the white metal since
February.
Wednesday’s
near 3% drop, triggered by a hawkish Federal Reserve, found a floor almost
exactly at the moving average that matters most.
The setup
now is simple. Silver sits at the bottom of a range it has refused to leave for
four months, and the next directional clue is the 50 EMA at $74. Until that
level breaks, very little has changed on the chart since February.
Follow
me on X for real-time silver market analysis: @ChmielDk
A week ago
I wrote that silver had broken below its 200 EMA and warned how low that could
take it, in my analysis of the 200 EMA breakdown. The chart has since flipped. Price
has climbed back above that average, and the consolidation between $66 support
and $89 resistance is live again.
The $66 to
$68 support zone coincides almost to the dollar with the 200 EMA, and that
confluence is what stopped Wednesday’s selloff. The upper boundary near $89
traces the local highs from early February, a level last tested in the first
half of May, which is what triggered the most recent leg down.
This is the
same range I mapped when silver crashed to the $70 floor for
the third time in
March. In 15+ years trading and analyzing metals at FinanceMagnates.com, 10 of
them spent covering silver’s every major break, a 200 EMA reclaim this fast
after a breakdown is rare, and you can read more of my metals work on my analyst page.
Silver is
trying to bounce, but the move higher has a ceiling: the 50 EMA sits near $74,
a meaningful distance above spot. That is the gate. The swing-trading principle
for range-bound markets is direct. As long as price holds between two
boundaries, it tends to travel from one to the other, so the path to $89 stays
open while $66 holds.
From
current levels, the upside to the top of the channel is roughly 30%. My
Fibonacci extension, stretched across the prior trend, puts the 100% level just
above the $89 boundary, which reinforces a target aligned with the dominant
trend. I do not rule that scenario out, but I want to see $74 taken first.
How high can silver go? XAG/USD daily chart with 50 and 200 EMA. Source: Tradingview.com
Key levels:
|
Level |
Type |
Notes |
|
$89 |
Resistance |
Upper |
|
$74 |
50 EMA |
The gate. |
|
$68 |
Spot / pivot |
Current |
|
$66-$68 |
Support / 200 EMA |
Confluence |
|
$62 |
Support |
March |
A close
back below $66 reopens the $62 March low and turns the chart bearish again. A
daily close above $74 is the trigger I am watching for the move toward $89.
Silver
climbed above $69 on Thursday after the US dollar retreated from the spike that
followed Wednesday’s Fed decision. President Donald Trump signed an interim
agreement to end the conflict with Iran and reopen the Strait of Hormuz, easing
the oil-driven inflation premium that has weighed on metals all year.
Lower crude
takes pressure off Treasury yields, and softer yields reduce the opportunity
cost of holding non-yielding silver.
The cap on
the rebound is monetary policy. Silver tumbled about 3% on Wednesday after the
Fed signaled growing support for rate hikes this year, with half of FOMC
members projecting that a hike may be needed.
New Fed
Chair Kevin Warsh declined to guide on the next move but stressed that
inflation has run above the 2% target for years. That hawkish tilt is why
silver bounced off support rather than ripping through resistance.
The drivers
behind the current move:
Sentiment
among chart-focused traders on X leans cautiously bullish, with the $66 zone
treated as the line in the sand.
“My
view remains bullish while price stays above $60,” said Jess, the trader
behind @JessXAUUSD, who flagged $71 as the breakout trigger
toward $77. That aligns with my own read: $66 holding keeps the bullish
structure intact, though I put the real gate higher, at the $74 50 EMA.
$xag #Gümüş takip ettiğimiz 66 bölgesinde yer alan mavi kutu desteğine geldi. Destekte tutunduktan sonra yükseliş yeniden devam edebilir.
71 tepesini kırdığında takip edeceğimiz dirençler 77-89 tepeleridir.
Bu bölge önemli, üzerlerinde kapanış yapıp kalıcılık… pic.twitter.com/NoD5W47UkQ— Kamile Uray (@remdocan) June 18, 2026
Kamile Uray
(@remdocan)
sees the same $66 support holding and points to $77 and $89 as the resistances
above a $71 break. The clustering around $89 from independent analysts is
notable, since it matches the top of my consolidation channel exactly.
The most
aggressive target comes from Dr. Potassium (@potassium_phd),
who wrote that silver’s “next target is $96.01, likely sometime in
June,” conditional on the October 2025 trendline holding as support. That
sits well above my channel, and I would need a clean $89 break to entertain it.
Silver 🥈 — $77.04 — still not out of dead cat bounce territory until getting at least above the 50% level of the prior daily candle, but looks promising that the October 2025 trend line will hold as support and that the sell-off is essentially over.
Could still be choppy for a… https://t.co/uU2GZMAIss pic.twitter.com/WfVtShejG2
— Dr. Potassium (@potassium_phd) May 18, 2026
Not
everyone is positioned for a breakout. “Silver is entering a multi-month
sideways consolidation between $60 and $75,” said Damodara Rao (@damodara_SEBIRA), arguing selling momentum is drying up while the market builds a base.
That range-bound thesis is closest to what my chart has shown since February.
Silver is entering a multi-month sideways consolidation between $60 and $75 as the previous parabolic uptrend cools down and selling momentum is also drying up which signals that the market lacks the pressure to break lower but needs time to build a new base. pic.twitter.com/73W7YC3nOP
— Damodara Rao (SEBI RA) (@damodara_SEBIRA) June 13, 2026
Janey (@Janey_Analyst)
framed an intraday long setup off the $67.65 area with short-term targets up to
$70.15, a near-term echo of the broader bullish-while-above-support structure.
#SILVER#XAGUSD Trading Setup – Buy Opportunity (1-Hour Chart)#XAGUSD is approaching a key demand zone, and buying power is emerging. As long as the price remains above the current market area, the bullish outlook remains valid.
Current Market Area: 67.6500
Technical Targets:… pic.twitter.com/XZPqfgWdgn
— Janey (@Janey_Analyst) June 8, 2026
The
forecast range for silver remains extraordinarily wide, and the spread between
X traders and institutions tells the story. Back in April I laid out the full institutional case from BofA,
Citi and Reuters as
COMEX inventory tightened. My own structure says the question is binary: hold
$66 and grind toward $89, or lose it and revisit $62.
|
Source |
Target |
Notes |
|
Damodara Rao (@damodara_SEBIRA) |
$60-$75 range |
June 2026, base-building consolidation |
|
Jess (@JessXAUUSD) |
$77 |
On a break above $71 |
|
Kamile Uray (@remdocan) |
$77, then $89 |
Resistances above a $71 break |
|
Dr. Potassium (@potassium_phd) |
$96 |
June |
|
Citigroup (Max Layton) |
$150 |
3-month |
|
HSBC |
$68.25 avg |
2026 average forecast |
My view on
each: Damodara Rao’s $60-$75 base is the scenario my chart most supports, since
silver has refused to leave this range since February. Jess and Uray’s $77 is
realistic but only after the $74 50 EMA falls, which neither flags explicitly.
Dr. Potassium’s $96 requires breaking $89 first, a level that has capped every
rally this year.
Citi’s $150 call was made in January near the $120
highs and looks stretched against current action. HSBC’s $68.25 average is almost exactly where silver
trades today, which makes it the most credible institutional anchor on the
board.
My chart
puts the immediate ceiling at $89, the top of the consolidation that has held
since February, roughly 30% above the $68.91 price on June 18. A daily close
above the $74 50 EMA is the trigger for that move. Independent X traders target
$77 to $96, while Citigroup’s January call of $150 looks stretched against
current action.
The 50 EMA
at $74 is the gate. Silver reclaimed its 200 EMA near $66 to $68 this week,
putting price back inside its range, but upside stays capped until $74 breaks
on a closing basis. Below, the $66 confluence floor is the line that keeps the
bullish structure intact.
Silver
dropped about 3% on Wednesday, June 17, after the Federal Reserve signaled
growing support for rate hikes in 2026, with half of FOMC members projecting a
hike may be needed. The hawkish tilt lifted the dollar and Treasury yields,
both headwinds for non-yielding silver, before a US-Iran deal reopening the
Strait of Hormuz sparked Thursday’s bounce.
The $66 to
$68 zone is critical support, coinciding almost exactly with the 200 EMA, and
it held on Wednesday’s selloff. A daily close below it reopens the $62 March
swing low as the next downside target. As long as $66 holds, the four-month
consolidation between $66 and $89 stays intact.
This is not
investment advice. Technically, silver sits at the bottom of its range, which
is where range traders look for long setups toward the $89 boundary, provided
$66 holds. The risk is a hawkish Fed forcing a close below support, which would
flip the chart bearish toward $62. Position sizing matters given silver’s
volatility .
Silver
traded at $68.91 per ounce on Thursday, June 18, 2026, up 1.5% on the day and
back above the 200 EMA it had broken just one week earlier. The reclaim
reverses the bearish signal that defined my last analysis and drops price back
inside the $66 to $89 consolidation that has framed the white metal since
February.
Wednesday’s
near 3% drop, triggered by a hawkish Federal Reserve, found a floor almost
exactly at the moving average that matters most.
The setup
now is simple. Silver sits at the bottom of a range it has refused to leave for
four months, and the next directional clue is the 50 EMA at $74. Until that
level breaks, very little has changed on the chart since February.
Follow
me on X for real-time silver market analysis: @ChmielDk
A week ago
I wrote that silver had broken below its 200 EMA and warned how low that could
take it, in my analysis of the 200 EMA breakdown. The chart has since flipped. Price
has climbed back above that average, and the consolidation between $66 support
and $89 resistance is live again.
The $66 to
$68 support zone coincides almost to the dollar with the 200 EMA, and that
confluence is what stopped Wednesday’s selloff. The upper boundary near $89
traces the local highs from early February, a level last tested in the first
half of May, which is what triggered the most recent leg down.
This is the
same range I mapped when silver crashed to the $70 floor for
the third time in
March. In 15+ years trading and analyzing metals at FinanceMagnates.com, 10 of
them spent covering silver’s every major break, a 200 EMA reclaim this fast
after a breakdown is rare, and you can read more of my metals work on my analyst page.
Silver is
trying to bounce, but the move higher has a ceiling: the 50 EMA sits near $74,
a meaningful distance above spot. That is the gate. The swing-trading principle
for range-bound markets is direct. As long as price holds between two
boundaries, it tends to travel from one to the other, so the path to $89 stays
open while $66 holds.
From
current levels, the upside to the top of the channel is roughly 30%. My
Fibonacci extension, stretched across the prior trend, puts the 100% level just
above the $89 boundary, which reinforces a target aligned with the dominant
trend. I do not rule that scenario out, but I want to see $74 taken first.
How high can silver go? XAG/USD daily chart with 50 and 200 EMA. Source: Tradingview.com
Key levels:
|
Level |
Type |
Notes |
|
$89 |
Resistance |
Upper |
|
$74 |
50 EMA |
The gate. |
|
$68 |
Spot / pivot |
Current |
|
$66-$68 |
Support / 200 EMA |
Confluence |
|
$62 |
Support |
March |
A close
back below $66 reopens the $62 March low and turns the chart bearish again. A
daily close above $74 is the trigger I am watching for the move toward $89.
Silver
climbed above $69 on Thursday after the US dollar retreated from the spike that
followed Wednesday’s Fed decision. President Donald Trump signed an interim
agreement to end the conflict with Iran and reopen the Strait of Hormuz, easing
the oil-driven inflation premium that has weighed on metals all year.
Lower crude
takes pressure off Treasury yields, and softer yields reduce the opportunity
cost of holding non-yielding silver.
The cap on
the rebound is monetary policy. Silver tumbled about 3% on Wednesday after the
Fed signaled growing support for rate hikes this year, with half of FOMC
members projecting that a hike may be needed.
New Fed
Chair Kevin Warsh declined to guide on the next move but stressed that
inflation has run above the 2% target for years. That hawkish tilt is why
silver bounced off support rather than ripping through resistance.
The drivers
behind the current move:
Sentiment
among chart-focused traders on X leans cautiously bullish, with the $66 zone
treated as the line in the sand.
“My
view remains bullish while price stays above $60,” said Jess, the trader
behind @JessXAUUSD, who flagged $71 as the breakout trigger
toward $77. That aligns with my own read: $66 holding keeps the bullish
structure intact, though I put the real gate higher, at the $74 50 EMA.
$xag #Gümüş takip ettiğimiz 66 bölgesinde yer alan mavi kutu desteğine geldi. Destekte tutunduktan sonra yükseliş yeniden devam edebilir.
71 tepesini kırdığında takip edeceğimiz dirençler 77-89 tepeleridir.
Bu bölge önemli, üzerlerinde kapanış yapıp kalıcılık… pic.twitter.com/NoD5W47UkQ— Kamile Uray (@remdocan) June 18, 2026
Kamile Uray
(@remdocan)
sees the same $66 support holding and points to $77 and $89 as the resistances
above a $71 break. The clustering around $89 from independent analysts is
notable, since it matches the top of my consolidation channel exactly.
The most
aggressive target comes from Dr. Potassium (@potassium_phd),
who wrote that silver’s “next target is $96.01, likely sometime in
June,” conditional on the October 2025 trendline holding as support. That
sits well above my channel, and I would need a clean $89 break to entertain it.
Silver 🥈 — $77.04 — still not out of dead cat bounce territory until getting at least above the 50% level of the prior daily candle, but looks promising that the October 2025 trend line will hold as support and that the sell-off is essentially over.
Could still be choppy for a… https://t.co/uU2GZMAIss pic.twitter.com/WfVtShejG2
— Dr. Potassium (@potassium_phd) May 18, 2026
Not
everyone is positioned for a breakout. “Silver is entering a multi-month
sideways consolidation between $60 and $75,” said Damodara Rao (@damodara_SEBIRA), arguing selling momentum is drying up while the market builds a base.
That range-bound thesis is closest to what my chart has shown since February.
Silver is entering a multi-month sideways consolidation between $60 and $75 as the previous parabolic uptrend cools down and selling momentum is also drying up which signals that the market lacks the pressure to break lower but needs time to build a new base. pic.twitter.com/73W7YC3nOP
— Damodara Rao (SEBI RA) (@damodara_SEBIRA) June 13, 2026
Janey (@Janey_Analyst)
framed an intraday long setup off the $67.65 area with short-term targets up to
$70.15, a near-term echo of the broader bullish-while-above-support structure.
#SILVER#XAGUSD Trading Setup – Buy Opportunity (1-Hour Chart)#XAGUSD is approaching a key demand zone, and buying power is emerging. As long as the price remains above the current market area, the bullish outlook remains valid.
Current Market Area: 67.6500
Technical Targets:… pic.twitter.com/XZPqfgWdgn
— Janey (@Janey_Analyst) June 8, 2026
The
forecast range for silver remains extraordinarily wide, and the spread between
X traders and institutions tells the story. Back in April I laid out the full institutional case from BofA,
Citi and Reuters as
COMEX inventory tightened. My own structure says the question is binary: hold
$66 and grind toward $89, or lose it and revisit $62.
|
Source |
Target |
Notes |
|
Damodara Rao (@damodara_SEBIRA) |
$60-$75 range |
June 2026, base-building consolidation |
|
Jess (@JessXAUUSD) |
$77 |
On a break above $71 |
|
Kamile Uray (@remdocan) |
$77, then $89 |
Resistances above a $71 break |
|
Dr. Potassium (@potassium_phd) |
$96 |
June |
|
Citigroup (Max Layton) |
$150 |
3-month |
|
HSBC |
$68.25 avg |
2026 average forecast |
My view on
each: Damodara Rao’s $60-$75 base is the scenario my chart most supports, since
silver has refused to leave this range since February. Jess and Uray’s $77 is
realistic but only after the $74 50 EMA falls, which neither flags explicitly.
Dr. Potassium’s $96 requires breaking $89 first, a level that has capped every
rally this year.
Citi’s $150 call was made in January near the $120
highs and looks stretched against current action. HSBC’s $68.25 average is almost exactly where silver
trades today, which makes it the most credible institutional anchor on the
board.
My chart
puts the immediate ceiling at $89, the top of the consolidation that has held
since February, roughly 30% above the $68.91 price on June 18. A daily close
above the $74 50 EMA is the trigger for that move. Independent X traders target
$77 to $96, while Citigroup’s January call of $150 looks stretched against
current action.
The 50 EMA
at $74 is the gate. Silver reclaimed its 200 EMA near $66 to $68 this week,
putting price back inside its range, but upside stays capped until $74 breaks
on a closing basis. Below, the $66 confluence floor is the line that keeps the
bullish structure intact.
Silver
dropped about 3% on Wednesday, June 17, after the Federal Reserve signaled
growing support for rate hikes in 2026, with half of FOMC members projecting a
hike may be needed. The hawkish tilt lifted the dollar and Treasury yields,
both headwinds for non-yielding silver, before a US-Iran deal reopening the
Strait of Hormuz sparked Thursday’s bounce.
The $66 to
$68 zone is critical support, coinciding almost exactly with the 200 EMA, and
it held on Wednesday’s selloff. A daily close below it reopens the $62 March
swing low as the next downside target. As long as $66 holds, the four-month
consolidation between $66 and $89 stays intact.
This is not
investment advice. Technically, silver sits at the bottom of its range, which
is where range traders look for long setups toward the $89 boundary, provided
$66 holds. The risk is a hawkish Fed forcing a close below support, which would
flip the chart bearish toward $62. Position sizing matters given silver’s
volatility .
The S&P 500 Index SPY today is up +0.99%, the Dow Jones Industrial Average  DIA is up +0.61%, and the Nasdaq 100 Index
  QQQ is up +2.16%. September E-mini S&P futures (ESU26) are up +0.99%, and September E-mini Nasdaq futures (NQU26) are up +2.10%.
Stock indexes are sharply higher today as geopolitical risks recede. President Trump on Wednesday night signed a preliminary deal to end the US-Iran war, which sent crude oil prices to a 3.5-month low, eased inflation expectations, and sparked risk-on sentiment in asset markets. The slump in crude prices has also pushed bond yields lower, as the 10-year T-note yield is down -6 bp to 4.43%.
Join 200K+ Subscribers: Find out why the midday Barchart Brief newsletter is a must-read for thousands daily.
Chipmakers are climbing today to lead the broader market higher, led by a +7% jump in Intel after President Trump said the chipmaker will work alongside Apple to design and produce semiconductors domestically. On the negative side, IT service stocks are retreating today, led by a -15% plunge in Accenture after its disappointing Q4 revenue forecast. Also, today’s decline in crude oil prices to a 3.5-month low is weighing on energy-producing stocks.
Today’s US economic news was supportive of stocks after weekly initial unemployment claims fell -4,000 to 226,000, close to expectations of 225,000. Also, the June Philadelphia Fed business outlook survey rose by +10.7 to 10.3, stronger than expectations of 10.0.
Stock market moves may be exaggerated and more volatile than usual today due to the expiration of June options, futures, and derivatives during the quarterly event known as triple witching. The event will take place today, with US markets closed on Friday for the Juneteenth holiday.
WTI crude oil prices (CLN26) are down more than -3% today at a new 3.5-month low after President Trump signed a memorandum of understanding in Paris Wednesday night, formally extending the US-Iran ceasefire for 60 days that allows the Strait of Hormuz to reopen and starts a further round of negotiations to permanently end the war. The resumption of vessel traffic through the Strait of Hormuz could lead to the release of more than 100 oil-laden tankers stuck in the Persian Gulf, effectively adding to market stockpiles. Goldman Sachs on Tuesday cut its price forecast on Brent crude to $80 a barrel in Q4 of this year, down from $90 a barrel, and said it expects Persian Gulf crude exports to return to pre-war levels by the end of July, one month earlier than previously expected.
The markets are discounting a 32% chance of a +25 bp rate hike at the next FOMC meeting on July 28-29.
Overseas stock markets are mixed today. The Euro Stoxx 50 climbed to a new record high and is up +0.45%. China’s Shanghai Composite fell from a 3-week high and closed down -0.43%. Japan’s Nikkei-225 Stock Average rallied to a new all-time high and closed up +1.65%.
Interest Rates
September 10-year T-notes (ZNU6) today are up +6 ticks, and the 10-year T-note yield is down -4.8 bp to 4.430%. T-notes have support today from falling crude oil prices, which put downward pressure on inflation expectations. WTI crude oil is down more than -3% today at a 3.5-month low, knocking the 10-year inflation expectations rate down to a 6-month low of 2.218%.
Gains in T-notes are limited amid today’s rally in stocks, which curbs safe-haven demand for government debt securities. T-notes also have some negative carryover from Wednesday, when the Fed raised its US 2026 core PCE estimate and projected higher interest rates later this year.
European government bond yields are moving lower today. The 10-year German bund yield is down -0.2 bp to 2.925%. The 10-year UK gilt yield is down -0.3 bp to 4.7483%.
ECB Governing Council member Martin Kocher said consumer prices will remain higher for some time in the Eurozone despite an agreement to end the war in the Middle East, and that the ECB is ready to act at any time to ensure inflation returns to its 2% target.
The UK Apr ILO unemployment rate unexpectedly fell -0.1 to 4.9%, showing a stronger labor market than expectations of no change at 5.0%.
As expected, the BOE kept its official bank rate unchanged at 3.75% in a 7-2 vote and said it “stands ready to act” on inflation. BOE Governor Andrew Bailey said the recent fall in crude oil prices is “encouraging,” but warned that “the situation remains unpredictable and there is clearly a risk that energy prices remain elevated for an extended duration.”
Swaps are discounting a 17% chance of a +25 bp ECB rate hike at its next policy meeting on July 23.
US Stock Movers
Chipmakers are climbing today, with the iShares Semiconductor ETF  SOXX up more than +5% at a new record high. Marvell Technology
  MRVL is up more than +11% to lead gainers in the Nasdaq 100, and Intel
  INTC is up more than +7% after President Trump said the chipmaker will work alongside Apple to design and produce semiconductors domestically. Also, Micron Technology
  MU is up more than +7%, and Applied Materials
  AMAT, Microchip Technology
  MCHP, and KLA Corp
  KLAC are up more than +6%. In addition, Lam Research
  LRCX, Qualcomm
  QCOM, NXP Semiconductors NV
  NXPI, and Texas Instruments
  TXN are up more than +5%, and Broadcom
  AVGO, ARM Holdings Plc
  ARM, and Analog Devices
  ADI are up more than +4%.
Airline stocks and cruise line operators are rallying today as the -3% plunge in WTI crude oil to a 3.5-month low reduces fuel costs and boosts the profitability prospects for the companies. Alaska Air Group  ALK, Royal Caribbean Cruises
  RCL, Carnival CCCL, and Norwegian Cruise Line Holdings
  NCLH are up more than +4%, and Southwest Airlines
  LUV, United Airlines Holdings
  UAL, American Airlines Group
  AAL, and Delta Air Lines
  DAL are up more than +3%.
IT service stocks are retreating today, led by a -15% plunge in Accenture  ACN, the S&P 500’s leading loser, after it forecast Q4 revenue of $17.75-$18.40 billion, below the consensus of $18.47 billion. The lower revenue forecast exacerbated concerns that consultants such as Accenture could be hit hard by AI in the coming years. Also, Cognizant Technology Solutions
  CTSH is down more than -7% to lead the Nasdaq 100 losers, and Huron Consulting Group
  HURN and Globant SA
  GLOB are down more than -7%. In addition, International Business Machines
  IBM is down more than -5% to lead the Dow Jones Industrials’ losers.
Energy producers and service providers are falling today, with WTI Crude oil down more than -3% to a 3.5-month low. APA Corp  APA, Halliburton
  HAL, and SLB Ltd
  SLB are down more than -3%, and Chevron
  CVX, Diamondback Energy
  FANG, Exxon Mobil
  XOM, ConocoPhillips
  COP, Occidental Petroleum
  OXY, Baker Hughes
  BKR, and Valero Energy
  VLO are down more than -2%.
Centrus Energy  LEU is up more than +11% after signing a letter of intent for it to supply domestic high-assay low-enriched uranium to Oklo to power up to five of Oklo’s Aurora powerhouses for multiple years.
Talen Energy  TLN is up more than +8% after Goldman Sachs initiated coverage on the stock with a recommendation of buy and a price target of $499.
Integra LifeSciences Holdings  IART is up more than +3% after Argus upgraded the stock to buy from hold with a price target of $25.
Novocure Ltd  NVCR is down more than -18% after announcing its Phae 3 TRIDENT trial, which tested earlier initiation of Tumor Treating Fields therapy in newly diagnosed glioblastoma patients compared to later initiation, did not meet its primary endpoint.
Kroger  KR is down more than -5% after reporting Q1 adjusted EPS of $1.58, below the consensus of $1.59, and forecasting 2027 adjusted EPS of $5.10 to $5.30, the midpoint weaker than the consensus of $5.23.
Steel Dynamics  STLD is down more than -5% after forecasting Q2 EPS of $3.51 to $3.55, well below the consensus of $4.16.
FactSet Research Systems  FDS is down more than -2% after Rothschild & Co downgraded the stock to sell from neutral with a price target of $215.
Earnings Reports(6/18/2026)
Accenture PLC (ACN) and Kroger Co/The (KR).
On the date of publication, Rich Asplund did not have (either directly or indirectly) positions in any of the securities mentioned in this article. All information and data in this article is solely for informational purposes.For more information please view the Barchart Disclosure Policy here.
The S&P 500 Index SPY today is up +0.73%, the Dow Jones Industrial Average DIA is up +0.53%, and the Nasdaq 100 Index QQQ is up +1.62%. June E-mini S&P futures (ESM26) are up +0.80%, and June E-mini Nasdaq futures (NQM26) are up +1.65%.
Stock indexes are sharply higher today after President Trump’s signing on Wednesday night of a preliminary deal to end the US-Iran war sent crude oil prices to a 3.5-month low, eased inflation expectations, and sparked risk-on sentiment in asset markets.
Join 200K+ Subscribers: Find out why the midday Barchart Brief newsletter is a must-read for thousands daily.
Chipmakers are climbing today to lead the broader market higher, led by an +8% jump in Intel after President Trump said the chipmaker will work alongside Apple to design and produce semiconductors domestically. On the negative side, IT service stocks are retreating today, led by a -16% plunge in Accenture after its disappointing Q4 revenue forecast.
Today’s US economic news was supportive of stocks after weekly initial unemployment claims fell -4,000 to 226,000, close to expectations of 225,000. Also, the June Philadelphia Fed business outlook survey rose +10.7 to 10.3, stronger than expectations of 10.0.
Stock market moves may be exaggerated and more volatile than usual today due to the expiration of options, futures, and derivatives during the quarterly event known as triple witching. The event will take place today, with US markets closed on Friday for the Juneteenth holiday.
WTI crude oil prices (CLN26) are down more than -2% today at a new 3.5-month low after President Trump signed a memorandum of understanding in Paris Wednesday night, formally extending the US-Iran ceasefire for 60 days that allows the Strait of Hormuz to reopen and starts a further round of negotiations to permanently end the war. The resumption of vessel traffic through the Strait of Hormuz could lead to the release of more than 100 oil-laden tankers that are stuck in the Persian Gulf, effectively releasing stockpiles into the market. Goldman Sachs on Tuesday cut its price forecast on Brent crude to $80 a barrel in Q4 of this year, down from $90 a barrel, and said it expects Persian Gulf crude exports to return to pre-war levels by the end of July, one month earlier than previously expected.
The markets are discounting a 34% chance of a +25 bp rate hike at the next FOMC meeting on July 28-29.
Overseas stock markets are mixed today. The Euro Stoxx 50 climbed to a new record high and is up +0.38%. China’s Shanghai Composite fell from a 3-week high and closed down -0.43%. Japan’s Nikkei-225 Stock Average rallied to a new all-time high and closed up +1.65%.
Interest Rates
September 10-year T-notes (ZNU6) today are up +2 ticks, and the 10-year T-note yield is down -4.8 bp to 4.430%. T-notes have support today from falling crude oil prices, which put downward pressure on inflation expectations. WTI crude oil is down more than -2% today at a 3.5-month low, knocking the 10-year inflation expectations rate down to a 6-month low of 2.218%.
Gains in T-notes are limited amid today’s rally in stocks, which curbs safe-haven demand for government debt securities. T-notes also have some negative carryover from Wednesday, when the Fed raised its US 2026 core PCE estimate and projected higher interest rates later this year.
European government bond yields are moving higher today. The 10-year German bund yield is up +0.2 bp to 2.929%. The 10-year UK gilt yield is up +0.2 bp to 4.753%.
ECB Governing Council member Martin Kocher said consumer prices will remain higher for some time in the Eurozone despite an agreement to end the war in the Middle East, and that the ECB is ready to act at any time to ensure inflation returns to its 2% target.
The UK Apr ILO unemployment rate unexpectedly fell -0.1 to 4.9%, showing a stronger labor market than expectations of no change at 5.0%.
As expected, the BOE kept its official bank rate unchanged at 3.75% in a 7-2 vote and said it “stands ready to act” on inflation. BOE Governor Andrew Bailey said the recent fall in crude oil prices is “encouraging,” but warned that “the situation remains unpredictable and there is clearly a risk that energy prices remain elevated for an extended duration.”
Swaps are discounting a 16% chance of a +25 bp ECB rate hike at its next policy meeting on July 23.
US Stock Movers
Chipmakers are climbing today, with the iShares Semiconductor ETF SOXX up more than +4% at a new record high. Intel INTC is up more than +8% after President Trump said the chipmaker will work alongside Apple to design and produce semiconductors domestically. Also, ARM Holdings Plc ARM and Marvell Technology MRVL are up more than +6%, and Applied Materials AMAT, Micron Technology MU, Lam Research LRCX, and KLA Corp KLAC are up more than +5%. In addition, Advanced Micro Devices  AMD, Microchip Technology MCHP, NXP Semiconductors NV NXPI, Analog Devices ADI, and Texas Instruments TXN are up more than +4%.
Airline stocks and cruise line operators are rallying today as the -2% plunge in WTI crude oil to a 3.5-month low reduces fuel costs and boosts the profitability prospects for the companies. Royal Caribbean Cruises RCL is up more than +4%, and Alaska Air Group ALK, Southwest Airlines LUV, and Carnival CCCL are up more than +3%. Also, United Airlines Holdings UAL, Norwegian Cruise Line Holdings NCLH, American Airlines Group AAL, and Delta Air Lines DAL are up more than +2%.
IT service stocks are retreating today, led by a -16% plunge in Accenture (ACN), the S&P 500’s leading loser, after it forecast Q4 revenue of $17.75-$18.40 billion, below the consensus of $18.47 billion. The lower revenue forecast exacerbated concerns that consultants such as Accenture could be hit hard by AI in the coming years. Also, Cognizant Technology Solutions CTSH is down more than -7% to lead the Nasdaq 100 losers, and Huron Consulting Group HURN is down more than -7%. In addition, International Business Machines IBM is down more than -6% to lead the Dow Jones Industrials’ losers, and Globant SA GLOB is down more than -5%.
Centrus Energy LEU is up more than +8% after signing a letter of intent for Centrus to supply domestic high-assay low-enriched uranium to power up to five of Oklo’s Aurora powerhouses for multiple years.
Talen Energy TLN is up more than +5% after Goldman Sachs initiated coverage on the stock with a recommendation of buy and a price target of $499.
Integra LifeSciences Holdings IART is up more than +3% after Argus upgraded the stock to buy from hold with a price target of $25.
Novocure Ltd NVCR is down more than -16% after announcing its Phae 3 TRIDENT trial, which tested earlier initiation of Tumor Treating Fields therapy in newly diagnosed glioblastoma patients compared to later initiation, did not meet its primary endpoint.
Kroger KR is down more than -6% after reporting Q1 adjusted EPS of $1.58, below the consensus of $1.59, and forecasting 2027 adjusted EPS of $5.10 to $5.30, the midpoint weaker than the consensus of $5.23.
Steel Dynamics STLD is down more than -5% after forecasting Q2 EPS of $3.51 to $3.55, well below the consensus of $4.16.
FactSet Research Systems FDS is down more than -3% after Rothschild & Co downgraded the stock to sell from neutral with a price target of $215.
Earnings Reports(6/18/2026)
Accenture PLC (ACN) and Kroger Co/The (KR).
On the date of publication, Rich Asplund did not have (either directly or indirectly) positions in any of the securities mentioned in this article. All information and data in this article is solely for informational purposes.For more information please view the Barchart Disclosure Policy here.
More news from Barchart
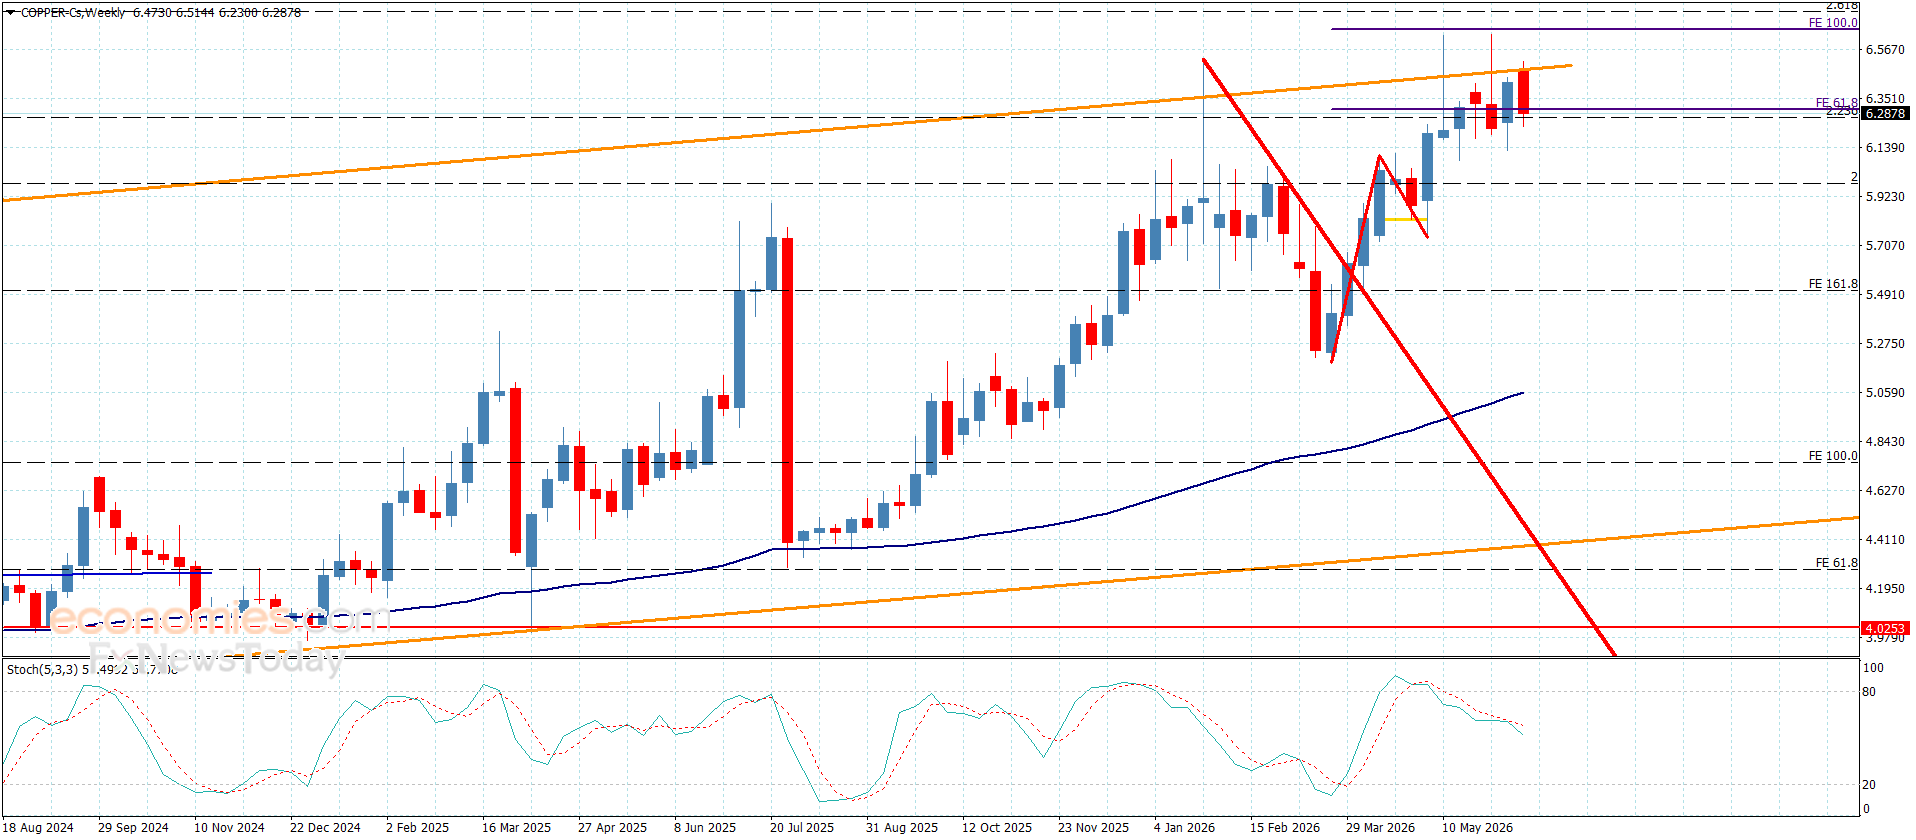
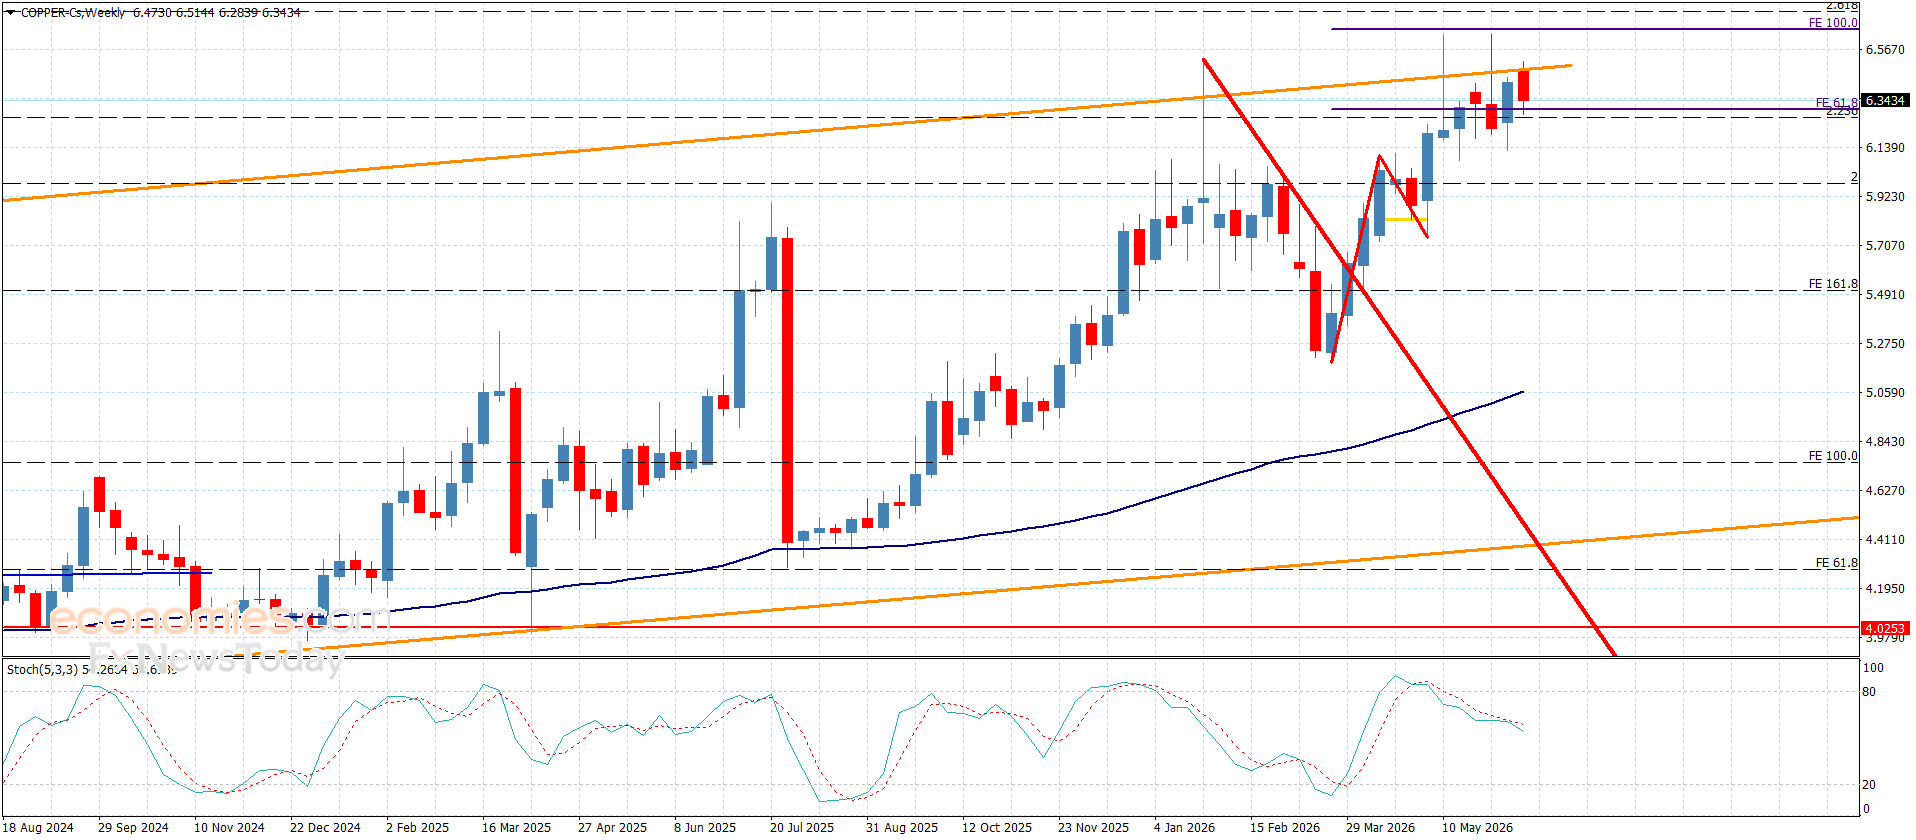
There are no new developments in copper prices so far, as they continue to stabilize repeatedly near the 6.3500$ level due to their continued trading below the firm resistance at 6.6000$. This increases the chances of the price soon moving into new downward corrective trades.
The continued negative momentum provided by the Stochastic indicator supports our expectation that the price will attempt to slip soon toward 6.2000$, and then pressure the support level located at 6.1000$, in an effort to find a path to resume corrective attempts during the short- and medium-term trading period.
The expected trading range for today is between $6.1000 and $6.5000
Trend forecast: Bearish
Despite the attempt of natural gas price to form some positive trades, its repeated positioning below the 55-period moving average, which acts as a strong barrier at 3.360$, supports the chances of the bearish path dominating the near-term trading.
Additionally, the Stochastic indicator’s exit from the overbought level will increase negative pressure on the current trades. Therefore, we maintain our bearish expectations, which may target the 2.920$ and 2.800$ levels respectively in the near term. As for activating a bullish attack, the price needs to form a strong positive surge and stabilize above the resistance level at 3.530$.
The expected trading range for today is between 2.920$ and 3.300$.
Trend forecast: Bearish
July WTI crude oil (CLN26) today is up +0.90 (+1.18%), and July RBOB gasoline (RBN26) is up +0.0098 (+0.34%).
Crude oil and gasoline prices are moving higher today, with crude recovering from a 3.5-month low. Crude oil prices are climbing today on some technical buying after sharp losses over the past three sessions pushed prices into deeply oversold territory. Crude prices extended their gains today after weekly EIA crude inventories fell more than expected to a 7.5-month low, and oil supplies at Cushing, the delivery point of WTI futures, dropped to an 11-year low.
Don’t Miss a Day: From crude oil to coffee, sign up free for Barchart’s best-in-class commodity analysis.
President Trump said the Strait of Hormuz will reopen after this Friday’s signing of the peace deal in Switzerland, which will trigger the start of 60 days of talks on Iran’s nuclear program. However, if an agreement isn’t reached on nuclear, the US could restart military attacks.
The International Energy Agency (IEA) warned today that the Iran war’s impact on global oil demand will be much deeper than previously anticipated, saying world oil consumption will decline by -1.1 million bpd this year, a larger drop than a previous estimate of -420,000 bpd.
The eventual resumption of vessel traffic through the Strait of Hormuz could lead to the release of more than 100 laden ships carrying oil from Middle Eastern countries other than Iran that are stuck in the Persian Gulf, effectively releasing stockpiles into the market.
Goldman Sachs on Tuesday cut its price forecast on Brent crude to $80 a barrel in Q4 of this year, down from $90 a barrel, and said it expects Persian Gulf crude exports to return to pre-war levels by the end of July, one month earlier than previously expected.
The outlook for higher US crude output is negative for oil prices. The Department of Energy (DOE) last Tuesday raised its US 2026 crude production estimate to 13.72 million bpd from a May estimate of 13.65 million bpd.
Crude prices have support from the continued Ukrainian drone attacks on Russian oil infrastructure. According to EA Analytics, Russian crude-processing rates averaged 4.32 million bpd in the first 10 days of June, the lowest in 20 years, amid damage to Russian energy infrastructure caused by drone and missile attacks from Ukraine. According to Bloomberg, Ukrainian forces have struck three Russian fuel-producing facilities this month, following a record 17 attacks in May. US and EU sanctions on Russian oil companies, infrastructure, and tankers have also curbed Russian oil exports.
The International Energy Agency (IEA) said in a monthly report released in May that global oil inventories declined at about 4 million bpd in March and April, and that the market will remain “severely undersupplied” until October, even if the conflict ends soon. Goldman Sachs estimates that crude output in the Persian Gulf has been curtailed by about 14.5 million bpd, and that the current disruption has drawn down nearly 500 million bbl from global crude stockpiles, which could hit a billion bbl by June.
As a bearish factor for crude, OPEC delegates said on May 14 that the cartel aims to continue a series of oil quota increases over the next few months, completing the return of halted oil production by the end of September. The group already formally agreed to restore about two-thirds of the 1.65 million bpd supply cutback it made back in 2023 and said it plans to raise output targets further and to revive the final portion in three more monthly stages. On May 3, OPEC+ said it will boost its crude output by 188,000 bpd in June after raising production by 206,000 bpd in May, although any production hike now seems unlikely given that Middle East producers are being forced to cut production due to the Middle East war. OPEC’s May crude production fell by -3.36 million bpd to a 40-year low of 16.33 million bpd.
Vortexa reported on Monday that crude oil stored on tankers that have been stationary for at least 7 days fell -6.9% w/w to 76.50 million bbl in the week ended June 12.
Today’s weekly EIA report was mixed for crude oil and products. On the bullish side, EIA crude inventories fell -8.26 million bbl to a 7.5-month low, a larger draw than expectations of -3.0 million bbl. Also, crude supplies at Cushing, the delivery point of WTI futures, fell -1.61 million bbl to an 11-year low. On the negative side, EIA distillate stockpiles unexpectedly rose +951,000 bbl versus expectations of a -500,000 bbl draw.
Today’s EIA report showed that (1) US crude oil inventories as of June 12 were -6.1% below the seasonal 5-year average, (2) gasoline inventories were -6.4% below the seasonal 5-year average, and (3) distillate inventories were -12.9% below the 5-year seasonal average. US crude oil production in the week ending June 12 rose +0.1% w/w to 13.806 million bpd, mildly below the record high of 13.862 million bpd posted in the week of November 7.
Baker Hughes reported last Friday that the number of active US oil rigs in the week ended June 12 rose by +2 to an 11-month high of 433 rigs, up from the 4.25-year low of 406 rigs posted in December 2025. However, the number of US oil rigs remains sharply below the 5.5-year high of 627 reported in December 2022.
On the date of publication, Rich Asplund did not have (either directly or indirectly) positions in any of the securities mentioned in this article. All information and data in this article is solely for informational purposes.For more information please view the Barchart Disclosure Policy here.