The main tag of Gold Today Price Articles.
You can use the search box below to find what you need.
[wd_asp id=1]
The main tag of Gold Today Price Articles.
You can use the search box below to find what you need.
[wd_asp id=1]
Domestic coffee prices today
Coffee prices today in key production areas simultaneously decreased by 700 VND/kg. The average price was recorded at 89,200 VND/kg, significantly lower than the level of nearly 90,000 VND/kg in the previous update.
In Dak Lak, coffee prices decreased by 700 VND/kg, down to 89,200 VND/kg. Gia Lai also recorded a similar decrease, bringing the purchase price back to 89,200 VND/kg.
In Lam Dong, today’s coffee price reached 89,000 VND/kg, down 700 VND/kg and continues to be the lowest level among the surveyed areas.
Meanwhile, the old Dak Nong area had the highest price, reaching 89,300 VND/kg, but also decreased by 700 VND/kg compared to the previous update.
Thus, domestic coffee prices currently range from 89,000-8,900 VND/kg. The gap between the region with the highest and lowest prices is 300 VND/kg.
The USD/VND exchange rate according to Vietcombank is recorded at 26,090 VND/USD, unchanged.
World coffee prices
On the London exchange, Robusta coffee prices simultaneously decreased for all trading terms.
Robusta futures for July 2026 fell 45 USD/ton, equivalent to 1.22%, to 3,640 USD/ton. During the session, this contract at one point increased to 3,699 USD/ton but then turned around, hitting the lowest level of 3,634 USD/ton.
September 2026 futures fell 37 USD/ton, equivalent to 1.02%, to 3,592 USD/ton. Robusta futures for November 2026 fell 32 USD/ton, to 3,555 USD/ton.
For further terms, Robusta January 2027 decreased by 23 USD/ton, to 3,522 USD/ton; March 2027 term decreased by 21 USD/ton, to 3,493 USD/ton.
For Arabica, the New York Stock Exchange did not have a new trading session due to the US market’s Juneteenth holiday on June 19. Therefore, the updated price list on June 20 still reflects the closing level of the previous session.
Accordingly, Arabica for July 2026 futures stood at 275.10 US cents/lb; September 2026 futures at 267.80 US cents/lb and December 2026 futures at 257.90 US cents/lb.
Coffee price assessment
Robusta prices turned down after a period of strong recovery, in the context of the market seeing profit-taking activities and cautious sentiment in the face of supply prospects.
Previously, coffee prices were supported by concerns that prolonged rain in Brazil could slow down harvest progress. Rain during harvest time could cause difficulties for drying operations, while increasing the risk of reduced grain quality.
However, weather forecasts show that Brazil’s key coffee growing areas may move to a drier state. This helps reduce concerns about harvest progress and creates adjustment pressure on coffee prices.
Inventory on the ICE exchange continues to send mixed signals. Arabica inventory has decreased to 394.267 sacks, the lowest level in more than 2 years, thereby creating support for prices in the medium term.
Conversely, Robusta inventories have increased to more than 4,000 lots after falling to a 2-year low in May. The increase in the number of goods delivered to the standard warehouse system is one of the factors that could limit Robusta’s upward momentum.
In addition, the prospect of large supply continues to put pressure on the market. USDA/FAS forecasts that Brazil’s coffee production in the 2026/27 crop may reach a record level of 71.9 million bags, an increase of about 14% compared to the previous crop.
Rabobank also raised its global Arabica surplus forecast for the 2026/27 crop year from 7 million bags to 9.5 million bags. Meanwhile, Vietnam’s coffee exports continued to increase, continuing to supplement Robusta supply to the world market.
In terms of price support, the risk of El Niño affecting rainfall in Brazil during the coffee tree flowering period is still being monitored by businesses. However, the actual impact depends on the intensity and timing of this weather phenomenon.
Morgan Stanley and Goldman Sachs cut their forecast for oil prices towards the end of the year and 2027 following developments in the peace negotiations between the United States and Iran earlier this week.
Morgan Stanley now sees Brent crude averaging $80 per barrel in the last quarter of 2026, and $90 per barrel in the third quarter, Bloomberg reported, citing a note from the bank’s commodity team. Morgan Stanley’s earlier forecast was for an average of $100 per barrel of Brent in the third quarter, while the fourth-quarter price forecast was unchanged.
“Much is still to be negotiated, and key risks remain, but for now, this is a key step towards a de-escalation of the conflict and higher oil exports via the Strait of Hormuz,” the analysts said, expecting a speedy recovery in tanker flows once the strait is reopened.
Goldman Sachs, meanwhile, cut its price forecast for the fourth quarter to $80 per barrel from $90 per barrel, and the 2027 average forecast for Brent crude to $75 per barrel from $80 in earlier forecasts. According to the bank’s commodity analysts, tanker traffic via the Strait of Hormuz would recover fully by the end of July.
Citi is even more bearish than its peers on oil prices. On Monday, the bank cut its oil price forecast to $75 per barrel of Brent in the third quarter of this year, falling further to an average of $70 per barrel in the final quarter. For 2027, Citi expects an average Brent price of $65 per barrel. That’s down from an earlier 2027 forecast of $80 per barrel of Brent.
The international benchmark earlier this week fell to the lowest since early March following the news of a preliminary peace deal between Washington and Tehran. Set to be signed on Friday in Switzerland, the deal will see Iran reopen Hormuz within 30 days.
Brent dropped below $90 per barrel on the news earlier today, extending the loss to trade at $82.51 per barrel at the time of writing. WTI was trading at $80.23 per barrel.
By Irina Slav for Oilprice.com
Despite the potential for a bearish continuation, the next decision zone lies near the 78.6% Fibonacci retracement of the prior short-term advance at $4,102. If buyers respond positively there, signs of strength could emerge, leading to another bounce to test resistance. That would establish a new higher swing low and thereby create the potential for a double bottom pattern. An advance above this week’s high would trigger the reversal pattern.
However, the first area of resistance is marked by the 20-day moving average, currently near $4,356 and falling, since it was recently confirmed as dynamic resistance. After that, this week’s high at $4,382, which marks a lower swing high on the daily chart, is the next key structure resistance. A rally above that level would then target the 200-day moving average, currently around $4,468.
Alternatively, if the current support zone fails, the trend low of $4,023 will come at risk of being broken. Nonetheless, gold would then be approaching another potentially significant support area, highlighted by the recent bullish reaction and the confluence of several technical indicators. Most importantly, a long-term uptrend line currently converges near $4,000. Whether buyers step in there or support fails altogether should help determine if this correction is nearing completion or has further room to extend lower.
If you’d like to know more about how to trade gold and silver, please visit our educational area.
TradingKey – Since April 2025, copper prices have accumulated a gain of over 60%, with the core driving factor being the continuously growing market demand for copper amid the ongoing development of AI.
With the rapid development of AI in recent years, it has not only driven demand for chips, servers, and optical modules, but is also reshaping power systems, with copper being one of the most critical metals in power infrastructure.
On the demand side, AI data centers represent the most compelling source of incremental copper demand. AI training and inference place far higher demands on computing power, power supply, and heat dissipation than traditional data centers. Large-scale AI data centers require vast amounts of transformers, switchgears, busbars, cables, UPS, power distribution units, and cooling systems—all of which rely heavily on copper.
According to Wall Streetcn, a 1-gigawatt (GW) AI factory requires 50,000 metric tons of copper. Based on current industry projections of building 15 GW of capacity annually, data centers alone will add 750,000 metric tons of new copper demand each year. More importantly, AI data centers will further drive grid expansion, substation construction, and transmission and distribution line upgrades. This “external power infrastructure” could drive copper demand even more than the copper used inside the data centers themselves.
According to the IEA, global data center electricity consumption is projected to rise to approximately 945 TWh by 2030, roughly doubling current levels. Goldman Sachs also noted that the share of peak summer power demand from US data centers could rise from 4.1% in 2025 to 8.5% in 2027. This indicates that AI data centers are transitioning from marginal power loads into a critical variable shaping grid planning. As long as data centers continue to expand, investment in grid connections, transformers, transmission lines, and distribution equipment must keep pace, creating highly inelastic demand for copper in these segments.
In terms of the scale of copper demand, institutional forecasts are continuously being revised upward. S&P Global expects global copper demand to rise from 28 million metric tons per year in 2025 to 42 million metric tons per year in 2040, an increase of about 50%. Within this, copper demand from data centers is projected to grow from 1.1 million metric tons in 2025 to 2.5 million metric tons in 2040. BHP’s outlook emphasizes long-term trends, projecting that global data center copper usage will rise from around 500,000 metric tons per year today to approximately 3 million metric tons per year by 2050. Trafigura also believes that AI and data center-related demand could add an extra 1 million metric tons of copper demand by 2030. For a global copper market with an annual demand of roughly 20 million to 30 million metric tons, an incremental demand of this scale is enough to significantly alter the supply-demand balance.
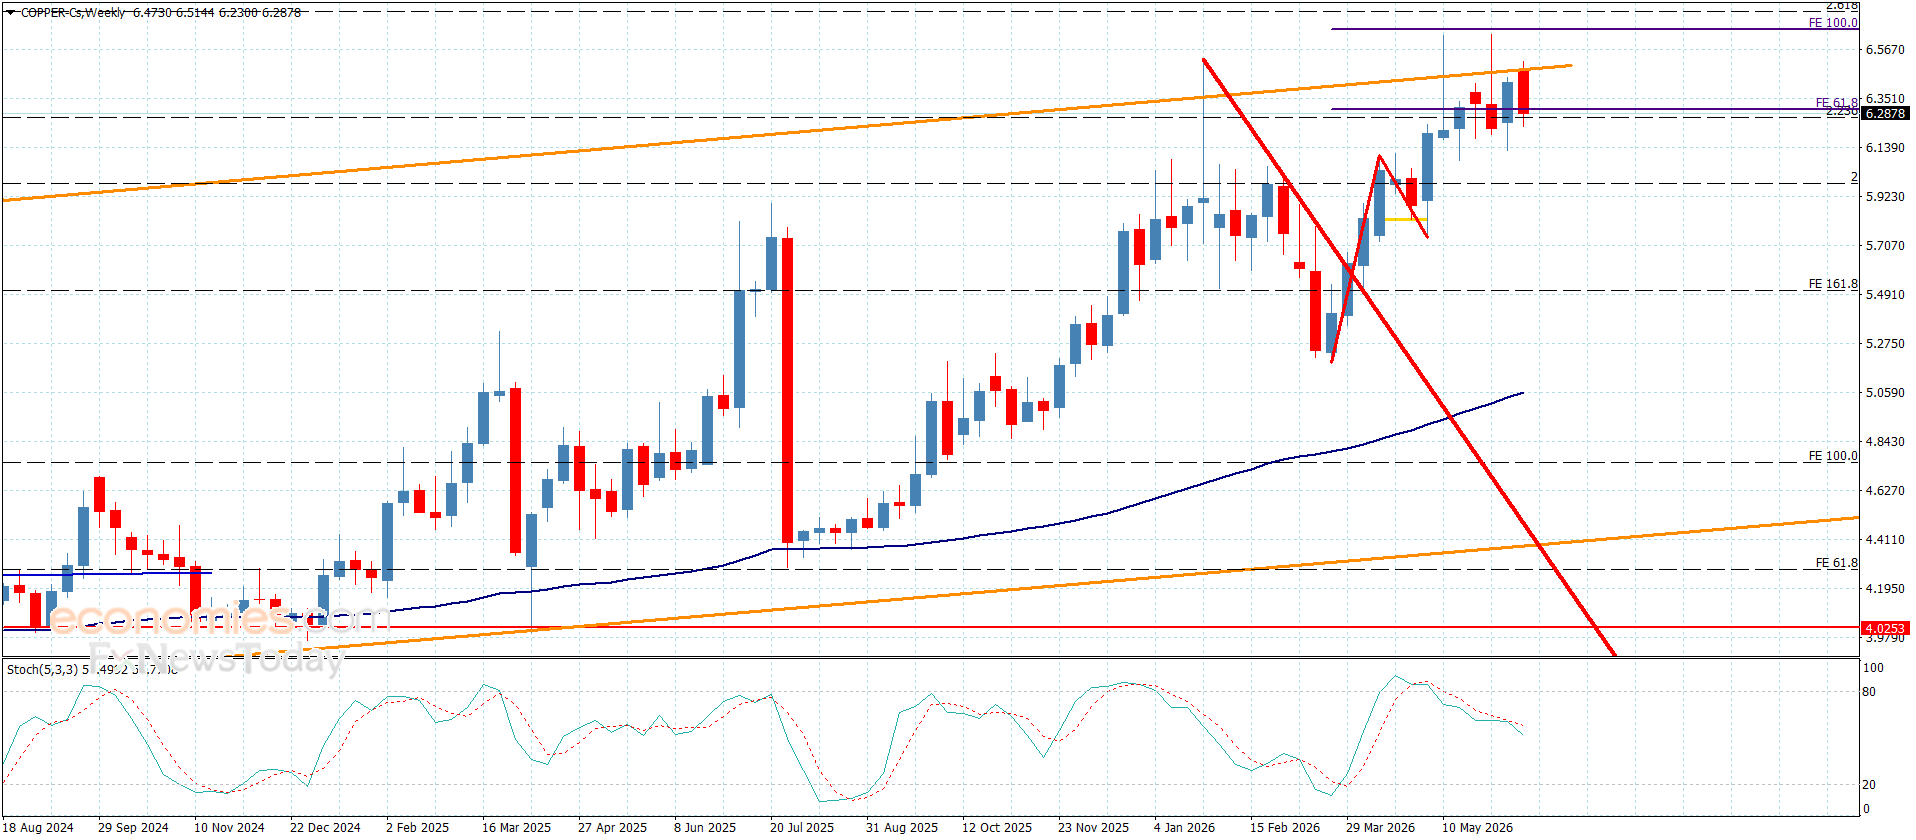
Weekly Copper Price Chart, Source: FASTBULL
On the weekly copper price chart, as the highs and lows of the candlestick chart gradually shift upward, it indicates that the overall trend maintains a strong upward momentum. Meanwhile, multiple moving averages in the moving average system maintain a bullish alignment, further confirming that the medium-to-long-term trend for copper prices remains bullish.
Currently, the primary target for copper’s upside is to test the Fibonacci 0.382 extension level of $14,233. If it can break through strongly and hold above this level, further upside room will be unlocked, with the potential to test the Fibonacci 0.5 extension level of $15,000.
Downside support should be noted at 13,400-13,300.
This content was translated using AI and reviewed for clarity. It is for informational purposes only.
Domestic coffee prices today
Coffee prices today in the domestic market simultaneously increased in key production areas. The average coffee price was recorded at 89,900 VND/kg, an increase of 400 VND/kg compared to the previous update.
In Dak Lak, coffee prices today reached 89,900 VND/kg, an increase of 300 VND/kg. Coffee prices in Gia Lai were also recorded at 89,900 VND/kg, an increase of 400 VND/kg.
In Lam Dong, coffee prices reached 89,700 VND/kg, an increase of 300 VND/kg and the lowest level among the surveyed areas.
Meanwhile, the old Dak Nong area had the highest coffee price, reaching 9,000 VND/kg, an increase of 400 VND/kg.
Thus, domestic coffee prices currently range from 89,000-9,000 VND/kg. The difference between the region with the highest and lowest prices is 300 VND/kg.
The USD/VND exchange rate according to Vietcombank was recorded at 26,090 VND/USD, an increase of 9 VND.
World coffee prices
World coffee prices fluctuated in opposite directions in the most recent trading session. Robusta prices on the London exchange maintained a slight increase, while Arabica prices on the New York exchange turned down.
On the London exchange, Robusta coffee futures for July 2026 reached 3,685 USD/ton, up 5 USD/ton, equivalent to 0.14%. During the session, this contract at one point increased to 3,736 USD/ton.
Robusta futures for September 2026 reached 3,629 USD/ton, up 7 USD/ton, equivalent to 0.19%. For November 2026, it reached 3,587 USD/ton, up 13 USD/ton, equivalent to 0.36%.
For further terms, Robusta in January 2027 reached 3,545 USD/ton, an increase of 20 USD/ton; the March 2027 term also increased by 20 USD/ton, to 3,514 USD/ton.
On the New York exchange, Arabica coffee futures for July 2026 fell 2.75 US cents/lb, or 0.99%, to 275.10 US cents/lb.
Arabica futures for September 2026 fell 4.10 US cents/lb, equivalent to 1.51%, to 267.80 US cents/lb. December 2026 futures fell 5.25 US cents/lb, to 257.90 US cents/lb.
The March and May 2027 terms decreased by 5.45 US cents/lb and 5.25 US cents/lb respectively, to 254.40 US cents/lb and 254.55 US cents/lb.
Notably, Arabica for July 2026 futures once increased to 285.75 US cents/lb in the session but then reversed to decrease. This development shows that profit-taking pressure appeared after the strong increase in coffee prices in previous sessions.
Coffee price assessment
World coffee prices have increased sharply in the past week and at times reached a 5-week high. However, the market reversed from a high in the session when the USD index increased sharply, promoting the liquidation of buying positions in the coffee market.
The rising USD often puts pressure on commodity prices valued in this currency, making purchasing costs more expensive for users of other currencies. This impact is more evident with Arabica, as contracts on the New York exchange simultaneously fell.
Weather in Brazil is still an important factor supporting coffee prices. Prolonged rain in some coffee growing areas raises concerns about slow harvest progress, and may affect drying and grain quality.
However, the prospect of drier weather in key coffee growing areas of Brazil next week has somewhat reduced concerns about harvesting activities, causing coffee prices to narrow their gains in the session.
Coffee inventory on the ICE exchange is also sending mixed signals. Arabica inventory decreased to 394.267 bags, the lowest level in more than 2 years, thereby continuing to support prices.
Conversely, Robusta inventory has increased to 4,032 lots, the highest level in more than 2 months. The increase in the amount of Robusta coffee put into the ICE standard warehouse system may limit the increase of this item.
El Niño risk is also continuing to be monitored by the market. According to NOAA, El Niño is present and is forecast to strengthen in the North hemisphere winter of 2026-2027. This phenomenon may change rainfall in coffee producing regions in South America and Asia.
However, the impact of El Niño on coffee trees also depends on the timing and level of weather changes in each region. The market is particularly interested in rainfall in Brazil in September and October, the period when coffee trees usually enter the flowering season.
On the side of putting pressure on prices, USDA/FAS forecasts that Brazil’s coffee production in the 2026/27 crop year may reach a record level of 71.9 million bags, an increase of about 14% compared to the previous crop year. Rabobank also raised its global Arabica surplus forecast from 7 million to 9.5 million bags.
Robusta supply from our country continues to be a noteworthy factor in the market. According to data from the Ministry of Finance, our country’s coffee exports in the first 5 months of 2026 reached 922,000 tons, an increase of 7.9% compared to the same period.
In general, coffee prices are being interspersedly affected. Low Arabica inventories, Brazilian weather risks and El Niño support prices; while the strong USD, the prospect of a large crop in Brazil and increased Vietnamese supply may limit the upward momentum.
Brent crude oil remains under limited and cautious gains during recent intraday trading, recovering part of its previous losses. The price has also eased its oversold conditions on relative strength indicators, which have now moved into overbought territory compared with price action. This suggests the beginning of a negative divergence, adding further downside pressure, especially with the indicators starting to show a bearish crossover.
Meanwhile, the price continues to face negative pressure from trading below the EMA50, while the short-term bearish trend remains dominant, limiting the chances of a sustained recovery.
The article covers the following subjects:
Consider short positions from corrections below the level of 80.45 with a target of 70.00–65.00.
Breakout and consolidation above the level of 80.45 will allow the asset to continue rising to the levels of 91.80–105.17.
A descending correction appears to have formed as the second wave of larger degree (2) on the weekly chart, with wave C of (2) completed as its part. On the daily time frame, an ascending third wave (3) is developing. Within it, the first wave of smaller degree 1 of (3) has formed, and a downward correction is unfolding as the second wave 2 of (3). Wave c of 2 is presumably developing on the H4 chart; within it, wave (v) of c is unfolding. If the presumption is correct, WTI will continue to decline to the levels of 70.00–65.00. The level of 80.45 is critical in this scenario as a breakout above it will enable the asset to continue rising to the levels of 91.80–105.17.
This forecast is based on the Elliott Wave Theory. When developing trading strategies, it is essential to consider fundamental factors, as the market situation can change at any time.
The content of this article reflects the author’s opinion and does not necessarily reflect the official position of LiteFinance broker. The material published on this page is provided for informational purposes only and should not be considered as the provision of investment advice for the purposes of Directive 2014/65/EU.
According to copyright law, this article is considered intellectual property, which includes a prohibition on copying and distributing it without consent.
There is no change in the bearish trend of natural gas prices, as the market continues to stabilize below the key barrier at $3.520. In addition, repeated trading below the 55-period moving average increases the likelihood of forming new bearish waves in the near term, targeting $2.920 initially and then the major support level at $2.620.
On the other hand, if the price succeeds in breaking above $3.520 and maintains stability above it, this would confirm a shift to a bullish trend. In that case, a strong upward rally could develop, with initial targets at $3.730 and $3.950, respectively.
The expected trading range for today is between $2.920 and $3.300
Trend forecast: Bearish
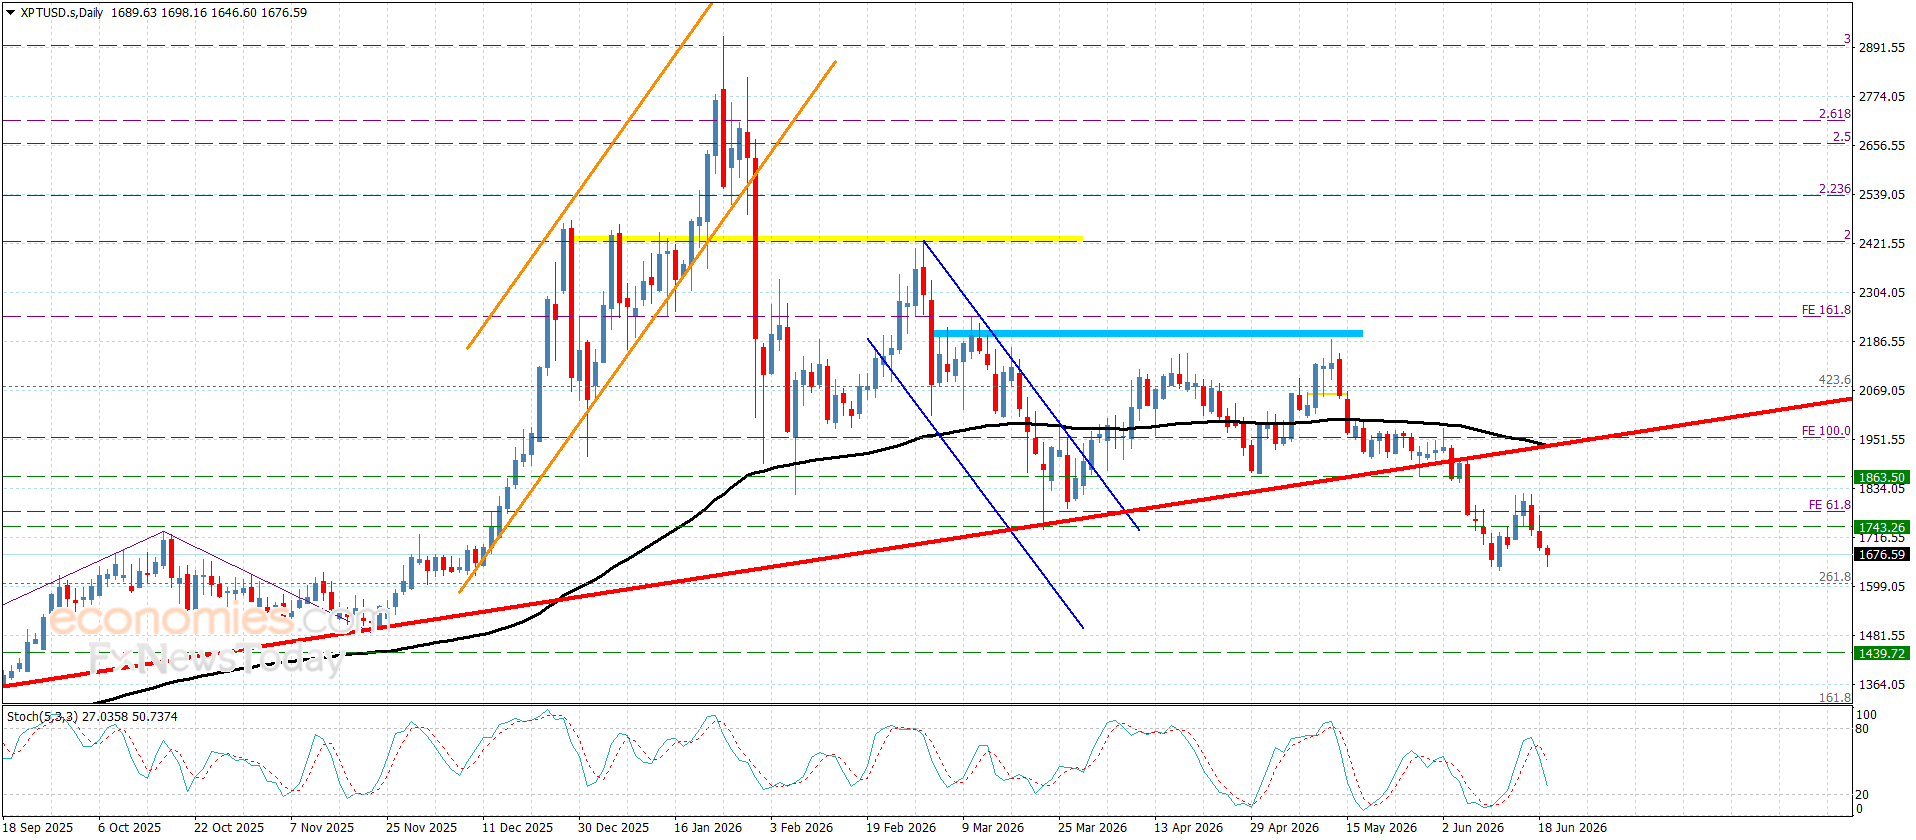
Platinum price formed several negative waves yesterday, benefiting from the alignment of the main indicators in providing negative momentum. As a result, the price has now reached the first target at $1,655.00, which has recently acted as an obstacle to further bearish movement.
The price may be forced to move sideways for a period in the short term. However, the continued presence of negative factors encourages expectations of a break below the current barrier, which would strengthen the chances of reaching additional bearish targets starting at $1,605.00 and then $1,565.00.
The expected trading range for today is between $1,605.00 and $1,745.00
Trend forecast: Bearish
Silver
traded at $68.91 per ounce on Thursday, June 18, 2026, up 1.5% on the day and
back above the 200 EMA it had broken just one week earlier. The reclaim
reverses the bearish signal that defined my last analysis and drops price back
inside the $66 to $89 consolidation that has framed the white metal since
February.
Wednesday’s
near 3% drop, triggered by a hawkish Federal Reserve, found a floor almost
exactly at the moving average that matters most.
The setup
now is simple. Silver sits at the bottom of a range it has refused to leave for
four months, and the next directional clue is the 50 EMA at $74. Until that
level breaks, very little has changed on the chart since February.
Follow
me on X for real-time silver market analysis: @ChmielDk
A week ago
I wrote that silver had broken below its 200 EMA and warned how low that could
take it, in my analysis of the 200 EMA breakdown. The chart has since flipped. Price
has climbed back above that average, and the consolidation between $66 support
and $89 resistance is live again.
The $66 to
$68 support zone coincides almost to the dollar with the 200 EMA, and that
confluence is what stopped Wednesday’s selloff. The upper boundary near $89
traces the local highs from early February, a level last tested in the first
half of May, which is what triggered the most recent leg down.
This is the
same range I mapped when silver crashed to the $70 floor for
the third time in
March. In 15+ years trading and analyzing metals at FinanceMagnates.com, 10 of
them spent covering silver’s every major break, a 200 EMA reclaim this fast
after a breakdown is rare, and you can read more of my metals work on my analyst page.
Silver is
trying to bounce, but the move higher has a ceiling: the 50 EMA sits near $74,
a meaningful distance above spot. That is the gate. The swing-trading principle
for range-bound markets is direct. As long as price holds between two
boundaries, it tends to travel from one to the other, so the path to $89 stays
open while $66 holds.
From
current levels, the upside to the top of the channel is roughly 30%. My
Fibonacci extension, stretched across the prior trend, puts the 100% level just
above the $89 boundary, which reinforces a target aligned with the dominant
trend. I do not rule that scenario out, but I want to see $74 taken first.
How high can silver go? XAG/USD daily chart with 50 and 200 EMA. Source: Tradingview.com
Key levels:
|
Level |
Type |
Notes |
|
$89 |
Resistance |
Upper |
|
$74 |
50 EMA |
The gate. |
|
$68 |
Spot / pivot |
Current |
|
$66-$68 |
Support / 200 EMA |
Confluence |
|
$62 |
Support |
March |
A close
back below $66 reopens the $62 March low and turns the chart bearish again. A
daily close above $74 is the trigger I am watching for the move toward $89.
Silver
climbed above $69 on Thursday after the US dollar retreated from the spike that
followed Wednesday’s Fed decision. President Donald Trump signed an interim
agreement to end the conflict with Iran and reopen the Strait of Hormuz, easing
the oil-driven inflation premium that has weighed on metals all year.
Lower crude
takes pressure off Treasury yields, and softer yields reduce the opportunity
cost of holding non-yielding silver.
The cap on
the rebound is monetary policy. Silver tumbled about 3% on Wednesday after the
Fed signaled growing support for rate hikes this year, with half of FOMC
members projecting that a hike may be needed.
New Fed
Chair Kevin Warsh declined to guide on the next move but stressed that
inflation has run above the 2% target for years. That hawkish tilt is why
silver bounced off support rather than ripping through resistance.
The drivers
behind the current move:
Sentiment
among chart-focused traders on X leans cautiously bullish, with the $66 zone
treated as the line in the sand.
“My
view remains bullish while price stays above $60,” said Jess, the trader
behind @JessXAUUSD, who flagged $71 as the breakout trigger
toward $77. That aligns with my own read: $66 holding keeps the bullish
structure intact, though I put the real gate higher, at the $74 50 EMA.
$xag #Gümüş takip ettiğimiz 66 bölgesinde yer alan mavi kutu desteğine geldi. Destekte tutunduktan sonra yükseliş yeniden devam edebilir.
71 tepesini kırdığında takip edeceğimiz dirençler 77-89 tepeleridir.
Bu bölge önemli, üzerlerinde kapanış yapıp kalıcılık… pic.twitter.com/NoD5W47UkQ— Kamile Uray (@remdocan) June 18, 2026
Kamile Uray
(@remdocan)
sees the same $66 support holding and points to $77 and $89 as the resistances
above a $71 break. The clustering around $89 from independent analysts is
notable, since it matches the top of my consolidation channel exactly.
The most
aggressive target comes from Dr. Potassium (@potassium_phd),
who wrote that silver’s “next target is $96.01, likely sometime in
June,” conditional on the October 2025 trendline holding as support. That
sits well above my channel, and I would need a clean $89 break to entertain it.
Silver 🥈 — $77.04 — still not out of dead cat bounce territory until getting at least above the 50% level of the prior daily candle, but looks promising that the October 2025 trend line will hold as support and that the sell-off is essentially over.
Could still be choppy for a… https://t.co/uU2GZMAIss pic.twitter.com/WfVtShejG2
— Dr. Potassium (@potassium_phd) May 18, 2026
Not
everyone is positioned for a breakout. “Silver is entering a multi-month
sideways consolidation between $60 and $75,” said Damodara Rao (@damodara_SEBIRA), arguing selling momentum is drying up while the market builds a base.
That range-bound thesis is closest to what my chart has shown since February.
Silver is entering a multi-month sideways consolidation between $60 and $75 as the previous parabolic uptrend cools down and selling momentum is also drying up which signals that the market lacks the pressure to break lower but needs time to build a new base. pic.twitter.com/73W7YC3nOP
— Damodara Rao (SEBI RA) (@damodara_SEBIRA) June 13, 2026
Janey (@Janey_Analyst)
framed an intraday long setup off the $67.65 area with short-term targets up to
$70.15, a near-term echo of the broader bullish-while-above-support structure.
#SILVER#XAGUSD Trading Setup – Buy Opportunity (1-Hour Chart)#XAGUSD is approaching a key demand zone, and buying power is emerging. As long as the price remains above the current market area, the bullish outlook remains valid.
Current Market Area: 67.6500
Technical Targets:… pic.twitter.com/XZPqfgWdgn
— Janey (@Janey_Analyst) June 8, 2026
The
forecast range for silver remains extraordinarily wide, and the spread between
X traders and institutions tells the story. Back in April I laid out the full institutional case from BofA,
Citi and Reuters as
COMEX inventory tightened. My own structure says the question is binary: hold
$66 and grind toward $89, or lose it and revisit $62.
|
Source |
Target |
Notes |
|
Damodara Rao (@damodara_SEBIRA) |
$60-$75 range |
June 2026, base-building consolidation |
|
Jess (@JessXAUUSD) |
$77 |
On a break above $71 |
|
Kamile Uray (@remdocan) |
$77, then $89 |
Resistances above a $71 break |
|
Dr. Potassium (@potassium_phd) |
$96 |
June |
|
Citigroup (Max Layton) |
$150 |
3-month |
|
HSBC |
$68.25 avg |
2026 average forecast |
My view on
each: Damodara Rao’s $60-$75 base is the scenario my chart most supports, since
silver has refused to leave this range since February. Jess and Uray’s $77 is
realistic but only after the $74 50 EMA falls, which neither flags explicitly.
Dr. Potassium’s $96 requires breaking $89 first, a level that has capped every
rally this year.
Citi’s $150 call was made in January near the $120
highs and looks stretched against current action. HSBC’s $68.25 average is almost exactly where silver
trades today, which makes it the most credible institutional anchor on the
board.
My chart
puts the immediate ceiling at $89, the top of the consolidation that has held
since February, roughly 30% above the $68.91 price on June 18. A daily close
above the $74 50 EMA is the trigger for that move. Independent X traders target
$77 to $96, while Citigroup’s January call of $150 looks stretched against
current action.
The 50 EMA
at $74 is the gate. Silver reclaimed its 200 EMA near $66 to $68 this week,
putting price back inside its range, but upside stays capped until $74 breaks
on a closing basis. Below, the $66 confluence floor is the line that keeps the
bullish structure intact.
Silver
dropped about 3% on Wednesday, June 17, after the Federal Reserve signaled
growing support for rate hikes in 2026, with half of FOMC members projecting a
hike may be needed. The hawkish tilt lifted the dollar and Treasury yields,
both headwinds for non-yielding silver, before a US-Iran deal reopening the
Strait of Hormuz sparked Thursday’s bounce.
The $66 to
$68 zone is critical support, coinciding almost exactly with the 200 EMA, and
it held on Wednesday’s selloff. A daily close below it reopens the $62 March
swing low as the next downside target. As long as $66 holds, the four-month
consolidation between $66 and $89 stays intact.
This is not
investment advice. Technically, silver sits at the bottom of its range, which
is where range traders look for long setups toward the $89 boundary, provided
$66 holds. The risk is a hawkish Fed forcing a close below support, which would
flip the chart bearish toward $62. Position sizing matters given silver’s
volatility .
Silver
traded at $68.91 per ounce on Thursday, June 18, 2026, up 1.5% on the day and
back above the 200 EMA it had broken just one week earlier. The reclaim
reverses the bearish signal that defined my last analysis and drops price back
inside the $66 to $89 consolidation that has framed the white metal since
February.
Wednesday’s
near 3% drop, triggered by a hawkish Federal Reserve, found a floor almost
exactly at the moving average that matters most.
The setup
now is simple. Silver sits at the bottom of a range it has refused to leave for
four months, and the next directional clue is the 50 EMA at $74. Until that
level breaks, very little has changed on the chart since February.
Follow
me on X for real-time silver market analysis: @ChmielDk
A week ago
I wrote that silver had broken below its 200 EMA and warned how low that could
take it, in my analysis of the 200 EMA breakdown. The chart has since flipped. Price
has climbed back above that average, and the consolidation between $66 support
and $89 resistance is live again.
The $66 to
$68 support zone coincides almost to the dollar with the 200 EMA, and that
confluence is what stopped Wednesday’s selloff. The upper boundary near $89
traces the local highs from early February, a level last tested in the first
half of May, which is what triggered the most recent leg down.
This is the
same range I mapped when silver crashed to the $70 floor for
the third time in
March. In 15+ years trading and analyzing metals at FinanceMagnates.com, 10 of
them spent covering silver’s every major break, a 200 EMA reclaim this fast
after a breakdown is rare, and you can read more of my metals work on my analyst page.
Silver is
trying to bounce, but the move higher has a ceiling: the 50 EMA sits near $74,
a meaningful distance above spot. That is the gate. The swing-trading principle
for range-bound markets is direct. As long as price holds between two
boundaries, it tends to travel from one to the other, so the path to $89 stays
open while $66 holds.
From
current levels, the upside to the top of the channel is roughly 30%. My
Fibonacci extension, stretched across the prior trend, puts the 100% level just
above the $89 boundary, which reinforces a target aligned with the dominant
trend. I do not rule that scenario out, but I want to see $74 taken first.
How high can silver go? XAG/USD daily chart with 50 and 200 EMA. Source: Tradingview.com
Key levels:
|
Level |
Type |
Notes |
|
$89 |
Resistance |
Upper |
|
$74 |
50 EMA |
The gate. |
|
$68 |
Spot / pivot |
Current |
|
$66-$68 |
Support / 200 EMA |
Confluence |
|
$62 |
Support |
March |
A close
back below $66 reopens the $62 March low and turns the chart bearish again. A
daily close above $74 is the trigger I am watching for the move toward $89.
Silver
climbed above $69 on Thursday after the US dollar retreated from the spike that
followed Wednesday’s Fed decision. President Donald Trump signed an interim
agreement to end the conflict with Iran and reopen the Strait of Hormuz, easing
the oil-driven inflation premium that has weighed on metals all year.
Lower crude
takes pressure off Treasury yields, and softer yields reduce the opportunity
cost of holding non-yielding silver.
The cap on
the rebound is monetary policy. Silver tumbled about 3% on Wednesday after the
Fed signaled growing support for rate hikes this year, with half of FOMC
members projecting that a hike may be needed.
New Fed
Chair Kevin Warsh declined to guide on the next move but stressed that
inflation has run above the 2% target for years. That hawkish tilt is why
silver bounced off support rather than ripping through resistance.
The drivers
behind the current move:
Sentiment
among chart-focused traders on X leans cautiously bullish, with the $66 zone
treated as the line in the sand.
“My
view remains bullish while price stays above $60,” said Jess, the trader
behind @JessXAUUSD, who flagged $71 as the breakout trigger
toward $77. That aligns with my own read: $66 holding keeps the bullish
structure intact, though I put the real gate higher, at the $74 50 EMA.
$xag #Gümüş takip ettiğimiz 66 bölgesinde yer alan mavi kutu desteğine geldi. Destekte tutunduktan sonra yükseliş yeniden devam edebilir.
71 tepesini kırdığında takip edeceğimiz dirençler 77-89 tepeleridir.
Bu bölge önemli, üzerlerinde kapanış yapıp kalıcılık… pic.twitter.com/NoD5W47UkQ— Kamile Uray (@remdocan) June 18, 2026
Kamile Uray
(@remdocan)
sees the same $66 support holding and points to $77 and $89 as the resistances
above a $71 break. The clustering around $89 from independent analysts is
notable, since it matches the top of my consolidation channel exactly.
The most
aggressive target comes from Dr. Potassium (@potassium_phd),
who wrote that silver’s “next target is $96.01, likely sometime in
June,” conditional on the October 2025 trendline holding as support. That
sits well above my channel, and I would need a clean $89 break to entertain it.
Silver 🥈 — $77.04 — still not out of dead cat bounce territory until getting at least above the 50% level of the prior daily candle, but looks promising that the October 2025 trend line will hold as support and that the sell-off is essentially over.
Could still be choppy for a… https://t.co/uU2GZMAIss pic.twitter.com/WfVtShejG2
— Dr. Potassium (@potassium_phd) May 18, 2026
Not
everyone is positioned for a breakout. “Silver is entering a multi-month
sideways consolidation between $60 and $75,” said Damodara Rao (@damodara_SEBIRA), arguing selling momentum is drying up while the market builds a base.
That range-bound thesis is closest to what my chart has shown since February.
Silver is entering a multi-month sideways consolidation between $60 and $75 as the previous parabolic uptrend cools down and selling momentum is also drying up which signals that the market lacks the pressure to break lower but needs time to build a new base. pic.twitter.com/73W7YC3nOP
— Damodara Rao (SEBI RA) (@damodara_SEBIRA) June 13, 2026
Janey (@Janey_Analyst)
framed an intraday long setup off the $67.65 area with short-term targets up to
$70.15, a near-term echo of the broader bullish-while-above-support structure.
#SILVER#XAGUSD Trading Setup – Buy Opportunity (1-Hour Chart)#XAGUSD is approaching a key demand zone, and buying power is emerging. As long as the price remains above the current market area, the bullish outlook remains valid.
Current Market Area: 67.6500
Technical Targets:… pic.twitter.com/XZPqfgWdgn
— Janey (@Janey_Analyst) June 8, 2026
The
forecast range for silver remains extraordinarily wide, and the spread between
X traders and institutions tells the story. Back in April I laid out the full institutional case from BofA,
Citi and Reuters as
COMEX inventory tightened. My own structure says the question is binary: hold
$66 and grind toward $89, or lose it and revisit $62.
|
Source |
Target |
Notes |
|
Damodara Rao (@damodara_SEBIRA) |
$60-$75 range |
June 2026, base-building consolidation |
|
Jess (@JessXAUUSD) |
$77 |
On a break above $71 |
|
Kamile Uray (@remdocan) |
$77, then $89 |
Resistances above a $71 break |
|
Dr. Potassium (@potassium_phd) |
$96 |
June |
|
Citigroup (Max Layton) |
$150 |
3-month |
|
HSBC |
$68.25 avg |
2026 average forecast |
My view on
each: Damodara Rao’s $60-$75 base is the scenario my chart most supports, since
silver has refused to leave this range since February. Jess and Uray’s $77 is
realistic but only after the $74 50 EMA falls, which neither flags explicitly.
Dr. Potassium’s $96 requires breaking $89 first, a level that has capped every
rally this year.
Citi’s $150 call was made in January near the $120
highs and looks stretched against current action. HSBC’s $68.25 average is almost exactly where silver
trades today, which makes it the most credible institutional anchor on the
board.
My chart
puts the immediate ceiling at $89, the top of the consolidation that has held
since February, roughly 30% above the $68.91 price on June 18. A daily close
above the $74 50 EMA is the trigger for that move. Independent X traders target
$77 to $96, while Citigroup’s January call of $150 looks stretched against
current action.
The 50 EMA
at $74 is the gate. Silver reclaimed its 200 EMA near $66 to $68 this week,
putting price back inside its range, but upside stays capped until $74 breaks
on a closing basis. Below, the $66 confluence floor is the line that keeps the
bullish structure intact.
Silver
dropped about 3% on Wednesday, June 17, after the Federal Reserve signaled
growing support for rate hikes in 2026, with half of FOMC members projecting a
hike may be needed. The hawkish tilt lifted the dollar and Treasury yields,
both headwinds for non-yielding silver, before a US-Iran deal reopening the
Strait of Hormuz sparked Thursday’s bounce.
The $66 to
$68 zone is critical support, coinciding almost exactly with the 200 EMA, and
it held on Wednesday’s selloff. A daily close below it reopens the $62 March
swing low as the next downside target. As long as $66 holds, the four-month
consolidation between $66 and $89 stays intact.
This is not
investment advice. Technically, silver sits at the bottom of its range, which
is where range traders look for long setups toward the $89 boundary, provided
$66 holds. The risk is a hawkish Fed forcing a close below support, which would
flip the chart bearish toward $62. Position sizing matters given silver’s
volatility .