Report Overview
The Global Beauty Supplements Market size is expected to be worth around USD 8.3 Billion by 2034, from USD 3.2 Billion in 2024, growing at a CAGR of 10.0% during the forecast period from 2025 to 2034. In 2024 North America held a dominant market position, capturing more than a 39.4% share, holding USD 1.2 Billion in revenue.
Beauty supplements sit at the intersection of nutrition, functional foods, and personal care—using ingestible formats like capsules, gummies, powders, and ready-to-mix sachets to support visible outcomes such as skin hydration, hair strength, and nail quality. The category’s “industrial story” is less about cosmetics counters and more about food-grade ingredient processing, compliant labeling, and a fast-moving contract manufacturing ecosystem.
- In the United States alone, FDA notes the dietary supplement market was worth more than $40 billion (2019), and the number of products expanded from about 4,000 (1994) to an estimated 50,000 to more than 80,000 (2019)—supported by a global supply chain that includes more than 10,000 facilities.

From an industrial scenario perspective, the category benefits from being built on the same manufacturing, ingredient, and regulatory backbone as the broader dietary supplement ecosystem—contract manufacturers, premix blenders, flavor houses, and testing labs—while borrowing branding and claim frameworks from beauty and functional foods. In the U.S., the dietary supplement industry’s overall economic impact in 2023 was $159 billion, supporting more than 615,000 jobs and generating $6.76 billion in state/local taxes and $10.7 billion in federal taxes.
Regulation and safety expectations are also shaping the industry’s direction. Codex has long provided global guidance for vitamin and mineral food supplements (CXG 55-2005), which supports harmonized approaches to quality and labeling. In the EU, nutrition and health claims for foods—including many supplement communications—are governed under Regulation (EC) No 1924/2006, pushing companies toward clearer substantiation and compliant wording. In India, FSSAI’s framework for health supplements and nutraceuticals similarly reinforces category definitions and compliance expectations.
Government and trusted regulatory frameworks are also shaping how the industry scales. In the U.S., companies introducing a new dietary ingredient must submit a premarket safety notification to FDA at least 75 days before marketing, which nudges innovation toward better-documented ingredients and cleaner dossiers.
The EU maintains a harmonized framework for food supplements through Directive 2002/46/EC, influencing permitted vitamin/mineral forms and labelling expectations across member states. In India, FSSAI has issued directives tied to the nutraceutical/health supplement framework (including 2022 directions), pushing clearer category definitions and compliance discipline in a fast-growing market.
Key Takeaways
- Beauty Supplements Market size is expected to be worth around USD 8.3 Billion by 2034, from USD 3.2 Billion in 2024, growing at a CAGR of 10.0%.
- Collagen Supplement held a dominant market position, capturing more than a 39.4% share.
- Tablets & Capsules held a dominant market position, capturing more than a 39.2% share.
- Skin Care held a dominant market position, capturing more than a 56.8% share.
- Online held a dominant market position, capturing more than a 38.9% share.
- North America emerged as the dominant region in the beauty supplements market, capturing 39.40% of global share and generating approximately US$1.2 billion.
By Type of Supplement Analysis
Collagen supplements lead with a 39.4% share, driven by strong demand for skin and hair health benefits.
In 2024, Collagen Supplement held a dominant market position, capturing more than a 39.4% share. This leadership was mainly supported by rising consumer focus on skin elasticity, anti-aging benefits, and overall beauty from within. Collagen supplements were widely used for improving skin firmness, reducing fine lines, and supporting hair and nail strength, making them a preferred choice among beauty-focused consumers. The segment also benefited from growing awareness of age-related collagen loss and the easy availability of collagen in powders, capsules, and ready-to-drink formats.
In 2025, demand remained stable as collagen supplements continued to be positioned as a daily wellness product rather than a short-term beauty solution. Strong adoption among working adults and aging populations further supported steady consumption. The segment’s dominance was reinforced by its compatibility with clean-label trends and routine beauty regimes, helping collagen supplements maintain a leading position within the beauty supplements market.
By Form Analysis
Tablets & capsules dominate with a 39.2% share, supported by ease of use and precise dosing.
In 2024, Tablets & Capsules held a dominant market position, capturing more than a 39.2% share. This strong position was mainly driven by consumer preference for convenient, easy-to-consume formats that fit well into daily routines. Tablets and capsules offered accurate dosage, longer shelf life, and better stability compared to liquid or powder forms, making them widely accepted across age groups. These formats were especially popular among working professionals and regular supplement users who value portability and consistency.
In 2025, demand remained steady as tablets and capsules continued to be trusted for delivering beauty nutrients such as collagen, vitamins, and antioxidants in a controlled manner. Their widespread availability through pharmacies and online channels further supported adoption. The segment’s leadership was reinforced by its cost efficiency, standardized formulations, and familiarity, allowing tablets and capsules to remain the preferred form in the beauty supplements market.
By Application Analysis
Skin care leads the market with a 56.8% share, driven by rising beauty awareness and daily wellness habits.
In 2024, Skin Care held a dominant market position, capturing more than a 56.8% share. This leadership was supported by strong consumer focus on maintaining healthy, youthful, and glowing skin through internal nutrition. Beauty supplements for skin care were widely used to support hydration, elasticity, and protection against early aging, making them a regular part of personal care routines. Growing awareness about the link between nutrition and skin health encouraged consistent usage across both younger and aging populations.
In 2025, demand continued as consumers increasingly preferred preventive skin care solutions rather than corrective treatments. Daily intake of skin-focused supplements became common due to changing lifestyles, higher stress levels, and environmental exposure. Easy availability and routine-based consumption further strengthened adoption. As skin appearance remained a key beauty priority, the skin care application continued to dominate the beauty supplements market with sustained consumer trust and usage.
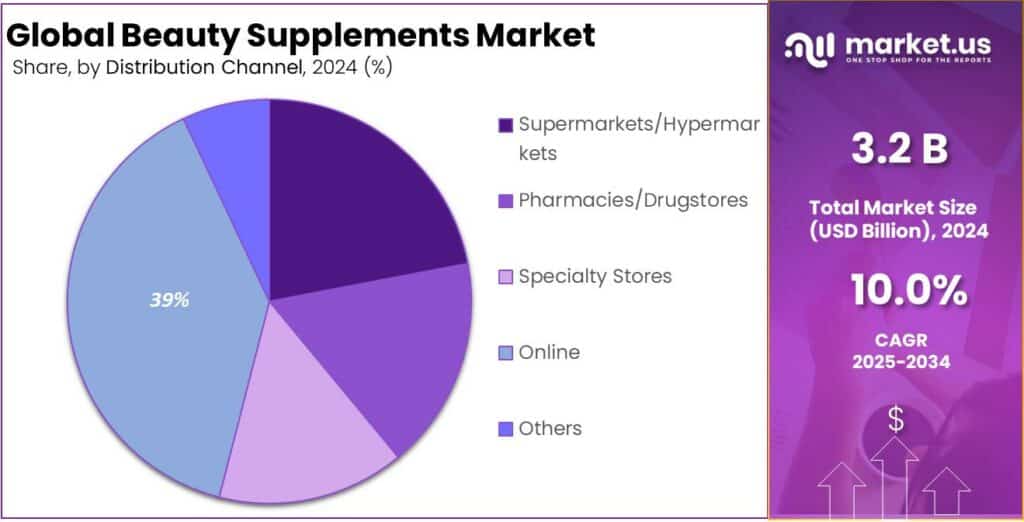
By Distribution Channel Analysis
Online channels lead with a 38.9% share, supported by easy access and growing digital buying habits.
In 2024, Online held a dominant market position, capturing more than a 38.9% share. This dominance was driven by the convenience of home delivery, wider product choice, and easy access to detailed product information. Consumers increasingly preferred online platforms to compare ingredients, read reviews, and choose beauty supplements that match personal needs. Subscription models and regular discounts further supported repeat purchases.
In 2025, online sales continued to grow as digital payment adoption and mobile shopping became more common. Social media promotion and influencer recommendations also played an important role in guiding purchase decisions. As trust in e-commerce platforms improved and delivery networks expanded, online channels remained the preferred distribution route for beauty supplements, supporting steady market growth.
Key Market Segments
By Type of Supplement
- Collagen Supplement
- Vitamins & Minerals
- Omega-3 Fatty Acids
- Antioxidants
- Probiotics
- Others
By Form
- Tablets & Capsules
- Powder
- Liquid
- Gummies & Chews
- Others
By Application
- Skin Care
- Hair Care
- Nail Care
- Others
By Distribution Channel
- Supermarkets/Hypermarkets
- Pharmacies/Drugstores
- Specialty Stores
- Online
- Others
Emerging Trends
Prebiotics, Adaptogens, and Sleep Support Enter Beauty Supplements
One of the latest trends in beauty supplements is the shift from single “beauty hero” ingredients to whole-body routines built around the gut–skin connection and everyday stress. The idea is practical: if digestion is off, sleep is poor, and stress is high, skin often looks tired and reactive—so brands are blending beauty goals with microbiome support, calming botanicals, and sleep-friendly stacks.
You can see this trend clearly in recent industry tracking from the Council for Responsible Nutrition (CRN). In its 2024 survey update, CRN reported that prebiotic use rose to 7% of supplement users in 2024, up from 5% in 2023. In the same survey release, ashwagandha reached 8% of supplement users in 2024, up from 2% in 2020. Melatonin use also remained elevated at 16% of supplement users.
CRN’s same update also highlights who is pushing this trend: it notes that women—especially younger women—are more likely than men to say they take supplements to enhance skin, hair, and nail health. That matters because younger buyers are also the ones most open to routine-stacking. Even spending is holding steady, which supports repeat buying: the median monthly spend among supplement users was $50 in 2024, while those buying from healthcare professionals reported a median monthly outlay of $100.
Regulatory and government guidance is shaping how this trend is communicated. In the U.S., FDA explains that structure/function claims on supplements are not pre-approved, but manufacturers must have substantiation that claims are truthful and not misleading, must submit a notification to FDA within 30 days after marketing, and must include the required disclaimer that FDA has not evaluated the claim. This pushes brands to be more careful with wording—so you see more “supports skin hydration,” “supports the skin barrier,” or “supports stress response,” instead of bold cure-like promises.
Drivers
Rising Everyday Supplement Use Is Pulling Beauty Supplements Into the Mainstream
One major driving factor for beauty supplements is simple: more people are already taking supplements as part of daily life, so “beauty-from-within” products feel like a natural add-on rather than a new habit. In the U.S., national health data shows that 57.6% of adults aged 20+ used at least one dietary supplement in the past 30 days (2017–2018). Usage is higher among women at 63.8%, compared with 50.8% among men. That matters because women are also the most consistent buyers of skin, hair, and nail solutions—so the base audience is already there, already familiar with capsules, powders, and gummies.
One major driving factor for beauty supplements is simple: more people are already taking supplements as part of daily life, so “beauty-from-within” products feel like a natural add-on rather than a new habit. In the U.S., national health data shows that 57.6% of adults aged 20+ used at least one dietary supplement in the past 30 days (2017–2018). Usage is higher among women at 63.8%, compared with 50.8% among men. That matters because women are also the most consistent buyers of skin, hair, and nail solutions—so the base audience is already there, already familiar with capsules, powders, and gummies.
Regulation and government-led oversight also supports this growth by pushing clearer rules and safer innovation, which builds consumer confidence over time. For example, in the U.S., a company that wants to market a new dietary ingredient generally must submit a premarket safety notification to the FDA at least 75 days before introducing it into interstate commerce. That encourages better documentation and slows down “wild” ingredient launches—important in a category where consumers expect both beauty results and safety.
In Europe, food supplement rules are anchored by Directive 2002/46/EC, which sets a structured framework around vitamins and minerals used in supplements and helps align expectations on labelling and composition. This kind of clarity supports wider retail distribution because retailers and brands can build products with fewer compliance surprises across markets.
Restraints
Safety & Regulation Challenges Restricting Growth of Beauty Supplements
One major restraining factor for beauty supplements is the ongoing concern about safety, effectiveness, and regulation of these products, which makes many consumers hesitant to buy or continue using them. Unlike conventional medicines, dietary supplements—including those positioned for skin, hair, and nail benefits—are not reviewed by regulators for safety or effectiveness before they come to market. In the United States, for example, the U.S. Food and Drug Administration (FDA) does not have the authority to approve dietary supplements for safety or effectiveness before they are sold to the public. That means companies can launch beauty supplement products without proving they actually work or are safe for everyone.
This regulatory gap contributes to a broader lack of consumer confidence. People who are thoughtful about their health often look for evidence-based results, but many beauty supplements lack strong clinical data showing they deliver the promised benefits. Even government-sponsored health resources like the National Institutes of Health Office of Dietary Supplements emphasize that supplements cannot replace a healthy, varied diet and that many products “need more study to determine if they have value.”
Another part of the problem is that regulatory systems do not require detailed ingredient verification or quality checks before products are sold. A U.S. Government Accountability Office review from 2008–2011 found 6,307 reports of health problems tied to dietary supplements, including issues like contamination and mislabeling. Some products had heavy metals or incorrect ingredient amounts listed on their labels—situations that can easily erode trust in the entire category.
At the policy level, this regulatory restraint is rooted in the Dietary Supplement Health and Education Act of 1994 (DSHEA), which allows products to be sold without pre-market safety or efficacy evaluation. Critics of DSHEA point out that this law means regulators can only act after a problem is identified, rather than preventing issues before they arise. While companies appreciate the flexibility it gives them, many healthcare professionals and public health advocates say it leaves consumers to navigate safety and effectiveness questions on their own.
Opportunity
Clinical-Backed, Personalized “Beauty-From-Within” Products Are the Biggest Growth Opportunity
A major growth opportunity for beauty supplements is to move from “pretty promises” to measurable, science-backed results—and then package those results into routines people can actually follow. The customer base is already huge. In the U.S., government health data shows 57.6% of adults (age 20+) used at least one dietary supplement in the past 30 days (2017–2018). Women reported higher use (63.8%) than men (50.8%). That’s a strong signal that the habit is mainstream, especially among the core audience for skin, hair, and nail benefits.
Regulatory structure is another reason this opportunity is real. In the U.S., if a company wants to market a supplement with a new dietary ingredient, it must submit a safety notification to FDA at least 75 days before the ingredient is introduced into interstate commerce. This pushes serious companies toward better safety files and tighter quality systems—exactly the kind of discipline that helps beauty supplements gain long-term trust.
In Europe, food supplements are anchored by Directive 2002/46/EC, which sets a clear framework (especially around vitamins and minerals used in supplements). That kind of rulebook supports cross-border scaling, retailer confidence, and more consistent product standards—helpful when you’re trying to build a repeat-purchase category like collagen, beauty gummies, or “skin barrier support” blends.
Large food and nutrition groups are already putting real weight behind the broader “health science” platform, which can spill over into beauty supplement innovation and distribution. Nestlé’s Health Science business reported CHF 5.0 billion in sales in 2024, showing how scaled the supplement ecosystem has become—and how much room there is for premium, science-led sub-categories like beauty-from-within.
Regional Insights
North America leads with 39.4% share and US$1.2 Bn in 2024, supported by high beauty awareness and strong consumer spending
In 2024, North America emerged as the dominant region in the beauty supplements market, capturing 39.40% of global share and generating approximately US$1.2 billion in revenue. The region’s leadership was underpinned by high consumer awareness of preventive health and internal beauty solutions, supported by widespread acceptance of supplements that target skin, hair, and nail health across diverse age groups. The United States, in particular, continued to be the largest contributor within the region, benefiting from advanced retail infrastructure, strong e-commerce penetration, and a culture that closely links wellness with aesthetic outcomes, especially through high-profile marketing and influencer engagement. ‘
North American consumers also show strong preference for science-backed, premium formulations with transparent ingredient sourcing, which has boosted demand for products such as collagen peptides and antioxidant blends. Retail availability through pharmacies, health stores, and online platforms made these products highly accessible, increasing repeat purchase frequency throughout 2024. Meanwhile, Canada reported steady growth as consumers embraced beauty supplements alongside broader preventive health trends.

Key Regions and Countries Insights
- North America
- Europe
- Germany
- France
- The UK
- Spain
- Italy
- Rest of Europe
- Asia Pacific
- China
- Japan
- South Korea
- India
- Australia
- Rest of APAC
- Latin America
- Brazil
- Mexico
- Rest of Latin America
- Middle East & Africa
- GCC
- South Africa
- Rest of MEA
Key Players Analysis
In 2024, Pfizer Inc. supported beauty and skin health segments through targeted nutraceutical products within its Consumer Healthcare business before divestitures. The company reported total revenue of USD 51.6 billion, with consumer health and nutrition-related sales estimated at ~USD 3.5 billion. Pfizer’s scientific research lent credibility to functional supplement claims.
In 2024, Meiji Holdings Co. expanded its beauty supplement portfolio in Japan and Asia with collagen and nutrient blends. The company recorded consolidated revenue of ¥1,273 billion (JPY), with its Nutrition & Health business contributing around ¥180 billion. Meiji’s strong domestic brand recognition supported product uptake across multiple age groups.
In 2024, Everest NeoCell LLC led in collagen and beauty-oriented supplement formulations, promoting peptides for skin, hair, and nail health. The company reported estimated revenue of USD 95 million, with collagen products constituting ~80% of sales. NeoCell’s focus on science-backed ingredient quality supported retailer placement and brand trust.
Top Key Players Outlook
- Amway
- Asahi Group Holdings
- HUM Nutrition Inc
- Pfizer Inc
- Meiji Holdings Co
- Everest NeoCell LLC
- Nestlé
- Nu Skin
- Meiji Holdings Co., Ltd.
- Herbalife International of America, Inc.
Recent Industry Developments
In 2024, Asahi Group Holdings, Ltd. engaged indirectly in the beauty supplements and wellness space through its broader food and functional nutrition activities, even though the company’s core business remains beverages and consumer foods. The group reported annual revenue of JPY 2.94 trillion in fiscal 2024, marking growth supported by strategic pricing and premium product focus across regions.
In 2024, Amway continued to shape the beauty supplements segment through its widely recognised Nutrilite brand, which remains central to the company’s nutrition and wellness strategy and influences its beauty-oriented offerings. Amway reported global sales of approximately USD 7.4 billion for the year ending December 31, 2024, with the nutrition category—dominated by vitamins, dietary supplements, and wellness solutions—accounting for 64 % of total sales, signalling strong consumer demand for health-linked and beauty-enhancing products.
Report Scope
 SOURCE: X


