The main category of Forex News.
You can use the search box below to find what you need.
[wd_asp id=1]
The main category of Forex News.
You can use the search box below to find what you need.
[wd_asp id=1]
Platinum price succeeded in forming a new bullish rally this morning, achieving the previously suggested main target by reaching $1973.00, facing a %161.8 Fibonacci extension level which forms strong barrier against bullish trading.
The stability of the trading below this barrier might activate the attempts of gathering some gains, to reach $1900.00 then attempts to test the extra support at $1860.00, while breaching the barrier and holding above it will ease the mission of recording new historical gains that might extend towards 2000.00 psychological barrier.
The expected trading range for today is between $1890.00 and $1970.00
Trend forecast: Fluctuated within the bullish track
Silver continues to trade near all-time highs, showing resilience even as other precious metals experience rotational pullbacks. Unlike gold, which is predominantly driven by monetary policy expectations and geopolitical hedging, silver benefits from a dual demand profile—acting both as a precious metal and a critical industrial input.
This unique positioning allows silver to sustain momentum during periods when gold consolidates. Current price behavior reflects acceptance at elevated levels, not rejection. Rather than sharply selling off from the highs, silver has transitioned into controlled consolidation, a hallmark of strong trending markets.
From a broader macro perspective, silver’s strength remains supported by:
As a result, silver has been able to hold premium pricing, keeping it near record levels while gold digests earlier gains.
Silver’s outperformance relative to gold is structural, not coincidental.
Silver plays a crucial role in:
This means silver demand persists even during periods of macro stabilization. Gold, by contrast, relies more heavily on fear-based or policy-driven flows.
Silver supply growth remains structurally constrained, with mine output struggling to keep pace with demand. Gold markets are deeper and more liquid, making silver more responsive to demand shocks and allowing trends to persist longer once momentum builds.
While both metals respond to inflation expectations, silver tends to outperform when growth and inflation risks coexist. Gold typically leads during crisis hedging phases; silver leads during inflationary expansion phases, which better describes the current environment.

Previous expectations for silver emphasized continuation rather than reversal, with pullbacks expected to remain corrective as long as structure held.

That view has been validated:
This confirms that recent price action reflects acceptance at higher value, not speculative excess.

From a technical standpoint, silver continues to validate bullish structure.
After the most recent impulsive rally, XAG/USD retraced into a clearly defined 4-hour Fair Value Gap (FVG) and reacted precisely as expected. Buyers stepped in aggressively, rejecting lower prices and pushing the market back into balance above the FVG.
This reaction confirms that:
Following the bounce, silver entered a tight consolidation just below recent highs. Rather than breaking down, price is coiling—suggesting liquidity absorption and position building, not exit.
As long as silver continues to hold above the 4-hour FVG, the probability favors directional expansion, not deeper rotation.

The bullish scenario remains favored if silver:
In this scenario:
This outcome aligns with:
A clean upside resolution would reinforce silver’s role as the higher-beta expression of precious metals strength.

The bearish scenario only develops if silver fails to hold the 4-hour FVG and price begins accepting below it.
If that occurs:
Importantly, this would still be viewed as rebalancing, not reversal, unless daily structure breaks decisively. As long as silver remains above major breakout levels on the daily chart, downside moves remain corrective in nature.
|
Factor |
Silver |
Gold |
|---|---|---|
|
Industrial Demand |
High |
Minimal |
|
Inflation Sensitivity |
High |
Moderate |
|
Supply Constraints |
Tight |
More Flexible |
|
Volatility |
Higher |
Lower |
|
Trend Acceleration |
Faster |
Slower |
This structural advantage explains why silver continues to hold near all-time highs while gold consolidates.
Silver’s strength is not accidental. It is driven by structural demand, constrained supply, and favorable macro conditions.
The clean reaction from the 4-hour FVG and ongoing consolidation near highs suggest the market is preparing for its next expansion, not rolling over. As long as price holds above key value zones, the broader bullish narrative remains intact.
Silver continues to lead—not lag—the precious metals complex.
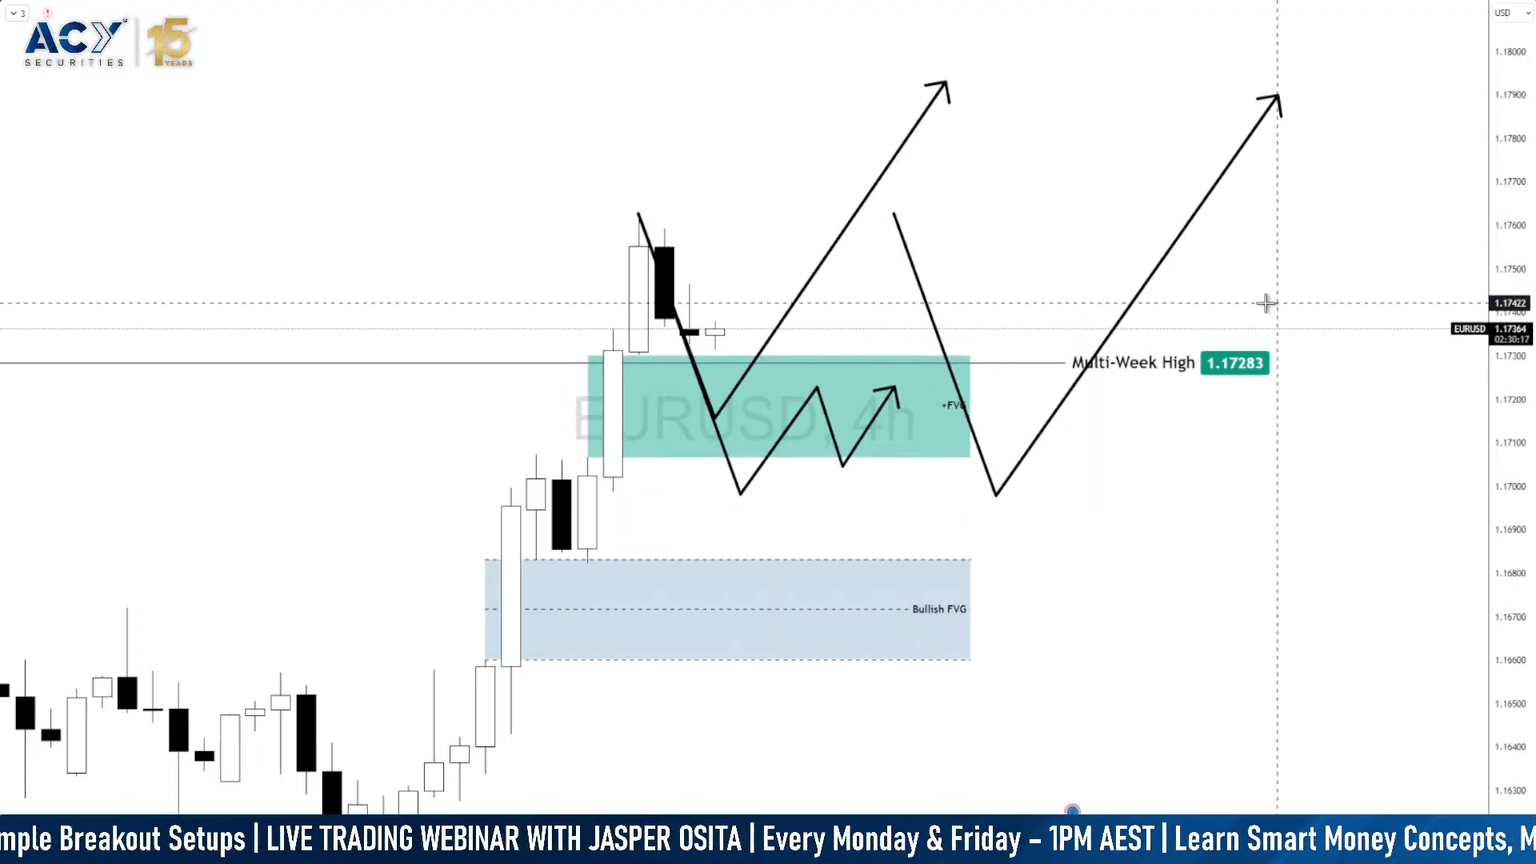
EUR/USD is currently transitioning from impulsive expansion into balance, consolidating above the 1.1728 multi-week high. This behavior reflects acceptance at higher prices, rather than exhaustion or trend failure.
After reclaiming a key structural level, the market has paused to allow two-sided trade — a natural and healthy process in trending environments. Importantly, price has not collapsed back below prior resistance, nor has it shown aggressive distribution. Instead, EUR/USD is oscillating within a defined range, signaling re-pricing rather than rejection.
From a macro perspective, this consolidation is occurring against a backdrop of persistent USD softness. The Federal Reserve’s shift toward rate cuts and a more data-dependent stance has reduced the dollar’s yield advantage, while expectations for aggressive ECB easing remain restrained. This narrowing policy divergence continues to favor EUR/USD on a medium-term basis.
As a result, the current price action should be viewed as digesting gains, not undoing them.

The prior EUR/USD forecast did not call for immediate continuation higher. Instead, it emphasized that acceptance above the multi-week high would be more important than chasing momentum.
Specifically, the expectation was for:
That scenario has materialized cleanly.

Following the breakout, EUR/USD pulled back into the highlighted re-pricing zone, held above the multi-week high, and formed higher lows rather than accelerating lower. Sellers failed to force acceptance back below prior resistance, while buyers consistently absorbed downside pressure.
This confirms that the breakout was structural, not false. The current consolidation reflects controlled digestion, aligning with the original expectation that the market would pause before determining its next expansion leg.
In short, the market followed process, not prediction — rewarding patience and structural alignment rather than aggressive positioning.
EUR/USD is now trading inside a defined range, with both buyers and sellers actively participating. In this environment, the most important reference is no longer the highs or lows — but equilibrium, or the middle of the range.
Equilibrium represents fair value. How price behaves around this level reveals intent.
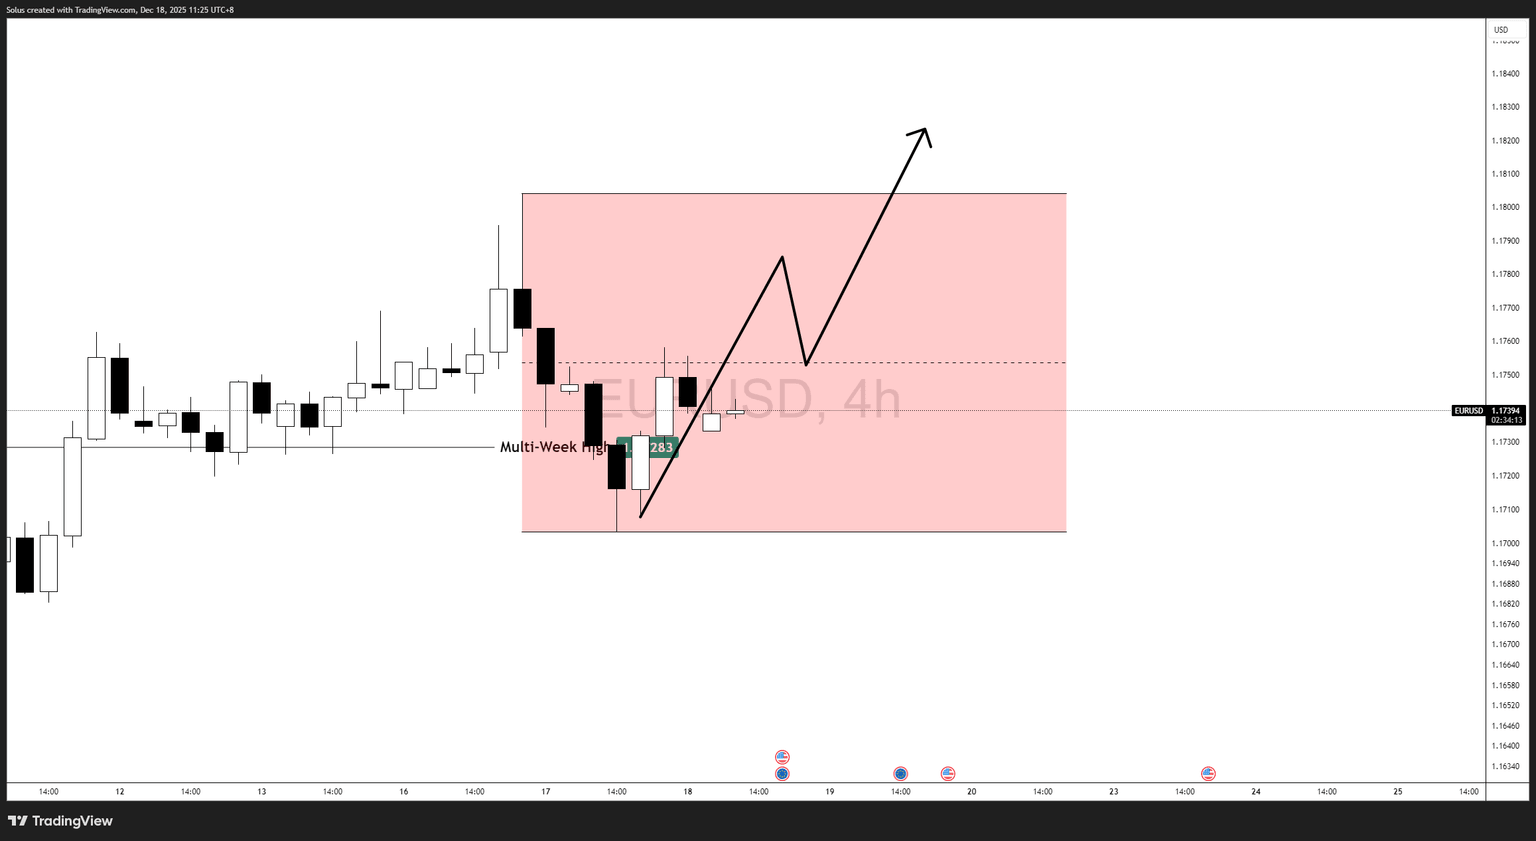
The bullish scenario re-engages if EUR/USD breaks above the equilibrium level and holds above it.
Acceptance above the midpoint of the range signals that buyers are willing to transact at premium prices, not just defend the lows. In strong trends, equilibrium often acts as a launchpad, not resistance.
If price reclaims equilibrium and stays above it:
Bullish expectation:
Rotation toward the range high, followed by a potential continuation toward new multi-week highs if momentum builds.
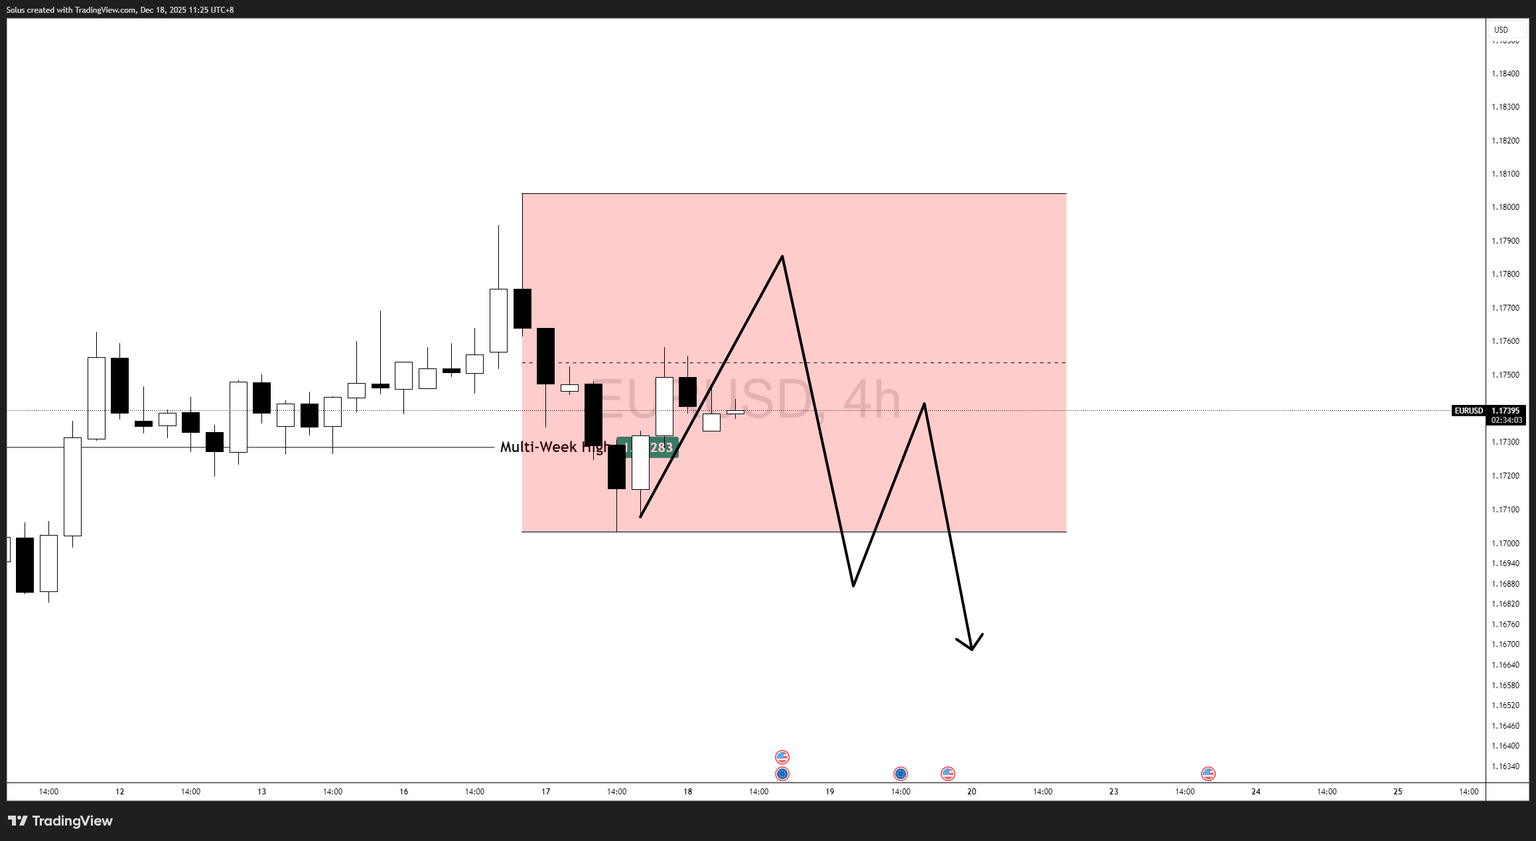
The bearish scenario develops if EUR/USD fails to reclaim equilibrium and consistently trades below the midpoint of the range.
In this case, equilibrium acts as resistance, suggesting sellers control fair value. This would likely lead to:
However, it is critical to distinguish correction from reversal. Even a sustained move below equilibrium would still be considered rebalancing, unless broader daily structure breaks decisively.
EUR/USD is not weakening — it is pausing with structure intact.
The market is currently balanced, and equilibrium is the line that separates continuation from deeper correction. Acceptance above it favors renewed strength, while failure keeps price rotational.
Until that decision is made, patience remains the edge.
A new higher swing high for the short-term advance at $4,353 was reached last Friday, resulting in three tight days of consolidation near that high. Wednesday’s high of $4,349 marked the third recent test of that resistance zone. A decisive breakout above triggers resolution of the four-day range and continuation of the short-term uptrend. Retained bullish momentum thereafter positions gold for a new trend high breakout above $4,381.
The bull trend in gold has been rebounding from an October retracement low of $3,886 with strength confirmed by breakouts above the 20-day and 10-day averages, subsequently defended as support during pullbacks. The advance also delivered a second bull breakout of two rising trend channels—one long-term and the other measuring the advance begun in March 2024—after the first October attempt failed and produced the brief bearish correction.
Gold is expected to resolve to the upside if it remains above the key dynamic support area. The 10-day average at $4,256 is rising and about to advance above the top of the shorter channel. Momentum has been lacking overall during the recent advance, but momentum could be triggered once the 10-day average meets up with price. In its current location, it represents potential support along with the top channel line and near-term uptrend line, which cross in a day. Three indicators identifying a similar potential support area strengthens its significance either as support or a pivot that breaks to the downside.
Gold’s persistent tight range near the $4,353 high and advancing averages keep the bull case dominant with buyers positioned to deliver the strongest close in months. Clearance of $4,353–$4,381 unlocks new record territory; hold the converging 10-day/channel/uptrend support on any weakness and the path of least resistance stays higher.
For a look at all of today’s economic events, check out our economic calendar.
The GBP/USD exchange rate dropped by 0.75% on Wednesday after the UK published encouraging consumer inflation data. Sterling dropped to a low of 1.3327, down from this week’s high of 1.3460.
The GBP/USD exchange rate pulled back and erased some of the recent gains as investors reacted to the latest UK inflation data. This also explains why the UK bond yields dropped as the FTSE 100 Index rose.
A report by the Office of National Statistics (ONS) showed that the headline Consumer Price Index (CPI) dropped from 3.5% in October to 3.2% in November.
UK’s inflation dropped by minus 0.2% on a MoM basis after rising by 0.3% in the previous month.
Meanwhile, core CPI, which excludes the volatile food and energy prices, dropped by 0.1% on a MoM basis, bringing the annual inflation figure to 3.2%.
More data shows that the retail price index (RPI) dropped from 4.3% to 3.8%, while the Producer Price Index (PPI) dropped from 3.6% to 3.4%.
These numbers mean that the country’s inflation is moving in the right direction, a move that confirms that the Bank of England will cut interest rates by 0.25% in the final meeting of the year on Thursday this week.
The BoE has delivered several interest rate cuts in the past few months, moving from a high 5.25% in August 2024 to the current 4%. As such, a cut will bring the headline interest rates to 3.75%, even as the inflation remains above 2%.
The bank will cut rates as the economy has remained under pressure in the past few months. For example, a report released on Tuesday showed that the unemployment rate rose to 5.1% from the previous 5.0%. The average earnings with bonus dropped to 4.7% from the previous 4.9%.
The next important catalyst for the GBP/USD exchange rate will be the upcoming US consumer inflation report, which will come out on Thursday.
Economists polled by Reuters and Bloomberg expect the upcoming US inflation report will come in at 3.0%, much higher than the Federal Reserve’s target of 2.0%.
Data compiled by Polymarket also places the odds of inflation coming in at 3.0% rising to 44%. It is followed by 3.1%, which is at 42%.
The US inflation report comes a week after the Federal Reserve delivered the third interest rate cut of the year and pointed to one more in 2026.

The daily timeframe chart shows that the GBP/USD exchange rate rose from the psychological level of 1.3000 in November to a high of 1.3460.
It pulled back to a low 1.3327, its lowest level on October 10. It has dropped to the 50-day and 100-day Exponential Moving Averages.
The pair has formed an inverse head-and-shoulders pattern, which is a common bullish reversal sign. Therefore, the pair will likely rebound as bulls target the next psychological level at 1.3500. A move above that level will point to more gains, potentially to the year-to-date high of 1.3725
The post GBP/USD forecast as odds of BoE interest rate cut jump on Polymarket appeared first on Invezz
Tuesday’s decline was confirmed with a daily close below both dynamic trend indicators, but Wednesday’s swift response turned it into a potential false breakdown. The completion of the key Fibonacci retracement, together with this quick reclaim, suggests a counter-trend rally may have started. Tuesday marked the seventh consecutive day of lower daily highs and lows that followed a minor three-year high of $5.02 reached earlier this month.
The 50-day average was broken a week ago Tuesday, followed by a drop through the lower trendline of a rising channel that accelerated the decline to the 200-day average. Sharp moves commonly follow failed breakouts, and the rapid recovery on Wednesday fits that classic pattern.
The most obvious potential resistance zone if natural gas continues strengthening short-term spans from a November swing low of $4.09 up to the 50% retracement at $4.32. Included within that band is the 50-day average at $4.26 currently, while the falling 20-day average at $4.34 will soon enter the range. The 38.2% Fibonacci retracement also sits inside at $4.15. A swing back to test prior support areas as resistance is a natural progression following the breakdown of an advancing trend channel.
Key near-term support now rests at Wednesday’s low of $3.69; a drop below shows weakness rather than additional strength. A rally above Monday’s high of $3.92 further confirms the bullish reversal and raises odds that the higher resistance zone gets tested on this bounce.
Natural gas has flipped from a confirmed breakdown of the 200-day average with Tuesday’s close below the average, to a potential false breakdown with the rapid reclaim of the 200-day average and trendline off the 61.8% Fib completion. Hold $3.69 and push above $3.92 to target $4.09–$4.32; failure to defend current lows re-exposes deeper correction, while the counter-trend rally case stays favored until proven otherwise.
For a look at all of today’s economic events, check out our economic calendar.
Silver extended its explosive 2025 rally on Wednesday, December 17, 2025, pushing deeper into record territory as momentum traders, industrial buyers, and macro investors piled into the “white metal” at the same time.
At roughly 12:17 (time-stamp on live pricing feeds), spot silver (XAG/USD) traded around $66.35 per ounce, up about 4% on the session, with the day’s range stretching from roughly $63.68 to $66.56. [1]
That move came after silver briefly cleared $66 and set a fresh all-time high around $66.52/oz, according to Reuters, as markets reacted to a softer labor-market narrative, shifting rate expectations, and a broader bid across precious metals. [2]
The live tape tells the story of a market in “price discovery” mode:
Silver’s surge is also happening in a broader “white metals” upswing: Reuters reported platinum hitting a 17-year high and palladium moving higher in the same risk-on/rate-cut setup, reinforcing the sense that investors are rotating across the complex rather than treating this as a silver-only story. [7]
Silver is unusual because it trades like both a precious metal and an industrial input. This week’s price action reflects all of that “dual identity” firing at once.
Silver doesn’t pay interest, so the metal tends to benefit when markets expect lower policy rates and easier financial conditions.
Reuters tied Wednesday’s push to renewed expectations of U.S. Federal Reserve easing after signs of labor-market softening and investor positioning for additional 2026 cuts. The same Reuters report also pointed to safe-haven support stemming from heightened geopolitical tension around Venezuela. [8]
A major theme in the latest round of analysis is that silver’s rally isn’t only “paper-driven.” Analysts argue the physical side is strained—then gets even tighter when investment products absorb metal.
An Investing.com analysis highlighted how silver-backed ETPs (exchange-traded products) have added an estimated 187 million ounces in 2025 (an ~18% increase in holdings), and emphasized that metal held in ETPs is effectively removed from the pool available to industry and some settlement flows. [9]
Trefis echoed the same core mechanism: once ETF flows flip positive, “paper demand” can turn into a real-world price accelerant because physical inventory has to be sourced and warehoused. [10]
Beyond the macro and flows story, silver’s bullish case still leans heavily on industrial use—especially as electrification and “green tech” expand.
A key policy tailwind in the background: the U.S. Geological Survey notes that the final 2025 U.S. critical minerals list adds silver among the newly included minerals, tying the metal more explicitly to supply-chain security and strategic planning. [11]
That designation doesn’t automatically change supply/demand overnight, but it can reshape how market participants talk about silver—particularly around inventories, sourcing, and the longer-run importance of reliable supply.
Below is the clearest “through-line” from the most recent coverage and commentary published since December 15, 2025—the window you requested.
Forecast chatter turned more aggressive. Technical and macro-focused market commentary argued that silver’s momentum was being reinforced by supportive macro conditions and policy narratives.
How this mattered for price: Dec. 15 reads like the point where a lot of market commentary stopped treating silver as a “catch-up trade” and started treating it as a standalone leadership trade—which can feed momentum when positioning is underbuilt.
As silver consolidated and traders debated how much of the move is “fundamental” versus “flow-driven,” bank research introduced an important counterweight:
Meanwhile, mainstream market trackers continued to anchor the move in eye-catching spot levels: Fortune’s commodity snapshot (Dec. 16) put silver at about $63.37/oz at 8:30 a.m. ET, underscoring how elevated prices already were even before Wednesday’s fresh highs. [17]
How this mattered for sentiment: When a market is ripping higher, the most important “bearish” inputs often aren’t outright negative calls—they’re reasons the upside might slow. Morgan Stanley’s argument effectively says: even if precious metals stay strong, silver’s 2026 incremental demand may not be as one-way as the 2025 narrative suggests. [18]
On Wednesday, silver moved from “strong” to “headline” again:
In short: Dec. 15 built the narrative, Dec. 16 introduced pushback, and Dec. 17 confirmed the market still wants higher prices.
Forecasting silver right now is less about pinning down a single number and more about mapping scenarios—because silver’s volatility cuts both ways.
Two separate strands of coverage converged on the same milestone:
What would likely support a push to $70: cooling inflation surprises, weaker real yields, continued ETF/ETP inflows, and sustained physical tightness.
What could block it: a sharp rebound in the U.S. dollar, hotter inflation prints that force repricing of rate cuts, or aggressive profit-taking after such a rapid run.
This is where forecasts start to diverge.
The bullish camp:
INN’s Dec. 15 forecast roundup emphasizes the idea of a persistent structural supply deficit and argues that even if deficits shrink, they can still underpin prices—especially if investment demand remains firm. [23]
A separate, more aggressive public-market forecast surfaced via Barron’s reporting from a December 2025 event: strategist Mary Ann Bartels (Sanctuary Wealth) floated $80–$100/oz as a potential silver range in her 2026 outlook remarks. [24]
The cautious institutional view:
Morgan Stanley’s note (via Reuters) is a reminder that silver’s 2025 setup may not repeat cleanly: the bank expects silver to underperform gold and flags the possibility that the supply deficit peaks in 2025, partly due to falling solar installations in 2026. [25]
How to reconcile these:
Silver’s addition to the U.S. critical minerals list is not a day-to-day trading signal—but it can influence policy focus, permitting priorities, and the way investors frame long-term supply risk.
USGS explains that the final list identifies minerals vital to the U.S. economy and national security that face potential supply disruption risks, and that the 2025 update added silver among other minerals. [26]
That policy backdrop is one reason the metal is increasingly discussed in the same breath as other strategic inputs used in electrification and advanced manufacturing—even as it remains a traditional precious metal.
Silver is now so headline-driven that the next major macro print can matter as much as physical-market signals.
1) U.S. inflation data (CPI and PCE)
Reuters notes markets are looking to upcoming releases—CPI and PCE—as the next major inputs into rate expectations and, by extension, precious metals pricing. [27]
2) The path of Fed cuts into 2026
Reuters reported that investors are pricing two 25-basis-point cuts in 2026, reinforcing the macro tailwind for non-yielding metals. [28]
3) ETP/ETF flows and inventory signals
If the “ETP absorption” story continues at scale, it can keep the market tight. If flows reverse, the same channel can amplify downside volatility. [29]
4) Industrial demand signals (especially solar-linked)
Morgan Stanley’s caution about solar installations in 2026 is a reminder that not all industrial demand is guaranteed to accelerate indefinitely. [30]
As of 12:17 today, silver is trading like a market where macro tailwinds (rate-cut bets), policy narratives (critical mineral status), and real-world constraints (tight physical supply plus investment absorption) are reinforcing each other—pushing XAG/USD to fresh records above $66/oz. [31]
The near-term “number” most analysts and traders keep circling is $70/oz, but forecasts for 2026 are increasingly split between very bullish upside cases and more cautious bank research that argues silver’s strongest deficit dynamics may cool. [32]
1. www.investing.com, 2. www.reuters.com, 3. www.investing.com, 4. www.investing.com, 5. www.reuters.com, 6. www.reuters.com, 7. www.reuters.com, 8. www.reuters.com, 9. www.investing.com, 10. www.trefis.com, 11. www.usgs.gov, 12. www.fxleaders.com, 13. www.investing.com, 14. investingnews.com, 15. www.trefis.com, 16. www.reuters.com, 17. fortune.com, 18. www.reuters.com, 19. www.reuters.com, 20. www.reuters.com, 21. www.reuters.com, 22. www.fxleaders.com, 23. investingnews.com, 24. www.barrons.com, 25. www.reuters.com, 26. www.usgs.gov, 27. www.reuters.com, 28. www.reuters.com, 29. www.investing.com, 30. www.reuters.com, 31. www.investing.com, 32. www.reuters.com
Copper price continued providing positive closing, taking advantage of its stability within the main bullish channel levels, surpassing the negativity of the intraday indicators by its stability above $5.1300 support.
Stochastic fluctuating near 80 level makes us expect to begin forming bullish waves to reach $5.5000, and surpassing it will open the way for achieving extra gains that may begin at $5.6300 and $5.7400.
The expected trading range for today is between $5.2000 and $5.5000
Trend forecast: Bullish
– Written by
Ben Hughes
STORY LINK British Pound to Dollar Forecast: GBP/USD Weighed by Dovish BoE Expectations
The Pound to US Dollar exchange rate (GBP/USD) retreated on Wednesday, sliding to its lowest level in a week after softer-than-expected UK inflation data fuelled expectations of a Bank of England (BoE) interest rate cut.
At the time of writing, GBP/USD was trading around $1.3351, down roughly 0.5% on the day.
The Pound (GBP) came under notable pressure after the UK’s latest consumer price index revealed a sharper slowdown in inflation than markets had anticipated.
Headline CPI fell from 3.6% in October to 3.2% in November, undershooting forecasts for a more modest easing to 3.5%. Core inflation also surprised on the downside, slipping from 3.4% to 3.2% instead of holding steady.
The softer inflation data reinforced conviction that the Bank of England will cut interest rates at Thursday’s policy meeting. It also strengthened bets that policymakers may pursue a more aggressive easing cycle in early 2026, prompting Sterling to weaken as rate cut expectations were repriced.
The US Dollar (USD), meanwhile, found some support on Wednesday as markets modestly scaled back expectations for near-term Federal Reserve rate cuts.
Although recent US labour market indicators continue to point to cooling conditions, November’s non-farm payrolls report proved less negative than feared. This led to a slight recalibration of Fed policy expectations, helping the Dollar regain some ground.
Get better rates and lower fees on your next international money transfer.
Compare TorFX with top UK banks in seconds and see how much you could save.
Additional support for the ‘Greenback’ came from softer risk appetite, with investors seeking safety amid rising tensions between the US and Venezuela.
Attention now turns to the Bank of England’s interest rate decision on Thursday, which is set to be the key driver for GBP/USD.
While a rate cut is widely expected and largely priced in, Sterling’s reaction will depend heavily on the BoE’s guidance. A clearly dovish tone — signalling scope for multiple rate cuts in 2026 — could leave the Pound vulnerable to renewed selling pressure.
In the US, focus will shift to the latest consumer price index. Evidence that inflation remains sticky may help underpin the US Dollar, while signs of a clearer slowdown in price growth could sap USD demand and add volatility to the pairing.

International Money Transfer? Ask our resident FX expert a money transfer question or try John’s new, free, no-obligation personal service! ,where he helps every step of the way,
ensuring you get the best exchange rates on your currency requirements.
TAGS: Pound Dollar Forecasts
Based on recent performance, the EUR/USD pair has been witnessing a steady climb from its lows around 1.1610, following an ascending trendline that connects recent lows over the past month. According to reliable trading platforms, the pair recently touched a high of 1.1800 before retracing, and is currently testing a support level around 1.1730.
Simultaneously, Fibonacci levels drawn from the 1.1610 low to the 1.1800 high reveal potential support areas where the correction may find a floor:
The 38.2% Fibonacci level is at 1.1731.
The 50% level is at 1.1708.
A significant pullback could reach the 61.8% Fibonacci level at 1.1685, which nearly coincides with the ascending trendline support and may represent a crucial turning point for the bullish trend to continue. If any of these Fibonacci levels or the trendline support holds as a bottom, EUR/USD could resume its ascent toward its recent high or even record new levels above the 1.1800 psychological resistance. Conversely, breaking below the 61.8% level and the trendline would signal weakening bullish momentum and could lead to a deeper retreat.

Additionally, The Stochastic oscillator is trending downwards from overbought territory, indicating that sellers are gaining some momentum after the recent rally. However, the indicator is approaching the neutral 50 level and still has considerable room to fall before reaching oversold territory, meaning the correction could extend further before buyers return.
Meanwhile, yhe Relative Strength Index (RSI) is moving downwards from its recent highs and is currently hovering around the 50 level. The index still has considerable room to maneuver before reaching oversold territory, so the price may continue to move accordingly as sellers dominate market movements in the near term.
We recommend selling the EUR/USD pair from above the 1.1800 resistance level without risk, while always diversifying your investment portfolio with several trading products in addition to the EUR/USD.
During today’s forex trading, the EUR/USD pair may be affected by the European Central Bank’s (ECB) anticipated decision. It is widely expected that the ECB will maintain its current monetary policy, emphasizing its cautious, data-driven approach to any changes. However, any significant shift in its rhetoric could impact monetary policy expectations and the direction of the single European currency. EUR/USD trading today will also be influenced by the release of Eurozone inflation figures at 12:00 PM Egypt time, which will, in turn, affect the ECB’s policy direction. Regarding currency performance, the US dollar weakened after the highly anticipated US jobs report confirmed a slowdown in the labor market. While the US economy added 64,000 jobs in November, exceeding expectations of 50,000, this positive figure was the limit. The revised October report showed a loss of 105,000 jobs, while the unemployment rate rose to 4.6%.
The adjusted three-month job creation rate was only 22,000, highlighting the extent of the economic downturn and justifying the Federal Reserve’s interest rate cuts in an attempt to support the economy. Although the economy appears outwardly robust, the weakness in the labor market indicates an uneven pace of economic growth. Overall, the Federal Reserve’s further interest rate cuts reinforce expectations of a weaker US dollar in the coming weeks.
Ready to trade our EUR/USD daily forecast? Here’s a list of some of the top forex brokers in Europe to check out.

 Price Forecast: Tight Four-Day Range – Highest Close Since October Looms")


")