The main category of All News Articles.
You can use the search box below to find what you need.
[wd_asp id=1]
The main category of All News Articles.
You can use the search box below to find what you need.
[wd_asp id=1]
The British pound continues to consolidate on Thursday, as we are waiting for the all-important Non-Farm Payroll numbers in the United States.
The non-farm payroll announcement, while in and of itself isn’t particularly interesting and not even particularly accurate, will have a major influence on what people think the Federal Reserve will do. The unemployment rate in America is expected to be 4.5%. The non-farm employment change is supposed to be an addition of 66,000 jobs.

With that being the case, I think it comes down to the number. The higher the number, the better off the US dollar does because we have a situation here where the Bank of England is cutting but is doing so slowly, and if the Federal Reserve has a reason to pause, then that means the dollar is mispriced.
That being said, in the short term, it looks like we’re still range-bound. It will be interesting to see if we can break out of this little rectangle. A move above 1.36 would be bullish, especially if the US dollar is falling against everything else. In that case, then yes, the GBP rises here.
On the other hand, if we break down below the 50-day EMA currently right at the 1.3367 level, then I think you start to see the dollar strengthen against the pound quite a bit, maybe even a couple of handles.
Ready to trade our daily GBP/USD Forex forecast? Here’s some of the best forex broker UK reviews to check out.
Christopher Lewis has been trading Forex and has over 20 years experience in financial markets. Chris has been a regular contributor to Daily Forex since the early days of the site. He writes about Forex for several online publications, including FX Empire, Investing.com, and his own site, aptly named The Trader Guy. Chris favours technical analysis methods to identify his trades and likes to trade equity indices and commodities as well as Forex. He favours a longer-term trading style, and his trades often last for days or weeks.
While many ingredients claim to increase production of glucagon-like peptide-1 (GLP-1), an incretin hormone that signals satiety, few have robust clinical trials proving their case and correlating it with weight loss.
A new clinical trial published in Medicina touts significant weight loss benefits and GLP-1 boosts for two botanical extracts, Dichrostachys glomerata and Cissus quadrangularis.
Not only did researchers demonstrate the impact of the extracts, but they also compared their use as a dietary supplement side by side with semaglutide, a popular GLP-1 receptor agonist (RA) drug.
“We now have the strongest evidence yet that these extracts support GLP-1 activity through natural pathways in the body, helping regulate appetite, reduce body fat and improve key markers of metabolic health,” said Julius Oben, Ph.D., professor of nutritional biochemistry at the University of Yaounde in Cameroon and lead investigator, via press release from Gateway Health Alliances.
Gateway Health Alliances is an ingredient supplier focused on science-backed ingredients for weight management and supplied the botanical ingredients for the study, which it markets as Dyglomera and CQR-300.
GLP-1 RAs are a boon for weight management because they increase satiety, leading to decreases in caloric intake. Yet many barriers exist that prevent their use, including affordability, side effects and adversity to injections. Oral semaglutide is an option recently approved by the FDA for weight loss, but cost and side effects may still be issues.
Several supplement ingredients such as probiotics and fibers are purported to increase endogenous GLP-1 production but have not been compared directly to semaglutide, which has a much longer half-life than GLP-1 produced in the body.
Dietary supplements formulated with botanical extracts provide an avenue for supporting weight management at reduced cost with fewer side effects,tapping into two growing trends for the industry.
The botanicals studied increased GLP-1 levels and decreased levels of dipeptidyl peptidase-4 (DPP-4), an enzyme that breaks down GLP-1.
Both ingredients led to similar decreases in body weight, body fat, fasting glucose and cholesterol levels as oral semaglutide. All participants on active ingredients experienced reduced energy intake and improved satiety.
The two extracts studied were Dichrostachys glomerata and Cissus quadrangularis, two botanicals commonly used in Africa and Asia for weight loss.
Design: Randomized double-blind placebo-controlled trial.
Study size: 228 participants completed the study.
Length: 16 weeks. The researchers did not provide participants with specific instructions for diet or exercise.
Dosage: Participants received either 400 mg/d D. glomerata extract, 300 mg/d C. quadrangularis extract, oral semaglutide (starting dose 3 mg/d for first four weeks, ramped up to 7 mg/d for second four weeks, then 14 mg/d for the remainder of the study), or placebo.
Outcomes measured: Blood GLP-1 levels, DPP-4 activity, body weight, body fat, fasting glucose, cholesterol, triglycerides, energy intake (estimated from food diaries) and satiety (measured using a validated visual analog scale questionnaire).
By the end of the trial, all participants receiving an active (either semaglutide or the botanical extracts) experienced the following statistically significant – and often clinically relevant – changes as compared to placebo:
Increase in GLP-1 levels.
Decrease in DPP-4 activity.
Reduction in body weight (5% or greater).
Reduction in body fat percentage (10% or greater).
Decrease in total cholesterol and triglycerides.
Reduction in calorie intake (16% or greater).
Increase in satiety score (25% or greater).
While semaglutide led to the greatest numerical improvements for all measurements, the changes elicited by both D. glomerata and C. quadrangularis were comparable.
Scientists previously evaluated D. glomerata in a clinical trial, finding the extract had a beneficial impact on weight and mood, but they did not measure GLP-1 or DPP-4 levels. Researchers studied the botanical with and without caffeine, observing improvements in weight and satiety in both instances.
C. quadrangularis has widely been studied in the literature for various effects including anti-inflammatory and anti-microbial properties as well as benefits for bone health. Both a meta-analysis on the botanical and a study specifically on the CQR-300 extract point to strong benefits for weight management.
Akkermansia species have received attention in recent months because of their impact on weight loss and GLP-1 activity, but results to date are mixed. One clinical trial showed obese subjects who supplemented with an A. muciniphila probiotic did not experience changes in GLP-1 levels, whereas another trial showed both a live probiotic and postbiotic form of the species increased GLP-1.
Technical analysis is dominated by the price prediction of XRP and Cardano. CoinMarketCap records that XRP is trading at $2.25 and has a volume of $136.62B and accumulation trends indicate that it could be in breakout phase towards the targets of $5 to $8. At $15.1B, Cardano has a value of $0.42 in the technical indicators that are displayed to be within the range of $0.80 to $1.20.
They both exhibit bullish structures with 2x to 3x returns. Yet Pepeto ($PEPETO) presale at $0.000000176 steals investor spotlight through mathematical advantages enabling 100x probability.
Having raised 7.14M, built 100K+ participants, and attracted 850+ platform applications, Pepeto (https://pepeto.io/) considered the Best Crypto to Invest In, demonstrates momentum overshadowing established cryptocurrency predictions. To know why presale is a stealer of spotlight one has to look at percentage probability and absolute price targets.
XRP Breakout Technical Position.
XRP of $2.25 exhibits strong technical trends. The price consolidated at the range of $2.00 to 2.50 as a base towards possible break out. Accumulation of volume posits maintenance of institutional positioning. New ETF products have offered regulated access mechanisms. It is reported that XRP investment products record inflows of unprecedented $46M a day showing systematic capital investment.
Technical analysts get resistance at 3.00 first then 4.50 then finally at 5-8 and then 8. The degree of regulatory clarity after the SEC case gives confidence lacking in other cryptocurrencies. Ripple contracts with banks to carry out cross-border payments advance gradually. These basics lend bullish projections. Between 2.25 to $5, this is approximately 2.2x. Reaching $8 delivers 3.5x. Very good returns and low exponential potential of $136.$62B.
Cardano Golden Cross Formation.
At $0.42, Cardano has first golden cross of 2026 and this has led to increased speculation. This technical indicator is realized when short-term moving average is crossed in an upward direction by the long-term average that is followed by the growth of prices in the past. The 50-day MA broke through the 200 day MA indicating the possibility of bullish momentum building.
Technical targets indicate that the first resistance level will be at $0.80 then psychological barrier at $1.00 till shot to range of $1.20 to $1.50 in the long term momentum. Recent additions such as Midnight sidechain launch and Protocol 25 upgrade give underlying support. Peer-reviewed methodology enhances interest due to the appeal of institutional interest. Between $0.42 and $0.80 is a little more than 1.9x. Achieving $1.20 returns about 2.8x. A respectable performance with mathematical limitations curtail exponential results of $15.1B.
Why Pepeto Presale Steals Spotlight
Despite XRP and Cardano bullish predictions, Pepeto (https://pepeto.io/) presale dominates investor attention. The mathematics explain why. To reach 100x on a $136.62B it takes $13.66T. Cardano reaching 100x needs $1.51T. Both are confronted with unrealistic capital requirements. Pepeto reaching 100x from $0.000000176 needs just $300M to $400M.
The presale raising $7.14M is an indication of serious capital commitment at the time of quietest phase. It has organic momentum to reach community of 100K+ participants. The platform applications of 850+ demonstrate that there is ecosystem demand prior to launch. Infrastructure including PepetoSwap, cross-chain bridge, zero-fee exchange, and 216% staking addresses comprehensive memecoin needs.
Context validates targets. PEPE keeps $2.78B, SHIB has got $5.28B, DOGE is at $25.35B. Tens of billions sustained value is demonstrated in the memecoin category. Pepeto capturing fraction achieves 100x from comprehensive utility infrastructure differentiating it from pure speculation tokens. While XRP and Cardano offer solid 2x to 3.5x predictions, Pepeto presale offers 100x probability stealing investor focus.
Rotation of Capitals between Predictions and Presale
The psychology of investors will cause them to exercise a capital rotation mechanism where they shift their interest to earlier projects. XRP and Cardano forecasts are decent returns that will need time to go through the consolidation and breakout cycles. Pepeto (https://pepeto.io/) presale offers compressed timeframe potential. The inclusion in exchange listings may prompt swift gains on a rapid relative basis compared to prolonged established cryptocurrency currency momentum.
Also, pre-sale involvement captures the optimum entry unachievable after listing. The buyers of XRP and Cardano at the current price do not obtain the benefits of accumulation at an earlier stage. Pepeto presale participants secure lowest pricing before broader market discovery. This timing gap is the reason why presale steals the spotlight when compared to XRP and Cardano technical power.
The Ability to Access Spotlight Opportunity
Visit Pepeto.io (https://pepeto.io/) and connect Ethereum wallet like MetaMask or Trust Wallet. Eth, USDT, and BNB purchases and credit card purchases are available in Web3Payments. Create stake at 216% returns maximizing. On the upslope side in the news, out of 700,000 rewards shared by those who pre-sold, there was a token upside growth, which is two times as lucrative an opportunity as sitting and waiting until XRP or Cardano breakout announcements.
Conclusion
The target of the price prediction: the XRP may grow to between 5 and 8 based on the XRP price at the price level of $2.25 implying returns of 2.2x to 3.5x. 1.9x-2.8x returns on cardano at a prediction of $0.80-$1.20 at $0.42. They both exhibit bullish technical arrangements. However, Pepeto (https://pepeto.io/) presale at $0.000000176 steals investor spotlight through 100x probability. The project has brought up 7.14M dollars, constructed $100K + community, and found 850+ applications of its platform.
Comprehensive infrastructure including PepetoSwap, bridge, exchange, and 216% staking creates sustained value. The mathematical benefits allow 100x using $300M to $400M compared to the impossible $13.66T of XRP and the difficult to achieve $1.51T of Cardano. While XRP and Cardano offer solid predictions, Pepeto presale captures investor focus through superior asymmetric probability and compressed opportunity window.
To stay ahead of key updates, listings, and announcements, follow Pepeto on its official channels only:
Website: https://pepeto.io
X (Twitter): https://x.com/Pepetocoin
Telegram: https://t.me/pepeto_channel
Instagram: https://www.instagram.com/pepetocoin/
Contact: Dani Bonocci
Website: https://www.tokenwire.io
Phone: +971586738991
SOURCE: Pepeto
Press release distribution
This release was published on openPR.
Gold remains clearly bullish, with a bounce off the 10-day average providing a short-term indication that the buyers remain in charge. Key support is at the recent low of $4,274 as it generated a higher swing low. Remaining above the 10-day line will show sustained short-term strength but a pullback to potential support near the 20-day average, currently at $4,377, would not change the bullish posture. It is just that holding above the 10-day average shows slightly more strength.
The rising 20-day average is starting to breach the prior trend high of $4,381. That behavior shows improving underlying demand. Once the 20-day line reaches price again, volatility should improve with an upside continuation above the high of $4,500. Of course, this only applies if the 20-day line touches price before the breakout. An upside breakout can also occur before the average touches price. Gold should continue to hold above dynamic support near the 20-day line if it is to have a chance at a new record high above $4,550.
Despite the bullish trend structure, a potential monthly bearish shooting star candlestick pattern completed in December. Even though the pattern is invalid until there is a breakdown below December’s low of $4,164, it reflects the potential for downward pressure as gold attempts to strengthen in January. A similar situation in the months of October and November resulted in an upside resolution as the monthly pattern never validated with a breakdown. October ended with a shooting star monthly pattern, followed by an inside month in November. Therefore, further short-term consolidation could occur before momentum kicks in to lead gold to a new record high.
If you’d like to know more about what drives gold and silver prices, please visit our educational area.
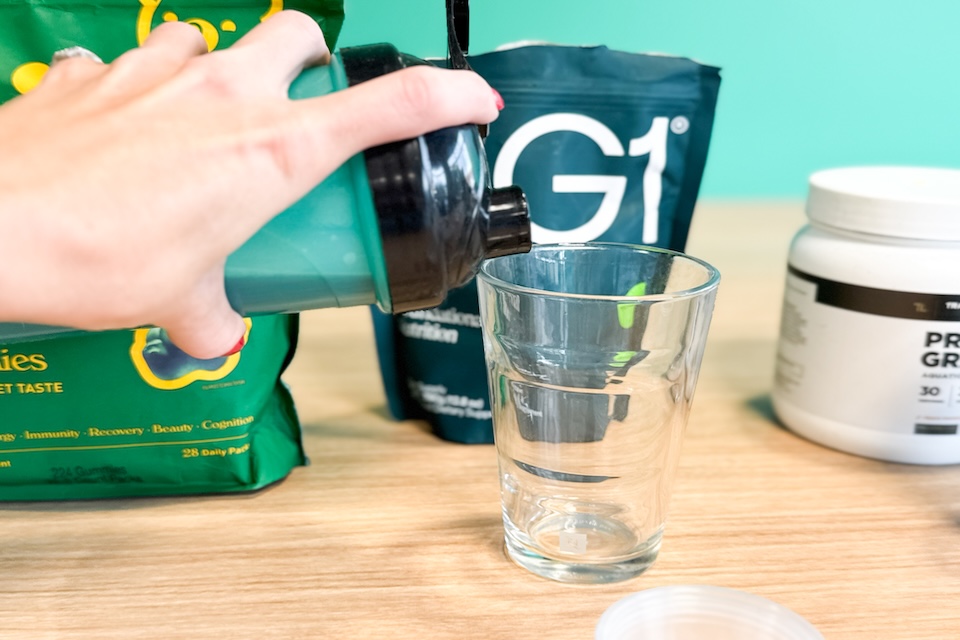
Greens powders like AG1 Next Gen (Athletic Greens) can make it easier to cover key nutrients when you’re traveling or too busy to cook every meal. Mixing up a scoop gives you quick, plant‑based support for energy, digestion, and overall well‑being—without having to spend time on major prep or cleanup.
AG1 Next Gen includes 75 vitamins, minerals, probiotics, plant‑based compounds, and adaptogens into a single scoop, all marketed to support energy, immune function, gut health, and more.
In this hands‑on review of AG1 greens, our tester provides feedback on its taste, texture, and day‑to‑day experience.
AG1 Next Gen (aka Athletic Greens) is a powdered drink mix that combines greens, vitamins and minerals, probiotics, prebiotics, and botanical ingredients into a single scoop intended to help close common nutrient gaps, support your gut health, and improve energy and immunity. It’s an upgraded version of the original Athletic Greens formula, with an expanded vitamin and mineral profile, probiotic strains, and taste tweaks aimed at making the drink slightly sweeter and more approachable without adding sugar.
You use AG1 Next Gen by mixing one measured scoop of powder with cold water—typically around 8 ounces—then shaking or stirring and drinking once per day, often in the morning. The product is sold in bulk pouches that usually need refrigeration after opening, as well as single-serve travel packs designed for easier use on the road or in the office. It’s best to take it consistently, ideally on an empty stomach or away from large meals and as a part of your daily routine rather than an occasional add‑on.
| Spec | AG1 Next Gen Details |
|---|---|
| Price/price per serving | $99 for a 30‑serving pouch as a one‑time purchase or $79 with subscription |
| Key ingredients | 75+ ingredients across proprietary blends: greens, prebiotic fibers, vitamins and minerals, antioxidants and plant extracts, and a 10‑billion CFU probiotic blend with multiple Lactobacillus and Bifidobacterium strains |
| Third‑party testing | NSF Certified for Sport, manufactured in GMP‑compliant facilities with batch‑level testing for contaminants and over 280 banned substances |
| Form/how to take it | Powdered daily drink; mix one scoop with cold water (about 8 oz) once per day, usually in the morning. Sold in pouches and single‑serve travel packs. |
| Dietary/label notes | Vegan, non‑GMO, gluten‑free, dairy‑free, and free from artificial colors |
| Price/price per serving | |
|---|---|
| $99 for a 30‑serving pouch as a one‑time purchase or $79 with subscription | |
| Key ingredients | |
| 75+ ingredients across proprietary blends: greens, prebiotic fibers, vitamins and minerals, antioxidants and plant extracts, and a 10‑billion CFU probiotic blend with multiple Lactobacillus and Bifidobacterium strains | |
| Third‑party testing | |
| NSF Certified for Sport, manufactured in GMP‑compliant facilities with batch‑level testing for contaminants and over 280 banned substances | |
| Form/how to take it | |
| Powdered daily drink; mix one scoop with cold water (about 8 oz) once per day, usually in the morning. Sold in pouches and single‑serve travel packs. | |
| Dietary/label notes | |
| Vegan, non‑GMO, gluten‑free, dairy‑free, and free from artificial colors |
Kayla and Gwen tested AG1 Next Gen hands-on, using it consistently for several weeks. They considered the product’s convenience, digestibility, and any changes in energy or overall routine adherence.

Kayla’s first impressions of Athletic Greens were quite positive. “The packaging feels pretty standard, however, the branding is well thought out, which immediately gives the sense that it’s a high-quality product,” she said. “The ingredient profile is impressive with a focus on covering a broad range of vitamins, minerals, probiotics, and adaptogens in one formula.”
Instructions and ease of use
The instructions for AG1 are straightforward and easy to follow, according to Kayla. “The directions state mixing one scoop with 8–10 ounces of cold water,” she said. “The text is clearly printed and easy to spot on the packaging. The font size is large enough to read without straining, and the layout is easy to read.” She rated AG1 Next Gen a 5 out of 5 for ease of following instructions.
Using a shaker bottle, Kayla mixed one scoop of AG1 with about 10 ounces of cold water and shook for 60 seconds. “This product by far has the best solubility out of all the greens powders I have tried.”
In her own experience, Gwen has tried both the AG1 original formula and the Next Gen version. “The solubility has definitely improved with this product,” she said, rating it a 5 out of 5. “The old powder used to settle a bit but now it completely dissolves. I’m glad they made an effort to improve this.”
Flavor updates
Kayla found the taste to be lighter than the old formula, too. “Before it was very earthy tasting and the smell was almost bitter and too overwhelming. Now I can smell the pineapple,” she said.
“There are now subtle hints of sweetness of vanilla that help soften the greens flavor,” Kayla noted, adding that it didn’t taste overly sweet, despite a little lingering stevia flavor. “There’s no strong bitterness and the drink is well balanced,” she said. Kayla found the mouthfeel to be smooth and light, and the texture is closer to a light juice than a thick smoothie, making it easy to drink quickly. She rated the taste a 5 out of 5.
Formula details
Gwen loves that AG1 Next Gen clearly displays how much you’re getting of each vitamin and nutrient in the product. While the product does contain some proprietary blends, it’s transparent about the most crucial vitamins and nutrients.
“Personally, I love that this formula includes biotin because it minimizes my need to take this supplement separately,” Gwen added, rating the formulation a 4 out of 5 (this tester is also a NASM Certified Nutrition Coach). “You get at least 100% of your daily recommended value of many key vitamins, which is awesome.”

Minor taste and texture issues
Kayla noted that the new formula has a slightly metallic taste, though she still likes the new formula compared to the original. Additionally, she thought the product mixed pretty easily, but she did notice a grainy quality to the drink. “If I mixed it longer (or shook the bottle more), the formula did create quite a bit of foam,” she said. “It settled down quickly, though. The mixability was average.”
Including vitamin D
As you may notice, AG1 Next Gen does not include vitamin D, but there’s a reason for that, according to Gwen. Vitamin D is a fat-soluble vitamin, which means it’s best absorbed with a dietary fat or oil.
“Like protein powder, for instance, I imagine a lot of people drink this before breakfast, so it doesn’t make sense to include vitamin D in the formulation,” she explained. That said, AG1 does separately sell a vitamin D3+K2 solution. “In an ideal world, this solution would come with the powder, but I do understand they’re a business and that may not be feasible.”
| Who AG1 is for | Who AG1 is not for |
|---|---|
| – People with busy schedules who want an all‑in‑one scoop instead of several pills or powders | – Anyone wanting a ready‑to‑drink bottled option instead of mixing powder with water |
| – Folks who generally eat well but want a “backup” for days when their diet is less consistent | – People on tight budgets who prefer lower‑priced greens or a basic multivitamin instead |
| – Frequent travelers who like portable nutrition they can mix with water anywhere | – Those who mainly want a heavy‑fiber or protein supplement rather than a broad micronutrient blend |
| – Athletes or high‑performers who value third‑party–tested supplements and certifications | – Individuals who strongly dislike any greens flavor, even when lightly sweetened |
| – People who are comfortable using a daily supplement drink as part of their routine | – Folks with complex medical conditions or multiple medications who need individualized supplement guidance |
| – People with busy schedules who want an all‑in‑one scoop instead of several pills or powders | |
|---|---|
| – Anyone wanting a ready‑to‑drink bottled option instead of mixing powder with water | |
| – Folks who generally eat well but want a “backup” for days when their diet is less consistent | |
| – People on tight budgets who prefer lower‑priced greens or a basic multivitamin instead | |
| – Frequent travelers who like portable nutrition they can mix with water anywhere | |
| – Those who mainly want a heavy‑fiber or protein supplement rather than a broad micronutrient blend | |
| – Athletes or high‑performers who value third‑party–tested supplements and certifications | |
| – Individuals who strongly dislike any greens flavor, even when lightly sweetened | |
| – People who are comfortable using a daily supplement drink as part of their routine | |
| – Folks with complex medical conditions or multiple medications who need individualized supplement guidance |
| Supplement | Overall focus | Gut health support | Taste and flavor options | Typical price tier |
|---|---|---|---|---|
| AG1 Next Gen | All‑in‑one daily foundational nutrition (greens, vitamins, minerals, probiotics, adaptogens) | Probiotics and some prebiotic components | One main greens flavor; lightly sweet | $99 for 30 servings |
| Live It Up Super Greens | Daily health, energy, and digestion from superfoods, probiotics, and enzymes | Probiotics, prebiotic fiber, and digestive enzymes | Greens flavor with natural sweeteners like monk fruit | $39.99 for 30 servings |
| Transparent Labs Prebiotic Greens | Gut health and digestion with greens plus prebiotic fiber | Heavy on prebiotic fibers to feed existing gut bacteria | Several flavors (and unflavored) | $49.99 for 30 servings |
| AG1 Next Gen | |
|---|---|
| All‑in‑one daily foundational nutrition (greens, vitamins, minerals, probiotics, adaptogens) | |
| Probiotics and some prebiotic components | |
| One main greens flavor; lightly sweet | |
| $99 for 30 servings | |
| Live It Up Super Greens | |
| Daily health, energy, and digestion from superfoods, probiotics, and enzymes | |
| Probiotics, prebiotic fiber, and digestive enzymes | |
| Greens flavor with natural sweeteners like monk fruit | |
| $39.99 for 30 servings | |
| Transparent Labs Prebiotic Greens | |
| Gut health and digestion with greens plus prebiotic fiber | |
| Heavy on prebiotic fibers to feed existing gut bacteria | |
| Several flavors (and unflavored) | |
| $49.99 for 30 servings |
AG1 by itself does not cause weight loss, because greens powders do not change the basic need for a calorie deficit to lose body fat. It is low in calories and can fit into a healthy routine, so it may indirectly support weight management when paired with a balanced diet, movement, sleep, and stress management.
Clinical data so far suggest AG1 is generally safe for healthy adults, with no major safety concerns over several weeks of daily use. However, some people report digestive symptoms like nausea, bloating, diarrhea, or stomach upset, especially when first starting or when combined with other supplements, and if you are pregnant, breastfeeding, under 18, or on medications, we recommend that you talk with your doctor before using it.
AG1 is marketed as a daily health drink that can replace a multivitamin, probiotic, and several other supplements by helping to close common nutrient gaps. That said, AG1 is not a substitute for a balanced diet or individualized medical advice about supplements.
Solana just scored another credibility win as Jupiter rolled out JupUSD, a stablecoin backed by BlackRock’s tokenized BUIDL fund. It’s a clear sign that institutional-grade finance keeps moving on-chain.
Yet the news barely shifted Solana price predictions, as attention has already moved elsewhere. Traders are fixated on DeepSnitch AI and its looming catalyst.
Rumors suggest the team is lining up multiple Tier 1 CEX listings shortly after the January TGE, a development that could reshape its trajectory fast.
With analysts calling DSNT a potential 100x play for 2026, whales have already committed $1.1M+ to the presale, with analysts believing DeepSnitchAI could outperform any Solana price predictions this year.
Jupiter has introduced JupUSD, a new dollar-pegged stablecoin developed in partnership with Ethena Labs. Issued natively on Solana as an SPL token, JupUSD is designed to function as a core settlement asset across Jupiter’s DeFi ecosystem.
Ninety percent of JupUSD’s reserves are initially backed by USDtb, a licensed stablecoin collateralized by shares of BlackRock’s tokenized money-market fund.
At the same time, the remaining 10% is held in USDC to support liquidity. Reserves are custodied by Porto via Anchorage Digital and are verifiable on-chain.
DeepSnitch AI is quickly locking in its role as a true “picks and shovels” opportunity for the 2026 AI-driven bull run. The presale has already cleared $1.1 million, with DSNT priced at $0.03269, a 115% gain that’s already outpacing most Solana price predictions.
What sets DeepSnitch AI apart is execution. The protocol makes DYOR faster and far harder to get wrong. Four AI agents are now live, giving traders insight usually reserved for insiders.
SnitchFeed tracks whale movements in real time. SnitchScan flags risky contracts before capital goes in. SnitchGPT turns raw on-chain data into clear, actionable answers.
The latest addition, AuditSnitch, adds another layer of protection by analyzing ownership control, liquidity locks, and contract risks, then delivering a plain verdict.
The timing couldn’t be better. AI spending is projected to hit $1.5 trillion, and DeepSnitch AI sits right at that intersection of data, security, and trading intelligence.
With the presale wrapping up in January and Tier 1 listing rumors heating up, DeepSnitch AI could be one of those rare early entries that lead to a true 100x run.
Solana is regaining strength. Price was holding above $130 on January 7, sitting above key moving averages. Buyers now defend this zone, while sellers lose momentum.
The chart confirms the change. The Solana price prediction pushed through a long-term downtrend and now builds support between $130 and $134.
Higher lows above $125 show steady demand. The reclaim of the 50-day EMA and SMA adds weight, as this signal often marks trend turnarounds.
According to some Solana price predictions, if buyers stay active, focus shifts to $145–$150. A clean break there opens room toward $160 and possibly $180. A drop below $130 would pause the move and keep the price range-bound.
Tron was trading below $0.29 on January 7. Price reclaimed the 50-day EMA near $0.28 and keeps pressing higher. Buyers now control the short-term trend. A daily close above $0.29 would confirm a breakout.
Fundamentals add support. Tron expanded real-world use through a Wirex partnership with TRON DAO. The deal targets on-chain payments and strengthens Tron’s role as a settlement layer.
On-chain data backs the move. Stablecoin supply on Tron has climbed to nearly $82 billion, close to record levels. Traders are also leaning bullish, with the long-to-short ratio above 1.6.
If price holds above $0.29, TRX could push toward $0.32. A slip under $0.28 would stall momentum and keep the range intact.
Solana price predictions may still excite traders, but with a $75 billion market cap, the era of life-changing upside for SOL is largely over. The real opportunity in 2026 lies in undervalued, early-stage plays, and DeepSnitch AI fits that profile perfectly.
At just $0.03269, DSNT offers true asymmetry, backed by real, live tools that give retail traders an edge. With $1.1 million already raised and Tier 1 listing rumors swirling ahead of the January launch, the window is closing fast.
Visit the official DeepSnitch AI website, join Telegram, and follow on X (Twitter) for the latest updates.

While the Solana price forecast remains steady, DeepSnitch AI offers far greater upside with early-stage entry and live AI utility.
The SOL outlook favors gradual growth, but DeepSnitch AI stands out for traders seeking asymmetric, high-growth potential.
Solana market trends show maturity, while DeepSnitch AI leads as the smarter choice for early-stage investors chasing outsized returns.
Disclaimer: This is a Press Release provided by a third party who is responsible for the content. Please conduct your own research before taking any action based on the content.

New York, January 8, 2026, 10:41 EST — Regular session
Shares of EQT Corp slipped on Thursday as the natural gas price turned lower after a government storage report. EQT was down 1.1% at $53.88, while Henry Hub natural gas futures fell 2.7% to $3.431 per million British thermal units (mmBtu) by mid-morning.
The weekly storage figure is the market’s gut check in winter. It feeds straight into expectations for how tight supply will look if cold snaps arrive, or don’t.
The U.S. Energy Information Administration (EIA) reported a 119-billion-cubic-foot (Bcf) withdrawal for the week ended Jan. 2, leaving working gas in storage at 3,256 Bcf. That put inventories about 1% above the five-year (2021–25) average, and the agency’s next report is due Jan. 15.
The reversal came a day after the February contract jumped, with the front month settling at $3.525 on Wednesday. Commodity Weather Group pointed to a colder window around Jan. 17-21 across the Midwest and East, a forecast that helped spark short covering earlier in the week. Sprague Energy
Other Appalachia-focused names eased alongside. Antero Resources fell 0.8% and Range Resources dropped 1.3%, while the United States Natural Gas Fund (UNG) — an exchange-traded fund that tracks near-term gas futures — slid 3.3%.
Moves were sharper in leveraged products. ProShares Ultra Bloomberg Natural Gas (BOIL), which targets twice the daily move in gas futures, fell 5.1%, while the inverse ProShares UltraShort Bloomberg Natural Gas (KOLD) rose 5.4%.
But the weather trade cuts both ways, and it can turn fast when forecasts shift. On the chart, some traders are watching support near $3.43 and resistance around $3.60 in the February contract.
For EQT investors, the next company catalyst is earnings: MarketWatch’s calendar shows the producer is due to report on Feb. 18.
WASHINGTON – The Consumer Healthcare Products Association (CHPA) today issued a statement acknowledging the release of the 2026-2030 Dietary Guidelines and praising the Trump Administration’s efforts to improve public health through nutrition guidance.
“The Dietary Guidelines continue to serve as an important resource for federal nutrition programs, health professionals, and American consumers, providing insight into how dietary practices can support overall health at every stage of life and identifying key nutritional needs and areas where gaps persist.
“Consistent with previous editions of the Guidelines, CHPA welcomes the continued recognition that dietary supplements play a complementary role in helping individuals meet nutrient needs when diet alone is insufficient, particularly during key life stages or for vulnerable populations. With approximately 75% of Americans not consuming enough nutrient-dense fruits and vegetables, gaps in dietary intake remain a persistent public health challenge. Longstanding public health examples, such as folic acid supplementation for pregnant women or those who may become pregnant, demonstrate how supplementation can support nutrient adequacy when dietary intake falls short.
“As representatives of the self-care industry, CHPA’s focus remains on the role supplements can play in supporting healthy dietary patterns and filling nutrient gaps. We are reviewing the Guidelines closely and look forward to continued engagement with policymakers, the Administration, and industry experts as implementation moves forward, consistent with the scope of nutrition guidance.
“CHPA is committed to advancing responsible self-care and ensuring consumers have access to safe and trusted dietary supplement products that support Americans’ overall health and wellness by helping them meet nutrient needs.”
Have news to share? Send us your press releases and announcements.
BNB USD is trading at $909.82 as of January 8, 2026, down 0.81% in the last 24 hours. The Binance token faces a critical juncture where strong technical momentum collides with profit-taking pressure. Market data shows BNB USD has declined 13.5% over the past month, yet remains up 39.2% year-to-date. With a market cap of $130.7 billion and trading volume at 2.19 billion, BNB USD continues to command significant liquidity. Understanding the current BNB USD price action requires examining both the technical setup and broader market sentiment driving this cryptocurrency.
The technical picture for BNB USD reveals mixed signals that explain today’s modest decline. RSI sits at 56.24, indicating neutral momentum without overbought or oversold extremes. The MACD shows a bearish signal with the line at -6.28 below the signal line at -17.42, suggesting weakening upside momentum. ADX measures 32.63, confirming a strong trend is in place, though direction remains contested.
Bollinger Bands paint an interesting picture with price at $909.82 positioned near the upper band at 909.67. This suggests BNB USD has reached resistance territory where sellers typically emerge. Support levels sit at the lower band ($818.10) and the 50-day moving average ($871.83), providing downside anchors if selling accelerates.
Trading volume for BNB USD stands at 2.19 billion, representing 71.7% of the 30-day average volume. This below-average activity suggests reduced conviction among traders, which often precedes directional moves. The Stochastic indicator reads 88.48 on the %K line, signaling overbought conditions that typically attract profit-taking.
Liquidation data shows Money Flow Index at 81.73, also in overbought territory. When multiple momentum indicators cluster in overbought zones, reversals become more probable. However, the Awesome Oscillator remains positive at 13.71, indicating bulls retain some control despite the recent pullback.
Meyka AI forecasts reveal a range of outcomes depending on timeframe. For the monthly outlook, BNB USD targets $833.08, representing a 8.4% decline from current levels if selling pressure intensifies. This level aligns with the 50-day moving average, suggesting natural support.
The quarterly forecast points to $1,032.17, implying a 13.5% rally if technical resistance breaks. This would require sustained buying volume and positive catalyst events. For the full year 2026, the forecast stands at $810.39, suggesting consolidation near current support levels. Forecasts may change due to market conditions, regulations, or unexpected events.
BNB USD price action revolves around three critical levels. Immediate resistance sits at the $915.89 day high, where sellers emerged today. Breaking above this level would target the $1,000 psychological level, which historically attracts institutional interest.
Support clusters at $890 (today’s low) and $871.83 (50-day moving average). A breakdown below $871 would expose the $818.10 lower Bollinger Band, representing a 10% decline from current prices. The year-to-date high of $1,370.55 remains a longer-term target if the broader uptrend resumes.
The 0.81% decline reflects profit-taking after BNB USD rallied 2.53% over the past five days. Overbought momentum indicators suggest traders are locking in gains rather than holding for higher prices. Market data shows relative volume at 0.72, indicating lighter participation than average, which often accompanies consolidation phases.
Broader crypto market dynamics also matter. When Bitcoin or Ethereum face selling pressure, altcoins like BNB USD typically follow. The decline remains modest, suggesting the underlying uptrend remains intact despite today’s pullback.
The immediate outlook depends on whether BNB USD holds above $890 support. If buyers defend this level, a retest of $915.89 becomes likely within days. Conversely, a break below $890 would signal weakness and potentially trigger stops toward $871.83.
Technical strength measured by ADX at 32.63 confirms a strong trend exists, but the MACD crossover suggests momentum may be shifting. Traders should monitor volume closely—a surge in buying volume would confirm support holds, while declining volume on further weakness would suggest capitulation selling ahead.
BNB USD at $909.82 presents a textbook consolidation setup where technical strength meets profit-taking. The 0.81% daily decline masks a 39.2% year-to-date gain, indicating the broader uptrend remains intact. Technical indicators show mixed signals with RSI neutral, MACD bearish, and ADX confirming strong trend conditions. Support at $890 and $871.83 provides clear downside anchors, while resistance at $915.89 and $1,000 define upside targets. The quarterly forecast of $1,032.17 suggests meaningful upside potential if technical resistance breaks decisively. Market sentiment remains cautious with below-average volume, typical of consolidation phases before directional moves. BNB USD price action warrants close monitoring of volume patterns and support level holds to determine whether the next move favors buyers or sellers.
BNB USD declined due to profit-taking after a five-day rally. Overbought momentum indicators and lighter-than-average trading volume suggest traders are consolidating gains rather than pushing higher. The decline remains modest, indicating the underlying uptrend persists.
Meyka AI forecasts BNB USD at $833.08 monthly, $1,032.17 quarterly, and $810.39 for the full year. These targets depend on whether technical resistance breaks and market conditions remain favorable. Forecasts adjust based on regulatory changes and unexpected events.
Critical support sits at $890 (today’s low), $871.83 (50-day average), and $818.10 (lower Bollinger Band). Resistance appears at $915.89 (day high) and $1,000 psychological level. Breaking below $871 would expose deeper support near $818.
Yes, multiple indicators signal overbought conditions. RSI at 56.24 is neutral, but Stochastic at 88.48 and Money Flow Index at 81.73 both show overbought extremes. This typically attracts profit-taking, explaining today’s modest decline.
ADX at 32.63 confirms a strong trend, but MACD shows bearish crossover suggesting momentum is weakening. Bollinger Bands indicate price near resistance. Overall, the setup favors consolidation before the next directional move.
Disclaimer:
Cryptocurrency markets are highly volatile. This content is for informational purposes only.
The Forecast Prediction Model is provided for informational purposes only and should not be considered financial advice.
Meyka AI PTY LTD provides market data and sentiment analysis, not financial advice.
Always do your own research and consider consulting a licensed financial advisor before making investment decisions.
Chronic rhinosinusitis with nasal polyps (CRSwNP) is a chronic inflammatory condition of the nose and sinuses that causes soft growths in your sinuses. Although these growths (nasal polyps) don’t usually hurt, they can interfere with your quality of life and cause unpleasant symptoms — especially for women, who are often hit harder by the condition. Although men are more likely to have CRSwNP, women tend to have more severe symptoms, have more cases of co-occurring asthma and feel a greater impact on their quality of life.
We spoke with Stella Lee, M.D., ENT surgeon and director of the Brigham Sinus Center at Brigham and Women’s Hospital to find out what you need to know about symptoms of, treatments for and living with nasal polyps.
What are common symptoms of chronic rhinosinusitis with nasal polyps?
CRSwNP causes ongoing inflammation of the nose and sinuses, leading to symptoms that last three months or longer. Common symptoms include:
There are likely many reasons that women have more severe disease with CRSwNP, and those reasons are still being studied. Contributing factors may include:
Importantly, women often report a greater quality-of-life impact, including fatigue, sleep disruption and impaired sense of smell, even when the severity of the disease appears similar.
Treatment for CRSwNP is individualized and often involves a combination of approaches, including:
CRSwNP is a chronic condition, so treatment focuses on long-term control rather than a one-time cure.
While lifestyle changes don’t replace medical treatment, they can meaningfully support symptom control:
Yes. Helpful questions include:
Self-advocacy is essential when you have a chronic condition:
Women should feel empowered to expect relief, not just reassurance, and to partner with their healthcare team in long-term disease management.
This educational resource was created with support from Sanofi and Regeneron.
From Your Site Articles
Related Articles Around the Web
")


 Price Forecast: Bull Trend Holds Above Key Averages")


