The main category of All News Articles.
You can use the search box below to find what you need.
[wd_asp id=1]
The main category of All News Articles.
You can use the search box below to find what you need.
[wd_asp id=1]
Allied Market Research has recently published a comprehensive report titled “Policosanol Market by Source (Sugarcane, Wheat Germ, Beeswax, and Others), by Application (Dietary Supplements, Pharmaceutical Drugs, Personal Care and Cosmetics, and Animal Feed): Global Opportunity Analysis and Industry Forecast, 2023-2032”. The report indicates that the policosanol market was valued at $301.0 million in 2022 and is estimated to reach $586.5 million by 2032, exhibiting a CAGR of 6.9% from 2023 to 2032.
Download Sample PDF : https://www.alliedmarketresearch.com/request-sample/A107677
Prime Growth Determinants:
The increasing emphasis on cardiovascular health among the aging population, coupled with a growing focus on preventive healthcare, drives the demand for policosanol. Known for its potential cholesterol-lowering and antiplatelet effects, policosanol is positioned as a preventive measure against heart disease and related conditions. Moreover, heightened awareness of policosanol through consumer education initiatives or marketing campaigns further contributes to market growth. However, the high costs associated with policosanol may pose a challenge to market expansion.
Key Highlights from the Report:
The report provides insights into current trends and the future scenario of the policosanol market from 2023 to 2032, identifying prevailing opportunities and potential investment pockets.
Market analysis is conducted in terms of both value ($Million) and volume (Kilotons), considering factors such as source, application, major regions, and over 15 countries.
The policosanol market is characterized by consolidation, with a few major players such as Manus Aktteva Biopharma LLP, Zxchem Group, Ambe Phytoextracts Pvt. Ltd., BOC Sciences, Huzhou Shengtao Biotech LLC, Botanic Healthcare, Bioriginal Food & Science Corp, Sabinsa, Sunpure Extracts Pvt Ltd., and Shreeji Pharma International holding significant market shares.
Purchase Enquiry Report @ https://www.alliedmarketresearch.com/purchase-enquiry/A107677
The report offers strategic planning and industry dynamics to aid decision-making for existing market players and new entrants in the policosanol industry.
Sugarcane Segment Leads the Way:
In terms of source, the sugarcane segment dominated the market in 2022, contributing to over two-fifths of the global policosanol market revenue. It is projected to maintain this lead with the highest CAGR of 7.2% during the forecast period. The demand for sugarcane is fueled by factors such as population growth, changes in consumer preferences, industrial uses, economic development, and the ongoing need for sugar as a food ingredient. Moreover, policosanol derived from sugarcane is recognized for its potential health benefits, particularly in supporting cardiovascular health by modulating cholesterol levels. This factor is expected to drive the demand for sugarcane-derived policosanol, particularly in medicinal applications.
Interested in Procuring this Report? Visit Here: https://www.alliedmarketresearch.com/policosanol-market/purchase-options
Pharmaceutical Drugs Segment Maintains Dominance:
Among applications, the pharmaceutical drugs segment held the largest share in 2022, contributing to nearly two-fifths of the global policosanol market revenue. The rising demand for pharmaceutical products and treatments, driven by factors such as aging populations, chronic diseases prevalence, and medical technology advancements, boosts the market for policosanol. Widely used to reduce LDL cholesterol and increase HDL cholesterol, policosanol finds extensive application in heart health. The dietary supplements segment is anticipated to register the highest CAGR of 7.3% during the forecast period.
Asia-Pacific Continues Dominance:
Regionally, Asia-Pacific led the market in 2022, accounting for nearly half of the global policosanol market revenue and is projected to register the highest CAGR of 7.5% during the forecast period. The Asia-Pacific policosanol market is anticipated to expand significantly, driven by countries like India, China, and Japan. The region’s growing pharmaceutical sector, where policosanol is predominantly used as an antioxidant and anticoagulant agent in drug formulations, contributes to its market growth.
Access Full Summary Report: https://www.alliedmarketresearch.com/policosanol-market-A107677
Leading Market Players:
Key market players such as Zxchem Group, Sabinsa, Sunpure Extracts Pvt Ltd., Bioriginal Food and Science Corp, Ambe Phytoextracts Pvt. Ltd., Manus Aktteva Biopharma LLP, BOC Sciences, Huzhou Shengtao Biotech LLC, Botanic Healthcare, and Shreeji Pharma International have been analyzed in detail in the report. The report provides valuable insights into their business performance, operating segments, product portfolio, and strategic moves, thereby showcasing the competitive landscape.
Contact Us:
1209 Orange Street,
Corporation Trust Center,
Wilmington, New Castle,
Delaware 19801 USA
Int’l: +1-503-894-6022
Toll Free: +1-800-792-5285
Fax: +1-800-792-5285
help@alliedmarketresearch.com
About Us
Allied Market Research (AMR) is a full-service market research and business-consulting wing of Allied Analytics LLP based in Portland, Oregon. Allied Market Research provides global enterprises as well as medium and small businesses with unmatched quality of “Market Research Reports” and “Business Intelligence Solutions.” AMR has a targeted view to provide business insights and consulting to assist its clients to make strategic business decisions and achieve sustainable growth in their respective market domain.
We are in professional corporate relations with various companies and this helps us in digging out market data that helps us generate accurate research data tables and confirms utmost accuracy in our market forecasting. Allied Market Research CEO Pawan Kumar is instrumental in inspiring and encouraging everyone associated with the company to maintain high quality of data and help clients in every way possible to achieve success. Each and every data presented in the reports published by us is extracted through primary interviews with top officials from leading companies of domain concerned. Our secondary data procurement methodology includes deep online and offline research and discussion with knowledgeable professionals and analysts in the industry.
This release was published on openPR.
Ethereum USD (ETHUSD) is trading at $3225.19 as of January 8, 2026, down 0.21% in the past 24 hours despite significant institutional developments. Morgan Stanley’s filing for a spot Ethereum ETF marks a major shift in how traditional finance approaches digital assets. The broader crypto market experienced a 3% decline in Ethereum, reflecting profit-taking after recent gains. Understanding why ETHUSD is moving requires examining both technical levels and the institutional catalyst reshaping demand patterns. Market data shows mixed signals between whale accumulation and smart money selling, creating a critical inflection point for price direction.
The 0.21% daily decline in ETHUSD appears counterintuitive given Morgan Stanley’s ETF filing, but market dynamics reveal a more nuanced picture. Profit-taking from recent rallies has created selling pressure at resistance levels near $3264.66. Institutional inflows from spot Ethereum ETFs have slowed to $2.8 billion in cumulative outflows since their October peak, suggesting consolidation rather than sustained buying.
Whale activity tells a different story. Large investors accumulated $4.83 million in spot Ethereum across 32 wallets during the past week, indicating confidence at current levels. However, smart money traders sold $8.9 million across 63 wallets in the same period, creating a tug-of-war between conviction buyers and profit-takers. This divergence explains why ETHUSD is consolidating rather than breaking decisively higher or lower.
The RSI at 53.65 indicates neutral momentum with room for upside movement before overbought conditions emerge. MACD shows a bearish signal with the histogram at 28.94, suggesting weakening momentum despite the positive crossover potential. ADX at 30.02 confirms a strong trend is developing, supporting the case for directional movement once consolidation ends.
Bollinger Bands reveal price positioning between the lower band at $2744.40 and upper band at $3295.01, with current price near the middle band at $3019.71. Support levels cluster around $3132.79 (day low), while resistance sits at $3264.66 (day high). The 50-day moving average at $3015.47 provides dynamic support, while the 200-day average at $3610.78 remains a longer-term resistance target.
Monthly Forecast: $2582.26 represents a 20% decline from current levels, reflecting worst-case scenarios if institutional demand falters. Quarterly Forecast: $3472.03 suggests a 7.6% gain, aligning with the $3450-$3500 supply zone identified in technical analysis. Yearly Forecast: $3721.34 implies 15.3% upside, supported by sustained ETF inflows and staking yield mechanisms.
The quarterly target appears most probable given current momentum and institutional positioning. Morgan Stanley’s ETF filing could accelerate the move toward $3500 if regulatory approval comes within weeks. Forecasts may change due to market conditions, regulations, or unexpected events.
Trading volume stands at $27.2 billion daily, down 13.6% from the 30-day average of $31.5 billion, indicating reduced conviction in either direction. This lower volume during a consolidation phase suggests traders are waiting for a catalyst to commit capital. The relative volume ratio of 0.0147 shows today’s activity is below average, typical of indecision periods.
Liquidation data reveals $438 million in XRP short liquidations occurred recently across the broader market, but Ethereum-specific liquidation pressure remains moderate. Long positions dominate the futures market, with open interest stable despite price weakness. This suggests leveraged traders are holding conviction bets on higher prices, reducing the risk of cascading liquidations that could accelerate declines.
Morgan Stanley’s filing for the Morgan Stanley Ethereum Trust represents the third crypto ETF filing from the investment banking giant in a single week. The fund will hold spot Ethereum and engage third-party staking services to generate additional passive yield, differentiating it from purely passive products. This structure appeals to conservative institutional investors who want exposure without speculation.
The timing matters significantly. With $1.8 trillion in assets under management, Morgan Stanley’s entry could unlock billions in new demand. Spot Ethereum ETFs have proven resilient, retaining 82% of their peak $15 billion inflows despite the October market crash. Fresh wallets created in the past 14 days added $2.34 billion in spot Ethereum, signaling threefold demand growth from new entrants. This institutional momentum supports the quarterly forecast of $3472.03.
Exchange reserves of Ethereum have declined significantly as investors prioritize staking and self-custody over immediate selling. BitMine’s $44,000 ETH staking commitment removes supply from circulation, amplifying the impact of new demand from ETFs and institutions. On-chain data shows large wallet accumulation in the $2700-$2768 and $3050-$3100 zones, confirming strategic positioning by sophisticated investors.
Staking yield mechanisms embedded in Morgan Stanley’s ETF filing create a structural advantage for Ethereum. Unlike Bitcoin, which generates no yield, Ethereum’s 3-4% annual staking returns attract yield-focused institutional capital. This economic moat widens as more supply locks into staking contracts, reducing float and increasing price sensitivity to demand shocks. The combination of supply constraints and yield generation positions ETHUSD for sustained institutional accumulation.
ETHUSD at $3225.19 reflects a critical inflection point where institutional adoption meets technical consolidation. The 0.21% daily decline masks significant structural changes reshaping Ethereum’s demand profile. Morgan Stanley’s ETF filing signals that traditional finance is moving beyond speculation toward systematic exposure, a shift that historically precedes major price appreciation cycles.
Technical analysis supports the quarterly forecast of $3472.03, with the $3450-$3500 zone representing the next meaningful resistance. RSI at 53.65 and ADX at 30.02 confirm momentum is building without yet reaching overbought extremes. Whale accumulation and staking commitments provide fundamental support, while smart money selling suggests caution about near-term rallies.
The key variable is regulatory approval timing for Morgan Stanley’s ETF. If the SEC approves within weeks, institutional capital flows could accelerate the move toward $3500. If approval delays, consolidation may extend through Q1 2026. Either scenario supports the yearly forecast of $3721.34, making ETHUSD a long-term accumulation opportunity for investors with conviction in institutional adoption. Market data shows conviction is building, even as short-term price action remains choppy.
Profit-taking from recent rallies created selling pressure at resistance levels. Smart money traders sold $8.9 million while whales accumulated $4.83 million, creating a consolidation pattern. Lower trading volume of $27.2 billion suggests traders are waiting for regulatory clarity on the ETF filing before committing fresh capital.
The quarterly forecast is $3472.03, representing a 7.6% gain from current levels. This aligns with the $3450-$3500 supply zone identified in technical analysis. The yearly forecast of $3721.34 suggests 15.3% upside if institutional demand sustains through 2026.
The filing signals institutional demand that could unlock billions in new capital. Combined with existing staking commitments like BitMine’s $44,000 ETH, supply constraints tighten. Spot Ethereum ETFs retained 82% of peak inflows despite October’s crash, proving institutional demand is resilient.
RSI at 53.65 shows neutral momentum with room for upside before overbought conditions. ADX at 30.02 confirms a strong trend is developing. Bollinger Bands position price near the middle band, supporting consolidation before the next directional move toward $3500.
Market data shows whale accumulation in the $3050-$3100 zone and staking commitments removing supply from circulation. The quarterly forecast of $3472.03 and yearly target of $3721.34 suggest favorable risk-reward for long-term investors, though short-term consolidation may persist.
Disclaimer:
Cryptocurrency markets are highly volatile. This content is for informational purposes only.
The Forecast Prediction Model is provided for informational purposes only and should not be considered financial advice.
Meyka AI PTY LTD provides market data and sentiment analysis, not financial advice.
Always do your own research and consider consulting a licensed financial advisor before making investment decisions.
Gold is nursing losses near $4,450 in Asian trading on Thursday, having suffered about a 1% correction from weekly highs of $4,500 on Wednesday. All eyes remain on the geopolitical developments and the incoming US jobless claims data for fresh trading directives.
Gold is on the defensive early Thursday, as markets assess the mixed US economic data published on Wednesday, while the US Dollar (USD) clings to recovery gains, exerting bearish pressures on the bright metal.
Data released by the Bureau of Labor Statistics (BLS) showed on Wednesday, Job Openings, a measure of labor demand, dropped 303,000 to 7.146 million by the last day of November, against expectations of a 7.6M figure.
The ADP report showed that private employment in the United States (US) increased by 41,000 jobs last month after a revised decrease of 29,000 in November. The market forecast was for a 47,000 growth.
Meanwhile, the Institute for Supply Management’s index of services rose 1.8 points to 54.4, the highest since October 2024, the group said Wednesday.
However, the downside in Gold remains cushioned as the bets for two US Federal Reserve (Fed) interest rate cuts appear intact following the latest data flow.
Markets continue to predict 61 basis points (bps) of rate cuts this year, according to data compiled by LSEG.
Additionally, China’s central bank extended its gold-buying streak to a 14th straight month in December, according to official data, providing some comfort to Gold buyers.
The main factor that could keep the ‘buy-the-dips’ trades intact for Gold is geopolitics. The focus is once again on the Greenland issue, with White House separately having confirmed discussions about acquiring Greenland, including potential military involvement.
This comes after Venezuelan President Nicolas Maduro’s capture over the weekend by the US forces.
Moreover, geopolitical tensions between China and Japan also grab attention after the former on Monday banned Japanese exports of dual-use items with potential military uses, citing national security concerns.
In response, Japan said that the ban imposed by China was “absolutely unacceptable and deeply regrettable”.
That being said, the next clear directional move in Gold hinges on Friday’s all-important US Nonfarm Payrolls report. The US labor data could offer fresh insights into the Fed’s easing trajectory for the year ahead, significantly impacting the Greenback and the non-yielding Gold.
In the daily chart, the 21-day Simple Moving Average (SMA) climbs above the 50-, 100-, and 200-day SMAs, with all slopes rising as price holds above them. This bullish alignment reinforces buyers’ control. The Relative Strength Index (RSI) prints 59.87, above the 50 midline, suggesting firm momentum without overbought conditions. The 21-day SMA at $4,373.77 offers initial dynamic support.
Holding above the medium- and long-term averages keeps the trend bias positive. A dip could find support at the 50-day SMA at $4,221.80, while the 100-day SMA at $4,008.18 underpins the broader trend. The 200-day SMA at $3,659.96 remains a distant floor. A close below the 21-day SMA would shift the tone toward consolidation, while sustained trade above these rising averages would leave the path open for further extension.
(The technical analysis of this story was written with the help of an AI tool)
Gold has played a key role in human’s history as it has been widely used as a store of value and medium of exchange. Currently, apart from its shine and usage for jewelry, the precious metal is widely seen as a safe-haven asset, meaning that it is considered a good investment during turbulent times. Gold is also widely seen as a hedge against inflation and against depreciating currencies as it doesn’t rely on any specific issuer or government.
Central banks are the biggest Gold holders. In their aim to support their currencies in turbulent times, central banks tend to diversify their reserves and buy Gold to improve the perceived strength of the economy and the currency. High Gold reserves can be a source of trust for a country’s solvency. Central banks added 1,136 tonnes of Gold worth around $70 billion to their reserves in 2022, according to data from the World Gold Council. This is the highest yearly purchase since records began. Central banks from emerging economies such as China, India and Turkey are quickly increasing their Gold reserves.
Gold has an inverse correlation with the US Dollar and US Treasuries, which are both major reserve and safe-haven assets. When the Dollar depreciates, Gold tends to rise, enabling investors and central banks to diversify their assets in turbulent times. Gold is also inversely correlated with risk assets. A rally in the stock market tends to weaken Gold price, while sell-offs in riskier markets tend to favor the precious metal.
The price can move due to a wide range of factors. Geopolitical instability or fears of a deep recession can quickly make Gold price escalate due to its safe-haven status. As a yield-less asset, Gold tends to rise with lower interest rates, while higher cost of money usually weighs down on the yellow metal. Still, most moves depend on how the US Dollar (USD) behaves as the asset is priced in dollars (XAU/USD). A strong Dollar tends to keep the price of Gold controlled, whereas a weaker Dollar is likely to push Gold prices up.
Image © Adobe Images
CIBC says the U.S. dollar is likely to weaken into the first half of 2026 before stabilising and recovering later in the year, describing its outlook as “U-shaped”.
The Canadian bank said “risks will push the USD lower in the next couple of quarters”, arguing that downside risks to the U.S. labour market and growth will outweigh any modest upside risks to inflation.
CIBC said unresolved questions over who ultimately bears the cost of tariffs are “stagflationary and should push USDs lower in the early months of 2026”.
How much are you sending from pounds to dollars?
Your potential USD savings on this GBP transfer:
$318
By using specialist providers vs high street banks
Compare GBP to USD Rates Now →
Free comparison • No commitment required • Takes 2 minutes
It warned that if firms absorb tariff costs, they may be forced to cut labour to protect margins, while if consumers pay, inflationary pressures would rise, both scenarios weighing on the dollar.
The bank also said uncertainty over Federal Reserve independence could be a major theme early next year, noting that “the appointment of the Federal Reserve Chair has yet to be decided”.
Legal challenges to Trump’s IEEPA tariffs could further undermine the greenback, with CIBC saying a ruling against them would likely trigger rallies in trade-sensitive currencies that would “mechanically lead to a weaker greenback”.
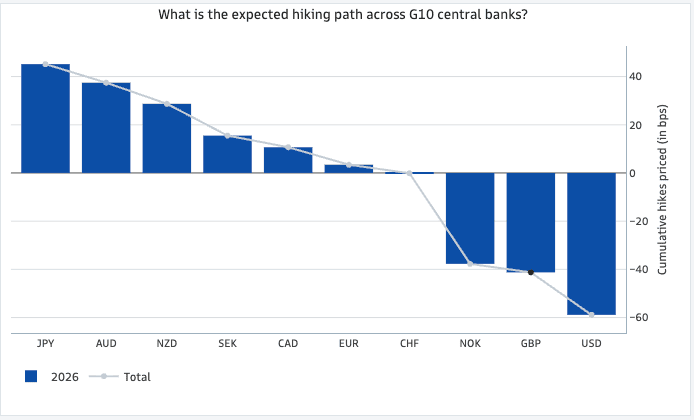
Above: Traders are betting the Fed will be the biggest cutter this year, underpinning a bearish USD consensus.
CIBC said these risks are front-loaded and “not long lasting”, arguing that markets will eventually conclude that expectations for U.S. interest rate cuts have gone too far.
The bank believes the Fed’s estimate of neutral interest rates is mispriced, saying “the true value is 50bps higher”, which should ultimately support the dollar later in 2026.
CIBC said it expects “an inflection point for the greenback to turn slightly higher” by mid-year, forecasting the dollar index to fall to 96.0 by the end of the second quarter before recovering to 97.30 by the end of 2026.
For the likes of EUR/USD and GBP/USD the implications are relatively straightforward: As long as the dollar index is falling, these pairs are rising.
All else equal, further advances into the middle of the year before falling into year-end.
The new infusion comprises a potent blend of 99 per cent Blue Pea Flower and Green Tea
The Tea Culture of the World (TCW), a premier brand renowned for its exquisite handcrafted tea blends, is delighted to announce the launch of its latest innovation: Blue Pea Flower Infusion with Green Tea in convenient tea bags.
Following the popularity of its famous loose-leaf Blue Pea Flower Tea, this new release blends the visual enchantment and relaxing powers of Butterfly Pea Flower with the antioxidant-rich vigour of Green Tea. This mix, packaged in a premium plastic jar with 25 tea bags, is targeted at the modern, health-conscious consumer who appreciates both luxury and convenience.
The new infusion comprises a potent blend of 99 per cent Blue Pea Flower and Green Tea. This unique composition provides a dual benefit: the stress-relieving, sleep-enhancing properties of Blue Tea and the metabolism-boosting, detoxifying effects of Green Tea.
The infusion is visually riveting, enchanting tea enthusiasts with its vibrant blue colour that turns into exquisite purple with a drop of lemon juice. Each 1.5g tea bag has a carefully selected assembly of A+ Grade ingredients, ensuring a “symphony of flavours and a plethora of antioxidants”.
Key Product Highlights:
· The Blend: A wellness-forward mix of Blue Pea Flower (99 per cent) and Green Tea.
· Visual Magic: Famous for its natural blue colour that changes to purple with acidity (lemon).
· Convenience: Now available in easy-to-use tea bags (25 counts per jar).
· Wellness Benefits: It is rich in antioxidants, supports weight management, promotes relaxation, and boosts skin health.
· Packaging: Secure and sustainable plastic jar container ensuring freshness.
“Tea is not just a beverage; it is an experience that nurtures the mind and body,” says Dr Rupali Ambegaonkar, Business Head of Tea Culture of the World (TCW Tea Private Limited, a subsidiary of Amar Tea). “With our new Blue Pea Flower and Green Tea infusion, we are bridging the gap between age-old wellness traditions and modern convenience. We wanted to offer our customers a blend that not only looks enchanting but also serves as a daily ritual for relaxation and health. We’ve made a cup that genuinely improves the tea ritual by combining Green Tea with our iconic Blue Pea flower.”
The Blue Pea Flower Infusion with Green Tea will be available for purchase starting this week. Tea enthusiasts can order directly from the brand’s D2C website or find it on Amazon.
Jakarta, Pintu News – Dogecoin price moved above the $0.14 level after recording a weekly gain of around 20%, in line with the overall strengthening trend of the crypto market. Currently, the meme coin is approaching an important resistance area in the range of $0.151 to $0.165.
Since December 31, DOGE has gained around 30%, which is the highest level since November 30. This performance has coincided with the rally of other memecoins, such as Shiba Inu , Pepe , and Pudgy Penguins .
In aggregate, the market capitalization of meme coins has now surpassed $50 billion. Open interest in Dogecoin has also surged to close to $2 billion. Meanwhile, the DOGE spot ETF recorded $3.9 million in new inflows at the start of 2026.
The influx of new funds and increased trader attention suggests that the upward momentum has the potential to continue, provided the DOGE is able to break and hold above the resistance zone.
On January 8, 2026, Dogecoin saw a 1.64% decline over the past 24 hours, trading at $0.1462, or approximately IDR2,455. During that time, DOGE fluctuated within a range of IDR2,575 to IDR2,438.
At the time of writing, Dogecoin’s market capitalization is estimated at around IDR428.33 trillion, with a 24-hour trading volume of roughly IDR31.55 trillion.
Read also: Ethereum Price Drops to $3,100 Today: ETH Whales Getting Optimistic?
Dogecoin futures open interest surged close to $2 billion, approaching one of the highest levels in its history. This increase reflects the growing confidence of traders who are getting more aggressive in positioning themselves for bigger DOGE price moves.
The spike in open interest indicates an influx of new funds into the market, particularly from leveraged traders who are speculating on potential upward or downward price movements. This suggests increased speculative activity along with expectations of higher volatility.
This phenomenon comes amid the widespread popularity of speculative memecoins and altcoins. In recent days, DOGE has regained momentum, while the futures market reflects market participants’ readiness for more intense price fluctuations.
With the arrival of institutional products like ETFs in the DOGE ecosystem, these memecoins are further evolving into more mature and widely accepted trading instruments in the crypto market.
Dogecoin recorded significant whale activity in the past 24 hours, with large holders accumulating more than 220 million DOGE tokens. This surge in transactions reflects the growing interest of well-capitalized investors amid the recent strengthening of the crypto market.
Read also: Top 3 Crypto Price Predictions: Dogecoin, Cardano, and Chainlink Ready for a Big Jump?
The buying action shows the increasing level of confidence among whales as Dogecoin follows the general strengthening trend of crypto assets.
In many cases, accumulation by large holders is seen as a form of anticipation of potentially larger price movements in the future.
In the short term, DOGE price last traded around $0.14 on the 24-hour time frame (7/1), reflecting mild pressure. The price is still below the $0.15 level, which has so far been the main impediment to further gains after the previous rally. The RSI indicator is at 54 levels, signaling relatively neutral momentum.
On the 4-hour time frame (7/1), the MACD indicator shows a bearish crossover, with the histogram turning negative. This indicates weakening upward momentum in the short term. Nevertheless, the MACD line is still above the zero level, so the positive bias on a broader scale is maintained.

From a technical perspective, the nearest resistance area is in the range of $0.15 to $0.155. A valid breakout above this zone could potentially push the price towards the $0.165 area. Furthermore, the next upside target is around the psychological level of $0.20.
On the contrary, failure to defend the $0.14 level could weaken the near-term price structure. In such a scenario, DOGE risks dropping to the $0.135 area, and if the pressure persists, a further drop towards $0.128 becomes open.
That’s the latest information about crypto. Follow us on Google News to get the latest crypto news about crypto projects and blockchain technology. Also, learn crypto from scratch with complete discussion through Pintu Academy and stay up-to-date with the latest crypto market such as bitcoin price today, xrp coin price today, dogecoin and other crypto asset prices through Pintu Market.
Enjoy an easy and secure crypto trading experience by downloading Pintu crypto app through Google Play Store or App Store now. Also, get a web trading experience with various advanced trading tools such as pro charting, various types of order types, and portfolio tracker only at Pintu Pro.
*Disclaimer
This content aims to enrich readers’ information. Pintu collects this information from various relevant sources and is not influenced by outside parties. Note that an asset’s past performance does not determine its projected future performance. Crypto trading activities have high risk and volatility, always do your own research and use cold cash before investing. All activities of buying and selling bitcoin and other crypto asset investments are the responsibility of the reader.
Reference:
The intraday negative pressure increased on copper price trading due to stochastic attempt to exit from the overbought level, which forces it to settle below $5.9700, forcing it to form corrective waves by reaching $5.7900.
The price might decline towards the initial support at $5.7500 by the continuation of the negative pressure will increase the chances of breaking this support, to expect targeting extra corrective stations that begin at $5.6300 and $5.5100, while its success to step above $6.000 will open the way for recording new historical gains by its rally towards the bullish channel’s resistance at $6.1800.
The expected trading range for today is between $5.6300 and $5.9700
Trend forecast: Bearish
KUALA LUMPUR: USANA Malaysia has once again been recognised as the No. 1 Combination Dietary Supplements Brand in Malaysia by global market research firm Euromonitor International. This latest accolade marks eight consecutive years that USANA Malaysia has led the market in the combination dietary supplements category.
The ranking is based on Euromonitor International’s independent market research, which measures USANA’s retail value share among all dietary supplement brands in Malaysia.
“Being recognised for eight consecutive years is a powerful testament to the trust consumers place in our products,” said Vivienne Lee, USANA Regional Vice President. “This continued leadership in the combination dietary supplements category reflects USANA’s unwavering commitment to quality, scientific innovation and excellence.”
Euromonitor International is the world’s leading provider of global business intelligence, market analysis and consumer insights. With analysts based worldwide, the organisation combines global expertise with deep local knowledge to help businesses anticipate industry, economic and consumer trends.
“I would like to extend my sincere gratitude to our loyal customers and the entire USANA family,” said Sabrina Khoo, Regional General Manager.
“Your continued trust and support have made this eight-year milestone possible. Together, we will continue to empower individuals to support their health and wellbeing with high-quality, science-backed nutrition.”
XRP remains one of the most promising cryptocurrencies in the market, with bright long-term capabilities. XRP is known for its volatility, but still trades above $2.00 psychological level most of the time, showing investor demand. At the moment, XRP is sliding below major technical levels after failing to hold the $2.40 support level, which was recorded on Tuesday. The market downturn comes just days ahead of the landmark Market Structure Bill, which is set to legitimize XRP as a non-security and eliminate lingering regulatory uncertainties.
XRP is crashing in the cryptocurrency market, reportedly dropping nearly 5.85% over the past 24 hours. XRP, currently the fourth-largest cryptocurrency, is trading at $2.25, dropping from a two-month high of $2.41 recorded on January 6, 2025. At the beginning of 2026, XRP capitalized on the fresh market environment and outperformed the majority of altcoins. The sudden drop in XRP’s market momentum is fueled by factors like profit-taking after a rally and technical breakdown below major levels. XRP’s short-term decline is accompanied by a 20.9% weekly rally, reflecting profit-taking amid overbought signals.
According to the current market data, XRP is trading at $2.25, with a market capitalization of $136.55 billion and a daily trading volume of $6.58 billion. XRP is underperforming the broader cryptocurrency market, and the price data shows that the digital asset is consolidating below key resistance levels despite sustained ETF support. XRP currently trades above the 50-Day SMA ($ 2.04) and below the 200-Day SMA ($ 2.45), indicating a neutral-to-bullish transition phase with short-term strength. Based on XRP’s historic trend, this trend could be the early signal of a recovery with upside potential if the 200-Day SMA breaks. XRP has traded 14/30 (47%) days in green, and its fear and greed index shows 44, which is identified as fear in the cryptocurrency market.
XRP’s price stability has always been a topic of debate and has created different opinions among investors. Its extreme volatility backs the theory to an extent, but numerous investors still believe in XRP and claim it could be the next big thing in the market. Jake Claver, a financial expert and the CEO of Digital Ascension Group, commented on XRP. He commented that there are a few things that matter if a digital asset is going to be taken seriously as part of real financial infrastructure: price stability, network reliability, consistent transaction volume, strong partnerships, and institutional support. He noted that XRP checks all those boxes and continues to grow as next-gen financial infrastructure.
Akanksha Saxena, a Web3 expert, said in an X post that XRP was attracting serious attention in 2026 due to a combination of strong factors rather than price action alone. She explained that demand for XRP ETFs was growing rapidly, with spot XRP ETFs recording nearly $100 million in inflows since the start of the year. She noted that XRP had outperformed major cryptocurrencies, rising about 25% since January 1, compared with Bitcoin’s 6% gain and Ethereum’s 10% increase. Saxena also observed that market and social sentiment around XRP had turned increasingly bullish. Additionally, she highlighted that rising network activity, including more transactions and higher on-chain usage, pointed to growing real-world interest. She concluded that when fundamentals, sentiment, and market structure align, they often create momentum worth watching.
XRP is consolidating at the moment and is expected to stay within the $2.25-$2.40 price range in the next few days. However, XRP is showing short-term bearish momentum; it is still trading with a weekly high of 20.38%. According to the recent data, XRP is unlikely to trigger a positive trend today and reclaim the key levels. Even though a steady bullish outlook is not guaranteed, the ETF support could spark an intraday recovery near $2.30.
| Date | Min Price (USD) | Avg Price (USD) | Max Price (USD) |
|---|---|---|---|
| Jan 7, 2026 | 2.25 | 2.33 | 2.35 |
| Jan 8, 2026 | 2.24 | 2.31 | 2.36 |
| Jan 9, 2026 | 2.23 | 2.29 | 2.37 |
| Jan 10, 2026 | 2.25 | 2.30 | 2.38 |
| Jan 11, 2026 | 2.26 | 2.32 | 2.39 |
| Jan 12, 2026 | 2.28 | 2.36 | 2.41 |
| Jan 13, 2026 | 2.29 | 2.36 | 2.42 |
Disclaimer: XRP price prediction data is subject to change based on the market dynamics. The table is based on predictive modeling and should not be considered financial advice.
According to XRP price prediction today, Ripple’s native cryptocurrency is expected to trade at an average maximum price of 2.38. XRP may reclaim the $2.40 barrier soon, though traders will likely need to wait until at least next week to see the digital asset challenge the $3.00 psychological level.
Yes. XRP has a high chance of breaking above the $2.50 support level ahead of the Market Structure Bill, which is currently scheduled for January 15, 2026. Strong ETF inflows and improving market sentiment, despite the short-term price correction, are still enough to drive XRP upward and trigger a rally. The target price can be achieved by January 10 if ETF inflows remain strong and XRP breaks and holds above the 200-day SMA. According to the observation, failure to clear the $2.45 resistance level will be key and is likely to keep XRP range-bound until the Market Structure Bill markup.
By HOKANEWS Web3 Gaming Desk
The daily puzzle mechanics inside Hamster Kombat have become a defining feature of the play-to-earn gaming trend, and the Daily Cipher continues to be one of the most anticipated challenges for its growing community. On January 08, 2026, thousands of players once again logged into Telegram to decode a fresh Morse-code message in exchange for in-game rewards and HMSTR coins.
Blending classic code-breaking logic with modern Web3 gaming, the Daily Cipher has helped Hamster Kombat stand out in an increasingly crowded Telegram gaming landscape. The challenge is simple in concept, yet engaging enough to keep players returning every day.
The Hamster Kombat Daily Cipher is a recurring daily puzzle that tasks players with decoding a word or phrase written in Morse code. The cipher is made up of dots and dashes, and players must correctly interpret the signals to reveal the hidden message.
Once the correct word is submitted, players receive in-game rewards that can be used for upgrades, leveling, bonuses, and overall progression inside the Hamster Kombat ecosystem. These rewards are part of the game’s internal economy and contribute to long-term advancement rather than instant competition.
One of the key reasons for the feature’s popularity is accessibility. Hamster Kombat operates entirely through Telegram, meaning players do not need to install additional apps or manage external wallets. The official bot handles gameplay and in-game balances, allowing users to participate instantly.
Unlike simple tap-to-earn mechanics, the Daily Cipher adds a layer of active thinking. Players must recognize patterns, interpret Morse code, and submit answers correctly within the daily cycle. This approach encourages learning, problem-solving, and habit-building rather than passive clicking.
In the broader Web3 gaming space, features like the Daily Cipher highlight a shift toward interactive engagement models. By combining familiar logic puzzles with blockchain-inspired rewards, Hamster Kombat appeals to both casual players and those interested in experimenting with crypto-themed games.
For January 08, 2026, the official Daily Cipher word is:
TREND
The Morse code breakdown for today’s cipher is as follows:
Also, read this article: TON Station Daily Combo to unlock more exciting tasks, bonus rewards, and extra coins!
T: dash
R: dot dash dot
E: dot
N: dash dot
D: dash dot dot
Players must enter the decoded word exactly as required to receive their reward.
Solving the Daily Cipher is designed to be straightforward, even for players who are new to Morse code.
First, open Telegram and access the official Hamster Kombat bot.
Next, locate the Daily Cipher icon within the game interface.
Tap the icon to activate Cipher Mode. A visual confirmation screen appears, indicating that the challenge has started.
Use short taps to represent dots and long taps to represent dashes.
Maintain a brief pause between characters to ensure accurate input.
Once the full word is decoded, submit the answer.
If correct, the reward is added instantly to your in-game balance.
The entire process typically takes only a few minutes.
Beyond the Daily Cipher, Hamster Kombat offers several additional ways for players to grow their in-game coin balance.
Daily tasks and recurring events provide consistent rewards for regular participation and are often the primary source of steady progress.
The Toxin Challenge tournament offers competitive gameplay with potential daily payouts reaching up to one million coins, making it a popular option for active players.
Mini-games and elite missions provide alternative earning paths that combine entertainment with progression-based rewards.
By combining these activities with the Daily Cipher, players can optimize their daily earnings without excessive time investment.
Players should remain mindful of basic safety practices while participating in Telegram-based games.
All rewards are issued as in-game coins and do not guarantee real-world monetary value.
Only the official Hamster Kombat Telegram bot should be used to avoid impersonation or scam attempts.
Private keys, recovery phrases, and personal data should never be shared.
This article is for informational purposes only and does not constitute financial advice.
Understanding these limitations helps maintain realistic expectations and ensures a safe gaming experience.
The continued popularity of the Daily Cipher reflects Hamster Kombat’s broader strategy: encouraging daily interaction through lightweight, engaging challenges. By integrating classic puzzles like Morse code into a modern Telegram game, the project has created a unique identity within the Web3 gaming ecosystem.
As chat-based gaming continues to expand in 2026, features that promote thinking, consistency, and community interaction are likely to remain central to player retention.
The Hamster Kombat Daily Cipher for January 08, 2026 once again demonstrates how simple logic-based challenges can drive daily engagement in play-to-earn games. By solving the Morse code puzzle and participating consistently, players can earn HMSTR coins, progress steadily, and enjoy a more interactive gaming experience.
For those exploring Web3 gaming through Telegram, the Daily Cipher offers a balanced mix of challenge and accessibility—proving that earning rewards does not always require complex mechanics or high-risk participation.
hokanews.com – Not Just Crypto News. It’s Crypto Culture.
Writer
@Erlin
Erlin is an experienced crypto writer who loves to explore the intersection of blockchain technology and financial markets. She regularly provides insights into the latest trends and innovations in the digital currency space.
Check out other news and articles on Google News


