The main category of All News Articles.
You can use the search box below to find what you need.
[wd_asp id=1]
The main category of All News Articles.
You can use the search box below to find what you need.
[wd_asp id=1]
In recent times, matcha has experienced a surge in popularity, going from being an occasional order for some to a billion-dollar industry in 2025. The boom came with a widespread appearance on menus from local cafes to franchise coffee shops, but before, the green tea mixture had cemented itself within celebrity culture.
Matcha became a symbol of healthy drinking thanks in part to its proximity to the likes of wellness influencer Gwyneth Paltrow, models Bella Hadid and Kylie Jenner, and fitness queen Jessica Alba. When TikTok came out and influencer culture jumped to a new level, the green drink took charge, mostly due to its unique hue and totally social media-friendly appearance. But what is this pretty green drink, exactly?
Matcha is a vibrant green powder that, when combined with water or milk, creates a colorfully delicious, nutrient-packed drink. Though commonly mistaken for a powdered version of a more traditional green tea, the taste of matcha is actually much sweeter and considered much smoother in comparison. This specific type of green tea, unlike its conventional counterparts, grows in the shade, which aids in the plant’s production of health benefits like antioxidants and anti-inflammatories.

But is matcha tea really as healthy as you think? Studies have shown that with matcha’s caffeine levels, drinkers saw an increase in upper body muscles as well as a morning boost that didn’t leave them feeling as wired as coffee. (Is coffee or match better for you? Read on.)
Additionally, the antioxidants in matcha aid in reducing cell damage and work to prevent disease. The tea can also lower cholesterol, lower blood pressure, encourage brain function and cognitive function, and possibly even protect your liver. Though the most impressive benefit from matcha tea comes from its unique strand of catechin, EGCG. Some studies have indicated that the catechin found in green tea, like matcha, could work as a preventative measure for cancer development – specifically colon cancer – and could improve cancer treatment methods.
But how can this powerful little powder pack such a punch? Senior dietitian at UCLA Health Santa Monica, Yasi Ansari, explains it simply. “Unlike steeped tea, where the leaves are discarded, matcha involves consuming the whole leaf in powdered form, which concentrates its nutrients and antioxidants.”
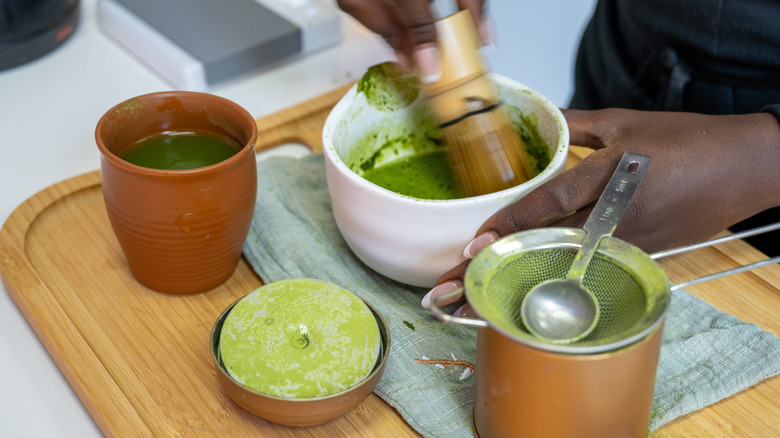
As it turns out, matcha green tea can do a lot for mental health, too. Dr. Leigh Anne Frame, Executive Director of the Office of Integrative Medicine and Health at George Washington University, told Verywell Health that matcha “has been shown to promote relaxation without sedation by increasing alpha brain wave activity and modulating neurotransmitters like GABA, dopamine, and serotonin.”
Serotonin and dopamine are neurotransmitters that have earned the nickname “happy hormones.” The two chemicals work to encourage and regulate sleep, mood, and blood flow. With high levels of either, individuals tend to feel motivated and concentrated while also feeling a sense of internal health, given serotonin’s regulation of gut health.
So, drinking a cup of matcha in the morning may just help in boosting your mindset and mood. However, it’s important to remember that the drink is not the end-all, be-all for mental health support. As Dr. Frame clarified, “Matcha isn’t a cure-all, but it can be a gentle, supportive addition to a comprehensive self-care routine” (via GW School of Medicine and Health Sciences).
Attention is also turning to meme assets, where the Dogecoin price prediction stays cautious as DOGE moves sideways and struggles to build strong momentum. This mix of pressure and consolidation defines the current market mood.
Due to this volatility, smart traders are now shifting toward safer and more structured options like Zero Knowledge Proof. Its live presale auction is seeing a flood of activity after ZKP featured on CoinMarketCap. This global visibility builds trust and is drawing more buyers to its fair presale auction. This mix of demand and reach is why many now view it as one of the top crypto gainers to watch early.
Solana trades lower as sellers stay in control across major timeframes. Solana price today sits near $127.82 and remains below the 20, 50, and 200 moving averages. This keeps the short and long trend weak. The area around $127 acts as near-term support, while resistance stands near $134. Momentum tools stay bearish. RSI sits near 39, and MACD signals selling pressure.
Network updates add context, but price still struggles. Solana price today reflects pressure despite strong resilience during a large DDoS attack. The network stayed online during peak load. Visa also expanded USDC settlement on Solana.
Still, sellers dominate. Over the next few days, the price may move between $115 and $140. A short bounce remains possible if oversold levels trigger relief buying, but risks remain present.
Dogecoin trades near $0.13 after a sharp market shakeout cleared heavy leverage. Dogecoin price prediction remains mixed as DOGE avoided deep losses during liquidations worth over $650 million.
Data shows DOGE saw only $12 million in long liquidations, far less than Bitcoin or Ethereum. Open interest has dropped nearly 70% since September. This reduced forced selling and helped stabilize the price. Spot ETF demand stays weak.

Price action now moves sideways. Dogecoin price prediction depends on holding the $0.128 to $0.13 support zone. A break below $0.12 may lead to further downside. Resistance remains strong near $0.15. DOGE trades inside a descending channel. Any recovery needs a higher volume to confirm strength.
Zero Knowledge Proof has captured market headlines after getting featured on CoinMarketCap, the world’s biggest crypto indexing website. This single move has boosted trust among crypto users, with many rushing to join the daily ZKP presale auction.
The CoinMarketCap visibility matters because it signals legitimacy and tracking standards. After the listing, Zero Knowledge Proof’s (ZKP) exposure increased fast across social platforms and crypto forums. More people are now discovering the project each day. This sudden rise in awareness has pushed Zero Knowledge Proof into one of the most talked-about presale auction projects of 2025.
The growing attention also comes from how the Zero Knowledge Proof presale auction works. The auction runs for 450 days, and each day has its own price. That price depends only on daily demand. When more people buy, the price goes up. When fewer people join, the price stays lower. No team controls pricing. Everything runs on math. The final price comes from total funds divided by total tokens sold. This setup keeps the system fair and avoids manipulation.
Making money in the ZKP presale auction is built on a simple idea. Early days usually have fewer buyers, so prices remain lower. As awareness grows, demand rises, and prices move higher. And listing rates will be based on these high-demand days.
So, early buyers will get the widest gap between the presale auction price and the eventual listing price. Later buyers still benefit, but the advantage slowly reduces. This clear structure helps many understand how value builds over time.

Right now, ZKP is still in its early stages, and many people are only just starting to discover it. That is why interest keeps rising daily. Plus, with CoinMarketCap exposure and a fair presale auction model, some already see it among future top crypto gainers. Timing matters here. Early participation will bring the biggest edge before wider adoption kicks in.
The market is moving toward a pause, and recent price action reflects this bearish tone across major assets. Solana price today remains under pressure near key support, with sellers still controlling momentum. The Dogecoin price prediction also looks uncertain, as DOGE trades sideways and struggles to attract strong volume.
Against such uncertainty, projects like Zero Knowledge Proof offer a clearer path forward. Its CoinMarketCap feature has strengthened trust among traders. Plus, the fair presale auction model feels transparent and simple, helping ZKP gain steady interest and placing it among potential top crypto gainers going ahead.

Join the Presale Auction Now:
Website: zkp.com
Disclaimer:
The views expressed on this page are those of the author and not of The Portugal News.
Creatine supplements, when combined with an appropriate workout routine, can help enhance high-intensity exercise performance and build lean body mass. Their popularity has grown on social media, where fitness creators often promote the supplement for daily use.
We asked Pieter Cohen, MD, an associate professor of medicine at Harvard Medical School and general internist at Cambridge Health Alliance, if creatine supplements are safe to use in the long run.
*This interview has been edited and condensed for clarity.
Q: Is creatine a safe supplement for long-term daily use?
Cohen: Let’s take a step back. Before even starting a creatine supplement, you need to make sure you have the right ingredients and dose.
Unlike over-the-counter medications like Tylenol, aspirin, and Prilosec, there are no controls over the quality or quantity of dietary supplement ingredients before they’re sold. There are no checks on these things. Study after study has shown that the products that are sold as supplements are not accurately labeled.
If you’re thinking about creatine, you need to do some research to decide exactly how much you’re going to take and then find a product that is reliably labeled.
If the supplement company hired a certification nonprofit to take a deep dive into their manufacturing, and they get a stamp of approval, then you know what’s on the label matches what is in the bottle.
You can use the NSF or USP websites to research which brands are certified. Then, find that brand, and purchase only that brand. That’s a lot of hard and complicated work to make sure your supplements are accurately labeled.
If you are an adult and complete those steps, you’re good to go, and it’s safe for long-term use. But, creatine doesn’t work for everyone. We don’t exactly know why, but research has shown that, for one in three people, it doesn’t have muscle benefits. If it’s not helping you build muscles after a few weeks or a month or two, then I would stop, because it just might not work for you.
If your kidneys are healthy, you should have no problems with long-term use. If you have kidney damage or a kidney condition, then I would not recommend supplementing with protein powder, amino acids, or creatine regularly.
When people have chronic kidney damage, too much protein is not good. Creatine is like a micro-protein—it’s a few amino acids—so I could see where that would be a concern.
I would not recommend creatine for adolescents because we are not sure how this supplement affects the growing body.
:max_bytes(150000):strip_icc()/StephanieBrownnewheadshot-e5ca9ba2a404491384e9300a7871f190.jpg)
For beginners, this suggests large players may be distributing SOL into rallies, a behaviour that often appears near market tops and supports the broader bearish outlook.
Additionally, SOL is trading below the realised price of recent buyers (3–6 months and 6–12 months), meaning many newer holders are now underwater. Historically, this zone often triggers capitulation or forced selling as confidence weakens.
The next cost basis zone, ruled by SOL traders holding the tokens for 2-5 years, was around $45, aligning with the technical bottoms discussed above.
Legal risk has emerged as an additional fundamental headwind for Solana heading into 2026.
A US federal court has allowed plaintiffs to expand a class-action lawsuit tied to activity on Solana-based token-launch platforms, most notably Pump.fun.
The amended claims now draw in Solana Labs, the Solana Foundation, and key ecosystem participants, alleging insider advantages, market manipulation, and unfair token distribution practices.
While the case does not represent a ruling on guilt, its expansion increases regulatory and reputational risk for the ecosystem.
Historically, prolonged litigation has weighed on crypto assets by dampening retail sentiment, slowing institutional engagement, and raising compliance concerns for exchanges and custodians.
Even without an adverse final judgment, the lawsuit introduces uncertainty at a time when markets are already risk-averse.
For investors, this legal overhang may act as a sentiment drag during rallies, reinforcing broader bearish and consolidation scenarios for SOL until a clearer legal resolution emerges.
In 2026, Solana’s roadmap centres on Firedancer production rollout, deeper validator decentralisation, and performance scaling for institutional-grade usage.
The focus shifts toward reliability at scale, predictable fees, and tooling for payments, DeFi, and consumer apps, aiming to support real-world adoption through a full market cycle.
Despite trying latte after latte, Quentin Vennie couldn’t come around to seemingly everyone’s favorite espresso-and-milk drink.
“It just did not appeal to me,” the West Baltimore native said. “So I wanted to figure out, how do I make this something that I would want to drink?”
Matcha, the increasingly popular powder made from Asian green tea leaves and used in warm and cold beverages, turned out to be the answer.
Years later, Vennie’s journey with matcha has reached a new milestone: Equitea Matcha Studio, his first brick-and-mortar café, opens this weekend (Saturday and Sunday from 10 a.m.-3 p.m.) at 311 W. 28th St. in Remington. It will then operate Wednesdays through Sundays with the same hours, with a grand opening event to come.
It’s been a whirlwind for Vennie, who started Equitea in 2022 as a tea company before moving to Los Angeles due to lack of demand in Baltimore. On the West Coast, Vennie grew the business, landing products such as canned tea drinks in 600-plus grocers nationwide while catching the attention of actress Gwyneth Paltrow, an eventual investor in the brand.
In late 2024, Vennie moved back to his home city and soon hosted a pop-up shop at 2600 N. Howard St., the old JBGB’s building in Remington. The enthusiastic response led him to commit to the neighborhood; Vennie signed a two-year lease in May.
“Being able to bring this business back to Baltimore and anchor ourselves back in this city — it’s been an incredible thing,” he said.
The shop arrives as matcha is having its mainstream moment. Retail sales in America have increased 86% from three years ago, according to market research firm NIQ, while social media influencers tout matcha as a less-caffeinated coffee alternative. Demand for matcha is leading to supply shortages and price hikes.
Ayda Abebe, co-owner of Adee’s Coffee Roasters, said she’s seen the price of matcha increase more than once in 2025 — a reflection of its popularity.
Since the store opened in September 2023, customer demand for matcha has grown significantly at Adee’s, leading to expanded menu offerings including matcha lattes and frappes. Matcha is most popular at the shop in the summer, Abebe said — a matcha tonic made with lavender syrup is one of the store’s best sellers.
Matcha’s rise is simple to explain, she said. Just look at social media. “It’s everywhere.”
But is it right for you? I asked Vennie and Abebe to make the case for matcha.
Matcha proponents often cite its meditative qualities, which date back centuries to Buddhist monks who used the tea to help focus during quiet, contemplative moments. In a world where people and screens demand our constant attention, carving out time with a cup of matcha is a reward unto itself, Vennie said.
“It becomes a moment to slow down, to pause, to reset and recenter,” he said.
If cutting down caffeine is on your resolution list, matcha may be the solution. It generally has less caffeine than a traditional cup of coffee.
Supporters are also fast to sing the praises of L-theanine, the amino acid found in the tea leaves, which they say can help ease anxiety. Health studies have found matcha, with its fiber and antioxidants, promotes digestive health as well.
When Abebe asks customers why they’ve turned to matcha over coffee, they almost always give the same reason: “People say it’s healthier,” she said.

If we consume with our eyes first, it’s easy to see why matcha is popular. Its placid, rich green hue is an eye-catcher. When customers see a matcha drink delivered, Abebe said, the domino effect often follows. Then come the social media posts.
“Nowadays, it’s all about posting — showing what you’re eating or drinking,” she said.
To Vennie, the rise of matcha and the opening of his shop speak to a larger moment in local food trends — namely, that Baltimoreans shouldn’t have to travel to bigger cities to enjoy them.
“We shouldn’t have to jump on a plane or catch a train or go somewhere else in order to experience it,” he said. “We deserve it, you know?”
The three-day high at $4,404 is key near-term resistance since a sustained rally above that level could lead to a continuation of the long-term bull trend. Sustained trade above that high would have gold back above the prior trend high of $4,381 from October and the 10-day average, now at $4,393.
Even though a potentially bearish inverted hammer will complete for Friday, a higher daily high and higher low was established for the first day in four. This shows a degree of support that shows the potential for further strengthening. If gold stays above Wednesday’s low of $4,274, a higher swing low is established. It takes on greater significance since it is aligned with the 20-day average.
Gold is in its first pullback following a new record high breakout in late-December to $4,550. Dynamic support was seen near the 20-day average since mid-November and is being tested once again. The price area near the 20-day line is also indicated as possible support by a top trend channel line. A second upside breakout of the channel was sustained in December, leading to a new trend high. So, the current pullback is both the first since the new trend high and for the channel breakout.
The expectation is that support will hold, leading to further strengthening. Above $4,404 and gold targets a $4,516 to $4,578 price zone for potential resistance. On the downside, a break below $4,274 eliminates a higher swing low and puts the 50-day line in site at $4,180.
For a look at all of today’s economic events, check out our economic calendar.
By Cathy Madeo
Every January, people are in search of a way to reset. Yoga retreats and wellness getaways promise renewal, and while those experiences can be transformative, not everyone can take time away. The good news is that the peace we seek from a retreat is not actually found in the destination itself. They come from slowing down, reconnecting to ourselves, and creating space just to be. You don’t need to travel to begin again. With a few intentional yoga tools, you can bring the essence of a retreat into your daily life and start 2026 refreshed, focused, and excited.
How you start your day sets the tone for everything that follows. Early morning is an auspicious time for meditation and reflection because the mind is already in a naturally receptive state. Before your day’s momentum picks up, rather than reaching for your phone or rushing through tasks, take a few quiet moments to connect within. Sit comfortably, close your eyes, and take 5 slow inhales and exhales. Try lengthening your exhales a few beats longer than your inhales, which will ground your nervous system and enter into a state of gratitude.
From this place, set an intention for your day. It can be as simple as: Today, I chose kindness; or I am creative and focused. This small act, being intentional, can yield big results throughout your day.

Then move your body gently. In the morning, our joints are usually stiff, so use this morning movement to circle and move your joints with a few cat-cows, gentle twists, and side bends, wrist, ankle, and hip circles.
Even on the busiest days, you can create moments of rest. I think of them as hitting the pause button. A few mindful breaths between meetings, or while waiting for your afternoon coffee, can shift your energy and give you clarity.
If you spend a lot of time sitting, give yourself a short movement break. Gently stretch your shoulders, roll your neck, or take a short walk outside. Recommend this pic. Any small pattern interrupt helps refuel your body and reset your focus mid-day.

Bring mindfulness to your meals, too. At a retreat, meals are often slow, quiet, and nourishing. You can bring that same awareness home by taking the first few bites without distractions. Notice the taste, texture, and sensation of eating. Presence turns even the simplest meal into a grounding ritual.

Retreats remind us how deeply rest can heal, yet it is often the first thing we abandon in daily life. Start by creating a small buffer between your day and your night. Turn off screens an hour before bed and dim the lights. Take a relaxing bath with essential oils, do your favorite skincare routine, or light some palo santo. You can listen to soothing music or a guided meditation while lying on your back with your legs up the wall for five minutes This simple pose calms the nervous system and encourages circulation.
Before sleep, reflect on one thing you are grateful for or one thing you learned that day. Gratitude is a quiet but powerful practice that softens the mind and anchors you in what is working instead of what is missing.

Remember, rest is not lazy. It is essential. When you give yourself permission to slow down, you restore the energy needed to show up fully for your work, your relationships, and yourself.
If you have a free weekend or even a partial one, turn it into a personal retreat! Begin with yoga, go on a nature walk, make yourself nourishing food, and enjoy it without multitasking. Meditate to bring you into a calm state and then journal about things you want to let go of from the previous year and what you want to call into existence in 2026. During this weekend, permit yourself to pause.

A yoga retreat can be deeply inspiring, offering time and space to reconnect with yourself. But even if travel or time away isn’t possible right now, yoga reminds us that peace begins within. The same clarity and renewal people find on retreat can be cultivated at home through intention and simple daily practice.

Cathy Madeo is a yoga expert and founder of Cathy Madeo Yoga, a global online yoga school educating and empowering thousands of yoga students and teachers worldwide with her online courses and Yoga Teacher Trainings. You can learn more at www.cathymadeoyoga.com and follow her on Instagram @cathymadeoyoga
Disclaimer
The Content is not intended to be a substitute for professional medical advice, diagnosis, or treatment. Always seek the advice of your physician or other qualified health provider with any questions you may have regarding a medical condition.
Given the long-term nature of the 200-day line there is the potential for a completion of the bearish correction and a bullish reversal from the area around the average. Recent volatility however could result in a short-term failure of the 200-day average and a dip to the 78.6% Fibonacci retracement at $3.45. If that was followed quickly by a reclaim of the 200-day line, the potential for further upside rises.
Bearish momentum spiked following the December $5.50 peak, which was a three-year high. The drop quickly put natural gas below the 20-day average and then the 50-day average. Resistance near the 20-day line was confirmed a week ago Wednesday during the first pullback following a breakdown of the 20-day average. On Tuesday a pullback found resistance a bit below the 50-day average. That led to Friday’s new trend low.
This behavior shows aggressive selling that may still be early in a second leg down from the top. If this pattern plays out like it might, the 78.6% retracement is also at risk of failure. A lower target at $3.26 would then be likely. That’s where the second leg down (CD) is 78.6% of the decline seen in the first leg down (AB). There is the potential for support to be seen near that harmonic relationship between the two downswings.
In the short-term and before further testing of support near the 200-day line, a breakout above today’s high of $3.70 shows strength but within the larger bearish structure. Key resistance to consider would then be around the 10-day average, now at $4.03 and falling. Wednesday’s high at $3.98 is nearby and can be used to assistant in gauging potential short-term resistance.
The bigger picture quarterly chart suggests the potential for an eventual strong bullish recovery once the current correction is complete. In the Q4 2025 natural gas closed at $3.71 – above the prior quarter high of $3.63. That confirmed a bullish breakout of a quarterly bull hammer candlestick pattern and the completion of the first quarterly pullback for the rally begun from the 2024 low.
For a look at all of today’s economic events, check out our economic calendar.
Use left and right arrow keys to navigate between menu items.
Use escape to exit the menu.
Sign Up
Create a free account to access exclusive content, play games, solve puzzles, test your pop-culture knowledge and receive special offers.
Already have an account? Login
Jake Claver, a renowned XRP promoter and CEO of Digital Ascension Group, is again leaning into a familiar XRP thesis: behind-the-scenes institutional adoption, NDAs, and “domino” catalysts, only days after analyst Zach Rector publicly criticized Claver’s failed “$100 XRP by end of 2025” prediction as misleading.
$100 XRP Only Delayed, Says Claver
In a post on Jan.1, Claver responded: “Timelines always get extended,” and added: “I should know this by now from all that we’ve built in the past 3 years, working with partners and regulators. I’m sure Ripple and many others have felt and still feel the same way after 13.5 years. The Domino Theory still stands, Real world events will play out, and XRP will become the backbone of markets in the future.”
In a series of posts spanning Dec. 27 through Jan. 1, Claver argued that “real world events will play out, and XRP will become the backbone of markets in the future.” A Jan. 1 post focused on Ripple’s non-disclosure agreements, which Claver described as a signal that large counterparties are already preparing to build with XRP.
“Ripple signing over 1,700 non-disclosure agreements probably isn’t random,” he wrote. “These most likely cover talks with major players—governments, global banks, payment networks, big universities, and Fortune 500 firms—all laying the groundwork to use XRP. The pieces for mass adoption have been falling into place behind the scenes for quite a while.”
Earlier posts pressed the same point with higher conviction. On Dec. 28, Claver claimed: “Major institutions are stacking up XRP behind the scenes while keeping the public in the dark. The current price is merely a shadow of what’s coming. When XRP transforms into the foundation of international finance, today’s hesitation will become tomorrow’s regret. In my opinion, nothing in crypto space offers this level of certainty and potential for massive returns.”
On Dec. 31, he described XRP “as built to upgrade the existing financial system,” while adding that “blockchain isn’t just for storing value, it can power a faster, more open financial system. For that, you need high-performance infrastructure like XRP.”
As reported on Bitcoinist yesterday, Rector’s criticism has been less about making bold forecasts than about the way they are delivered. Rector argued there was “no plausible scenario” for a roughly 5,000% move in the time window implied by the $100 call, and that the messaging leaned on suggestions of privileged insight rather than probabilistic framing.
Rector’s allegations also extended beyond price talk into claims about XRP-focused funds associated with Claver’s orbit. “Jake and his scheme, his business has grown so big they’ve taken in so much XRP from our community,” Rector said. “There’s a massive discrepancy from what he’s saying publicly and what investors are telling me privately.”
At press time, XRP traded at $1.89.