The main category of All News Articles.
You can use the search box below to find what you need.
[wd_asp id=1]
The main category of All News Articles.
You can use the search box below to find what you need.
[wd_asp id=1]
Gold (XAU/USD) continues to consolidate at elevated levels near $4,200, as traders prepare for the Federal Open Market Committee (FOMC) decision on December 9–10. Markets have priced in an 87% probability of a 25-basis-point rate cut, which would lower the federal funds range to 3.5%–3.75%. This expectation has underpinned safe-haven assets, driving steady inflows into gold despite moderate risk appetite across equity markets.
Over the past week, spot gold traded within a $4,163.80–$4,264.70 range, closing at $4,198.68, down just 0.41%. The U.S. dollar index (DXY) slipped below 102.00, reflecting soft labor market data — including a 32,000 job loss reported by ADP and 71,321 layoffs from Challenger — confirming that the economy continues to cool. Weaker yields and dovish rhetoric from policymakers have reinforced demand for non-yielding assets like gold.
The rally in gold prices has been further supported by the Indian rupee’s depreciation to 90 per dollar, driving MCX gold futures up by ₹958 (0.74%) this week to ₹85,260 per 10 grams, outperforming global benchmarks. In parallel, Comex gold futures slipped $11.9 (-0.28%), consolidating gains after touching six-week highs near $4,260. The weaker U.S. dollar has also boosted physical gold demand across Asia, especially in China and India, where retail purchases have risen over 15% month-on-month.
Geopolitical uncertainty in Eastern Europe and the Middle East continues to sustain safe-haven demand, while inflation in major economies remains above central bank targets. These macro headwinds make gold’s role as a portfolio hedge increasingly strategic for institutional and retail investors alike.
From a structural standpoint, XAU/USD remains technically bullish while trading above the $4,133.95 pivot, which represents the 50% retracement between $3,886.46 and $4,264.70. As long as prices hold above this zone, buyers remain in control. A confirmed breakout above $4,264.70 would expose the next resistance at $4,381.44, marking a potential retest of the all-time high.
If sellers push below $4,133.95, initial support emerges at $4,075.58, followed by $3,886.46, which served as the October low and coincides with the upper boundary of the intermediate retracement zone at $3,720.25–$3,846.50. The RSI remains above 60, confirming momentum strength, while the MACD histogram sustains a positive bias. The overall technical configuration still favors continuation rather than reversal.
Investor sentiment in gold remains decisively positive. Institutional data show continued accumulation by central banks, with net global reserves rising by 19 tonnes in November, led by China, Turkey, and India. ETF inflows resumed modestly after two months of outflows, reflecting improving conviction ahead of the Fed meeting.
In retail markets, online gold ETFs and derivatives have seen increased trading volume — up 11% week-on-week on Comex — as traders hedge against policy uncertainty. Social sentiment data also confirm a surge in bullish positioning, with gold-related discussions rising 26% on financial platforms over the last five days.
While gold remains the anchor of the precious metals complex, silver (XAG/USD) has outperformed in recent sessions. Comex silver surged by $2.40 (4.19%) to $59.90 per ounce, while domestic Indian silver futures skyrocketed ₹8,427 (4.81%) to ₹185,234 per kilogram. The industrial demand surge, coupled with tight global supply, has pushed analysts to forecast a move toward ₹200,000–₹225,000 per kilogram in early 2026.
Platinum and palladium posted mild gains of 0.7% and 0.4% respectively, reflecting broader sector stability. Gold’s relative performance remains steady, supported by its defensive utility, while silver’s parabolic momentum may invite near-term profit-taking.
Recent U.S. macro data reinforce the Fed’s easing trajectory. The PCE inflation report showed headline inflation rising 0.3% month-over-month and 2.8% year-over-year, with core inflation also easing to 2.8%. Combined with soft labor data and declining consumer inflation expectations, this suggests the Fed has room to maintain a dovish stance.
The University of Michigan Consumer Sentiment Index climbed to 53.3, reflecting moderate optimism among consumers, yet overall inflation expectations remain anchored. If the Fed confirms a rate cut and signals a dovish roadmap into 2026, gold could easily test the $4,300–$4,380 range within weeks. Conversely, a hawkish tone could trigger a temporary pullback toward $4,100 before new buying reemerges.
The World Gold Council estimates that central banks collectively purchased over 1,000 tonnes of gold in 2025, marking the second-highest annual total in history. Persistent accumulation reflects a strategic pivot toward asset diversification and a hedge against sovereign debt and dollar volatility. Institutional investors have also increased allocations to gold-backed ETFs and mining equities.
Gold producers like Alamos Gold (AGI), Barrick Gold (GOLD), and Royal Gold (RGLD) have all raised production guidance for 2026, anticipating higher realized prices and improved free cash flow margins. AGI recently saw its price target upgraded to $49 from $44, reinforcing a bullish view across the gold equity space.
Gold’s volatility profile remains stable. The CBOE Gold Volatility Index (GVZ) stands near 13.4, well below its October peak of 17.2, suggesting calm accumulation rather than panic buying. Trading volume remains elevated — averaging $65 billion daily across global futures markets — with short-term positioning favoring upside breakouts over downside corrections.
The 200-day moving average now sits at $3,960, with the 50-day EMA near $4,120, both below current prices, confirming bullish structure. Traders continue to “buy weakness,” using dips toward $4,130–$4,150 as reentry zones.
All attention now shifts to next week’s FOMC decision, followed by the Fed Chair Jerome Powell’s press conference. Markets will also monitor U.S. Jobless Claims, Employment Cost Index, and JOLTS Job Openings data for additional policy cues. Abroad, China’s trade and inflation reports could influence gold’s medium-term trajectory through currency and import demand effects.
Gold (XAU/USD) trades near $4,198, holding firm above the key support of $4,133.95 as buyers defend momentum. A break above $4,264.70 could accelerate gains toward $4,381.44–$4,420, while downside support rests near $4,075.58. The 10-year U.S. yield at 4.14% and a softer dollar (DXY 101.5) continue to boost demand. ETF inflows exceeded $685 million this week, with central banks purchasing over 1,000 tonnes year-to-date. Technical strength remains intact as gold trades above its 50-day EMA at $4,120, signaling sustained accumulation. Traders eye the FOMC rate cut decision, which could trigger a new rally above $4,300. Verdict: BUY on dips between $4,100–$4,150, targeting $4,350–$4,380 short term.
The end of the year has been especially harsh for Dogecoin. Most cryptos have suffered, but DOGE has fallen to year lows, and current Dogecoin price predictions are bleak. However, there are still reasons to be hopeful for 2026, as Elon Musk’s help seems to be coming again.
Another meme coin, DeepSnitch AI, is not only hopeful but seems to have an open path to become next year’s big crypto explosion. Its AI-powered tool could change crypto investing for the best, and generate exponential returns in the process.
On December 5, a report in The Street claimed that on Tesla’s website, there is a DOGE checkout code (not yet activated) that would allow you to pay for a car with Dogecoin. If confirmed, the development would likely boost Dogecoin price prediction, at least in the short term.
As it will be discussed in the Dogecoin technical analysis section, the current outlook for the dog-themed meme is pretty bearish. It is still to be seen whether, even with Elon Musk’s help (which is a big DOGE price driver), the coin can recover significant ground next year.
At any event, for other meme coins like DeepSnitch AI and MemeCore the forecast is much better, so Dogecoin’s troubles aren’t pervasive across the segment.
DeepSnitch AI is a fascinating combination of sophisticated AI technology with meme cultural appeal. Unlike other memes that simply add a funny character to what are otherwise use cases wholly unrelated to meme culture, DeepSnitch AI prods at the core of what memes represent.
Memes swarmed after the GameStop short squeeze, because the event was perceived by millions as a fight against injustice from powerful financial players. As it happens, DeepSnitch AI’s mission is precisely to empower small investors, leveling the playing field with big whales.
Its meme character, Snitch, a cheeky mouse dressed as a space superhero, is the perfect embodiment of this. And behind this, there is a top-notch system of AI agents that transform crypto data into business intelligence, available for everyone.
DeepSnitch AI’s successful presale confirms its huge potential. More than $680k have been raised in just the second stage, and the low entry price of only $0.02629 allows for huge upside. Additionally, those who buy at least $2,000 will get a 50% bonus, and those who buy $5,000 or more will get a 100% bonus.
But if you want to enjoy returns that would trump even the wildest Dogecoin price prediction, you need to buy now into the presale.
Simply put, Dogecoin’s price prediction is currently bleak because the coin has fallen to its year low. On December 1, in the midst of the so-called “Grand Canyon drop” that affected the whole crypto, DOGE briefly touched a bottom of $0.1326.
What makes this fall more concerning is that it isn’t a solitary event. So far, as Dogecoin chart momentum shows, in the last couple of weeks the coin has fallen 3 times below what was its ultimate hard support this year: $0.14.

The reason why Dogecoin price prediction is still hopeful for 2026 is simply that, in recent history, it has rebounded from deeper troughs. A case in hand: last year it spiked from $0.10 to $0.40 in 3 months. If it has done it recently, it might do it again in 2026.
MemeCore’s outlook is better than the current Dogecoin price prediction. The coin has recovered some ground after a sharp fall on November 27, when it fell abruptly from $1.90 to $1.25 in just 5 hours (a 34% drop).
However, since that day low of $1.22 it has risen to $1.38 at a time when most other memes were losing. This is a clear sign of differentiation, which might become more relevant next year.

Dogecoin’s price prediction has a few reasons for being hopeful. For DeepSnitch AI, the outlook is way better. This new crypto project has the potential to change crypto investing in 2026 and generate 100x-like returns.
However, those who wish to be part of that must take advantage of the generous bonuses of 50% (Code: DSNTVIP50) and 100% (Code: DSNTVVIP100). And they need to act quickly, since the bonuses will be valid only until the end of December.
Dogecoin’s price prediction gets pushed not because many people will actually buy a car with DOGE, but because it signals Elon Musk’s support and commitment towards the coin.
The fact that it has concrete utility, which “pure” memes do not have.
Its deep alignment with the core of meme culture: cheekiness, rebelliousness, and a fight for justice.
Prof Geraldine Moses was speaking to a nurse who told her something concerning: patients with kidney failure were taking “iron supplements” that contained almost no iron.
Patients on kidney dialysis often need iron supplements because the disease reduces the body’s ability to produce red blood cells, leading to iron deficiency and anaemia.
Moses, a doctor of clinical pharmacy specialising in drugs information, said it came as no surprise to her because of the proliferation of what she describes as “useless” and “ineffective” iron products.
Sold online, in supermarkets and by other retailers, the tablets contain minuscule amounts – 5mg or less per serve – of elemental iron, but are marketed in a way that implies they can treat iron deficiency.
Sign up: AU Breaking News email
Moses said some low-dose products market themselves as “gentle on the stomach”, when the real reason they don’t cause an upset is that “there’s barely any iron” in them.
“You see powders, liquids, tablets and even expensive sachets of so-called iron-infused water that have little more iron than a bowl of cornflakes or a slice of bread,” she said.
“Women especially might need to take iron because they lose a lot of blood through menstruation or pregnancy. But if [a woman] goes to the shops and picks up a product that says it’s an iron supplement and there’s almost bloody nothing in it, her iron deficiency won’t get any better.”
It is a concern shared by Royal Australian College of Physicians president Prof Jennifer Martin, who echoed Moses’ call for Australia’s drugs regulator, the Therapeutic Goods Administration (TGA), to introduce stronger oversight of supplements and their marketing.
“Many iron supplements are considered ‘food-supplements’ or ‘listed medications’ by the TGA and, as such, there’s much less of a requirement to prove their efficacy compared to prescription-only or ‘registered’ medications,” said Martin, who is a senior physician and a clinical pharmacologist.
“An immediate solution is for doctors to specify exactly which product they want patients to use when prescribing iron, and for patients to clarify with their doctor if they are unsure. But ultimately, there does need to be better regulatory oversight of supplements and the way they are marketed.”
For iron deficiency anaemia, Australian Red Cross Lifeblood recommends 100–200 mg of elemental iron daily. This can be taken in separate doses.
Its website states: “There are more than 100 iron containing preparations available over the counter in Australia but few contain a therapeutic dose for the treatment of iron deficiency anaemia.
“Multivitamin-mineral supplements should be avoided because the elemental iron content is low (frequently 5 mg or less) and they may contain other ingredients that limit absorption.”
after newsletter promotion
Moses, who is also an adjunct associate professor with the University of Queensland’s School of Pharmacy, said several of the low-dose products causing concern were already regulated as medicines.
“It does not make sense for the TGA to permit these products to make claims that they prevent iron deficiency or call themselves iron supplements.”
A spokesperson for the TGA did not directly answer Guardian Australia’s questions about whether it had concerns these products may mislead consumers. The spokesperson said the TGA was “not planning such activity at this time” in terms of minimum therapeutic dose requirements or enhanced oversight of low-dose iron supplements.
In the meantime, Martin said there needed to be greater regulation of pharmacies and more transparency around who was sponsoring products gaining TGA registration.
“We need better ways to ensure people know the differences between treatments backed by evidence and those that aren’t – particularly what information pharmacies should be giving people about this and when people need to speak to their doctor.”
Always see your GP for testing and advice because other medications, absorption issues and underlying conditions all affect how much iron is needed and how it should be taken.
People who are iron deficient usually need between 150mg and 200mg a day of elemental iron. Check the label for “elemental iron” and the amount per dose.
Many iron supplements are considered “food-supplements” or “listed medications” by the TGA with less of a requirement to prove their efficacy.
Look for an AUST R number if you have been diagnosed with iron deficiency or anaemia – these products are fully evaluated by the TGA for safety, quality and efficacy.
And ask your GP for product recommendations.
Solana is currently testing the critical $130 zone amidst increased selling pressure across the crypto market. With Bitcoin approaching $90,000 and the fear index dominating investor sentiment, will this consolidation signal a mere technical retracement or the start of a deeper correction for Solana in 2025?
Solana is going through a delicate consolidation phase, with the price of SOL gradually pulling back toward the $130 zone after failing at its recent highs. This level represents a major technical pivot, while declining volumes reflect growing market indecision.
The current structure forms a horizontal range between $120 and $150, which has channeled price action for several weeks. Buyers are attempting to defend the $130 threshold, but selling pressure remains present. However, bearish momentum appears to be weakening, suggesting a possible stabilization ahead.
On the indicator side, the Stochastic RSI sits in an extreme oversold zone and is beginning to recover, while the MACD shows progressive convergence. These signals suggest a possible technical bounce, but it must be confirmed by a return of volume and the recapture of key resistance levels.
The bullish scenario relies on a recovery above $145–$150, a level whose breakout could open the path toward the $200 target in 2025. This scenario assumes, however, that Bitcoin stabilizes above $90,000 and that risk appetite returns to major altcoins.
The intermediate scenario favors a continuation of the range between $120 and $145 over several weeks. This horizontal consolidation phase would offer opportunities for short-term trading, but would primarily reflect the current absence of a strong directional catalyst.

Solana’s trajectory in 2025 remains intrinsically linked to Bitcoin’s movements. This structural correlation limits SOL’s autonomy in a market where BTC is showing signs of weakness. Institutional investors are adopting a wait-and-see approach, favoring liquidity and reducing their exposure to altcoins as long as uncertainty persists. The evolution of market sentiment and Bitcoin’s behavior will constitute the decisive variables in determining whether Solana can actually target $200 this year or whether a prolonged accumulation phase is needed first.
Related content:
DISCLAIMER
This article is for informational purposes only and should not be considered as investment advice. Some of the partners featured on this site may not be regulated in your country. It is your responsibility to verify the compliance of these services with local regulations before using them.
Important DisclaimersFXEmpire is owned and operated by Empire Media Network LTD., Company Registration Number 514641786, registered at 7 Jabotinsky Road, Ramat Gan 5252007, Israel. The content provided on this website includes general news and publications, our personal analysis and opinions, and materials provided by third parties. This content is intended for educational and research purposes only. It does not constitute, and should not be interpreted as, a recommendation or advice to take any action, including making any investment or purchasing any product. Before making any financial decision, you should conduct your own due diligence, exercise your own discretion, and consult with competent advisors. The content on this website is not personally directed to you, and we do not take into account your individual financial situation or needs. The information contained on this website is not necessarily provided in real time, nor is it guaranteed to be accurate. Prices displayed may be provided by market makers and not by exchanges. Any trading or other financial decision you make is entirely your own responsibility, and you must not rely solely on any information provided through the website. FXEmpire does not provide any warranty regarding the accuracy, completeness, or reliability of any information contained on the website and shall bear no responsibility for any trading losses you may incur as a result of using such information. The website may include advertisements and other promotional content. FXEmpire may receive compensation from third parties in connection with such content. FXEmpire does not endorse, recommend, or assume responsibility for the use of any third-party services or websites. Empire Media Network LTD., its employees, officers, subsidiaries, and affiliates shall not be liable for any loss or damage resulting from your use of the website or reliance on the information provided herein.Risk DisclaimersThis website contains information about cryptocurrencies, contracts for difference (CFDs), and other financial instruments, as well as about brokers, exchanges, and other entities trading in such instruments. Both cryptocurrencies and CFDs are complex instruments and involve a high risk of losing money. You should carefully consider whether you understand how these instruments work and whether you can afford to take the high risk of losing your money. FX Empire encourages you to conduct your own research before making any investment decision and to avoid investing in any financial instrument unless you fully understand how it works and the risks involved.
SummaryGreen tea is healthy, but not for everyone. Its catechins and caffeine can worsen stomach issues, anemia, pregnancy risks, and certain health conditions. A 2024 study also found microplastics in tea bag packaging. Experts suggest safer alternatives like chamomile, hibiscus or lemongrass tea, especially for children, pregnant women and caffeine-sensitive people.
CHICAGO, December 6, 2025 (Newswire.com)
–
NuraSlim Detox Tea Review: Support Digestive Balance and Stress Relief Naturally
Disclaimer: This article is for informational purposes only and does not constitute medical advice. Always consult a qualified healthcare professional before starting any new supplement. NuraSlim is a dietary supplement, not a medication, and is not intended to diagnose, treat, cure, or prevent any disease. If you purchase through affiliate links in this article, a commission may be earned at no additional cost to you.
Learn more: Visit NuraSlim’s official website for complete product information and customer reviews.
The Bloating Problem That Won’t Go Away
You eat a normal meal and within minutes, your stomach feels uncomfortably tight. Buttons become too snug. Clothes feel restrictive. Evening bloating disrupts your confidence and makes you feel self-conscious.
For many people, this post-meal bloating stems from a combination of digestive stress and how their system processes food. Add chronic stress to the mix-which affects gut communication and inflammatory response-and bloating becomes a daily ritual rather than an occasional inconvenience.
The typical solutions? Harsh detox teas that create urgent bathroom situations. Restrictive diets. Expensive supplements. Or simply accepting discomfort as normal.
NuraSlim Detox Tea takes a different approach. Rather than forcing rapid elimination, the brand’s caffeine-free herbal blend works to support your natural digestive rhythm while addressing the stress component that many conventional products overlook.
Over 1,527 verified customers have rated NuraSlim 4.8 stars, with 97% recommending it to friends. But does it actually deliver on those promises? More importantly, how does it fit into a genuine 2026 wellness strategy that prioritizes real results over marketing hype?
What Is NuraSlim Detox Tea?
NuraSlim is a caffeine-free herbal tea formulated to support healthy weight management, digestive balance, and stress relief. The brand positions the product as a gentle alternative to harsh detox teas, using a proprietary blend of 10 premium botanical ingredients rather than laxative-based formulas.
The brand emphasizes three core benefits:
Reduces post-meal bloating – targets digestive discomfort naturally
Supports healthy metabolism – includes herbs traditionally used for metabolic support
Soothes stress-related cravings – addresses the stress-digestion connection
Unlike conventional detox products that rely on aggressive stimulation, NuraSlim is formulated to be non-laxative, meaning it works with your body’s natural processes rather than forcing urgency.
This is ingredient-level research; NuraSlim as a finished product has not been clinically studied as a complete formula.
The Key Ingredients: How They Work Individually
Each ingredient in NuraSlim’s blend has a history of traditional use in herbal medicine. Understanding each herb individually helps you see why the brand selected this combination.
Senna Leaves
Senna is a flowering plant traditionally used in botanical wellness practices for thousands of years. Research has examined senna for its effects on digestive regularity. Studies have investigated senna’s mechanism, which may relate to intestinal fluid secretion and muscle contractions.
The key distinction: Although senna is an herb traditionally used to support bowel movements, NuraSlim includes it as one ingredient among 10, formulated by the brand to be gentle and non-laxative with a focus on comfort rather than urgency. This is one ingredient at specific levels designed for gentle digestive support rather than strong laxative effects.
Individual ingredient research does not mean NuraSlim as a finished product produces the same effects-product testing at the formula level is different from ingredient-level research.
If you’re sensitive to senna or herbal teas, start with shorter steep times (1-2 minutes) and monitor how you feel before using the full 3-5 minute recommendation.
Chamomile Flowers
Chamomile is one of the most widely studied herbal ingredients globally. Research has examined chamomile for its potential to support relaxation and calm minor digestive discomfort. Studies in complementary medicine journals have investigated whether chamomile may help reduce muscle tension in the digestive tract.
The relevance to NuraSlim: stress directly impacts digestion. By including a known calming herb, the brand addresses a root mechanism many detox products ignore-the stress-digestion connection.
Ginger
Ginger contains compounds called gingerols and shogaols, which have been investigated in clinical studies. Research has examined ginger for its potential to support digestive comfort and help maintain healthy inflammatory response in the digestive system.
One often-overlooked benefit: ginger is used traditionally for gentle digestive support without urgency-making it ideal for a non-laxative formula designed for daily use.
Mint (Peppermint)
Peppermint is documented in multiple clinical reviews for its potential to support digestive comfort and ease minor digestive tension. Research has investigated whether menthol (the active compound) may help relax smooth muscles in the digestive tract.
For bloating specifically, peppermint’s traditional use centers on easing post-meal discomfort-directly addressing NuraSlim’s primary benefit claim.
Gynostemma Pentaphyllum (Southern Ginseng)
This is NuraSlim’s most unique ingredient. Gynostemma pentaphyllum is an adaptogenic herb traditionally used in Asian wellness practices for stress management and overall vitality. Adaptogenic herbs are defined as compounds that may help the body manage stress response.
This ingredient explains NuraSlim’s differentiation. Most detox teas focus only on digestive acceleration. NuraSlim specifically targets the stress component, recognizing that chronic stress directly impairs digestion and increases cortisol, which affects weight management.
Research has examined gynostemma for its potential role in natural stress response, making it particularly relevant for people whose bloating worsens during stressful periods.
Product Composition & Manufacturing
According to NuraSlim’s official website, the brand emphasizes:
100% natural ingredients – no synthetic additives
Third-party lab tested – each batch undergoes purity testing for contaminants and heavy metals
Caffeine-free – can be enjoyed any time of day without sleep disruption
Non-laxative formula – designed for gentle daily use without urgent bathroom effects
Proprietary herbal blend – 10 premium herbs in strategic combination
These are individual ingredient components; NuraSlim as a finished product has not been clinically studied as a complete formula. The individual research on senna, chamomile, ginger, mint, and gynostemma does not equal product-level evidence that NuraSlim produces those effects.
How to Use NuraSlim: Timing & Consistency
The brand recommends a simple ritual:
Steep one tea bag in 8 oz of hot water for 3-5 minutes
Remove the bag and enjoy warm
Drink after meals to support post-meal digestion, or in the evening for relaxation and stress relief
Use consistently for best results – NuraSlim is designed by the brand for daily use as part of a wellness routine. Talk with your healthcare provider about whether long-term use is appropriate for you.
The caffeine-free formula means you can enjoy NuraSlim morning, afternoon, or evening without affecting sleep quality.
Important note: This is not a replacement for prescribed medical treatment. If you’re currently taking medications, consult your physician before beginning any new herbal supplement. Do not change, adjust, or discontinue any medications without medical guidance, even if you believe you’re experiencing health improvements.
Customer Results: Individual Experiences, Not Typical Outcomes
NuraSlim has accumulated 1,527+ verified customer reviews with a 4.8-star average rating. Here’s what people are reporting:
Common themes from reviews:
Reduced bloating after meals (noticeable within 20-30 minutes for some users)
Better sleep quality when used in the evening
Improved digestive comfort and reduced stomach tension
Stress relief and sense of calm
Natural taste without medicinal flavor
Improved digestion consistency with regular use
These are individual experiences and should not be interpreted as clinical evidence or typical results. People who write reviews are self-selected-satisfied customers are more likely to spend time posting feedback than those with neutral or negative experiences. Individual results will vary based on factors including age, baseline digestive health, stress levels, lifestyle, consistency of use, genetic factors, current medications, dietary habits, and other individual variables.
Results May Vary. Not all users experience the same benefits, and not all experience them on the same timeline.
NuraSlim vs. Other Detox Teas: Key Differences
According to the brand’s comparison, NuraSlim differs from conventional detox teas in several ways:
|
Feature |
NuraSlim |
Typical Detox Teas |
|---|---|---|
|
Herb Count |
10 premium herbs |
3-5 basic herbs |
|
Caffeine |
Caffeine-free |
Often contains caffeine |
|
Mechanism |
Gentle digestive support + stress relief |
Laxative-based acceleration |
|
Side Effects |
Generally well-tolerated |
May cause urgency/cramping |
|
Daily Use |
Designed for long-term use |
Typically recommended short-term |
|
Stress Component |
Includes adaptogenic herbs |
Focuses only on elimination |
Comparative claim note: This comparison is based on the brand’s own positioning and typical market products. The claim that NuraSlim includes more herbs is supported by the brand’s ingredient list. However, increased ingredient count does not automatically equal superior efficacy-individual ingredient quality and formula balance matter more than quantity.
Is NuraSlim Right for You?
NuraSlim may be a good fit if you:
Experience post-meal bloating and want gentle support
Feel stressed and notice it affects your digestion
Want a caffeine-free herbal option for evening use
Prefer natural ingredients without artificial additives
Have a sensitive stomach and want non-laxative support
Are looking for long-term digestive wellness, not quick fixes
NuraSlim may not be ideal if you:
Need immediate, urgent digestive acceleration
Have specific senna allergies or sensitivities
Are pregnant or nursing (consult your doctor first)
Are taking medications that may interact with herbal supplements
Are looking for a weight loss “solution” rather than support
Critical consideration: NuraSlim supports digestive health and may help with bloating, but it is not a weight loss medication and should not be positioned as a substitute for balanced nutrition and exercise. Some customers report feeling lighter after using the product consistently-this likely relates to reduced bloating and improved digestive comfort, not fat loss.
Consult your physician before beginning NuraSlim if you are currently taking medications, have existing health conditions, are pregnant or nursing, or are considering major changes to your health regimen. Do not change, adjust, or discontinue any medications without your physician’s guidance.
The 30-Day Money-Back Guarantee
According to the official NuraSlim website, orders are protected by a satisfaction guarantee. If you’re unhappy with your results within 30 days of delivery, you can contact customer support for a full refund.
Important distinction: This is a satisfaction-based guarantee, not an outcomes-based guarantee. The brand is not guaranteeing that your bloating will disappear or that you’ll lose weight. They’re guaranteeing that if you’re unhappy with the product, you can get your money back.
Results are not guaranteed. Individual experiences vary based on personal factors. Some people report noticeable changes; others may not experience significant shifts. This depends entirely on your baseline digestive health, stress levels, consistency of use, and individual physiology.
Review the official refund terms, timeframes, and conditions on the checkout page or by contacting NuraSlim’s customer service, as guarantee details are subject to the company’s current terms and conditions.
Pricing & Availability for 2026
NuraSlim is currently available with promotional pricing (up to 75% discount on select packages). The brand frequently runs limited-time offers, so pricing may vary.
Current availability:
Ships to the US, Canada, UK, New Zealand, and many European countries
Estimated delivery time is generally 5-20 days, depending on location, customs, and local carriers
30-day money-back guarantee
Third-party tested batches
In stock and ready to ship
Always confirm current shipping options and delivery estimates on the official NuraSlim website before purchase.
All prices, discounts, and promotional offers mentioned were accurate at the time of publication (December 2025) but are subject to change without notice. Always verify current pricing and terms on the official product website before making your purchase.
How NuraSlim Fits Into Your 2026 Wellness Strategy
As you head into 2026, digestive wellness deserves to be a foundation of your health approach. Here’s why:
The stress-digestion connection is finally getting mainstream recognition. Chronic stress literally impairs your digestive function by triggering inflammatory response and disrupting gut bacteria balance. Most wellness products ignore this entirely.
NuraSlim’s inclusion of adaptogenic herbs (specifically gynostemma pentaphyllum) acknowledges this connection. Rather than forcing digestion through harsh stimulation, the product attempts to address both digestive discomfort AND the stress component that creates it.
For 2026, consider NuraSlim as part of a holistic digestive wellness approach:
Stress management (meditation, exercise, sleep)
Dietary consistency (whole foods, adequate fiber, hydration)
Herbal support (NuraSlim for post-meal comfort and stress relief)
Professional guidance (consult your doctor about persistent digestive issues)
NuraSlim alone won’t solve chronic digestive problems. But as part of an integrated approach, it may help support natural digestive rhythm while addressing the stress component most products miss.
Frequently Asked Questions About NuraSlim
What exactly does NuraSlim help with?
NuraSlim is designed to support three primary areas: healthy weight management (through metabolic support), digestive balance (specifically post-meal bloating and digestive comfort), and stress relief. Many users report better sleep when using it in the evening, partly due to its calming herbal ingredients.
This is not a weight loss product. It supports healthy metabolism and may help with bloating-related discomfort, but it is not a substitute for diet and exercise.
Will NuraSlim cause bathroom urgency or cramping?
No. Unlike harsh detox teas that rely on laxative mechanisms, NuraSlim is specifically formulated to be non-laxative. It works with your body’s natural digestive processes rather than forcing urgency. Some customers report gentle, regular digestion; others notice mainly bloating reduction without urgent effects.
However, individual responses vary. If you have extreme sensitivity to senna or herbal blends, start with a smaller amount and observe how your body responds.
How long should I use NuraSlim?
You can use NuraSlim daily as part of your ongoing wellness routine, according to the brand’s guidance. The brand designs it for long-term use without creating dependency. Some customers use it every day; others use it as-needed for bloating or evening relaxation. Both approaches are fine.
People with health conditions or those taking medications should confirm long-term use with their physician.
Can I drink this if I have a sensitive stomach?
Yes. According to the brand, the gentle botanical blend is specifically chosen for sensitive digestive systems. If you’re extremely sensitive, start with a smaller amount or shorter steep time (1-2 minutes instead of 3-5) to assess tolerance.
Always consult your doctor first if you have serious digestive conditions.
How is NuraSlim different from other detox teas I’ve tried?
Most detox teas use 3-5 ingredients and rely heavily on laxative herbs for quick results. NuraSlim uses 10 premium herbs, including adaptogenic plants not commonly found in detox formulas. The stress-relief component (through gynostemma pentaphyllum) sets it apart-the brand recognizes that stress drives digestive problems and bloating.
What’s the best time to drink NuraSlim?
Anytime that fits your schedule. Unlike caffeinated teas, NuraSlim won’t disrupt sleep, so you can enjoy it morning, noon, or evening. Many customers drink it after meals to support post-meal comfort, or in the evening for relaxation and better sleep quality.
Does NuraSlim contain caffeine?
No. NuraSlim is completely caffeine-free, making it perfect for evening use without interfering with sleep. This also makes it suitable for people sensitive to caffeine or those looking to reduce stimulant intake.
Why NuraSlim Matters in the Current Wellness Landscape
The supplement industry is flooded with products making aggressive claims: “lose 10 pounds,” “flush toxins,” “cure digestion overnight.”
NuraSlim takes the opposite approach. The brand makes modest, supportable claims. The product is designed for gentle, sustained support rather than dramatic results. Customer testimonials reflect this-people report feeling better, sleeping better, experiencing less bloating-not miraculous transformations.
This measured approach is actually more credible and more likely to produce real results because:
Realistic expectations = higher satisfaction
Gentle support = sustainable long-term use
Stress-relief component = addresses root mechanism, not just symptoms
Non-laxative formula = prevents the rebound bloating common with harsh detox products
For 2026 wellness, this philosophy-doing one thing well rather than overpromising everything-is increasingly what separates legitimate products from marketing hype.
Final Recommendation: Should You Try NuraSlim?
If you experience regular post-meal bloating or stress-related digestive discomfort, NuraSlim is worth testing. The product is affordable, backed by strong customer reviews, and comes with a 30-day satisfaction guarantee-meaning you can try it with minimal financial risk.
If you’re looking for a quick weight loss solution, NuraSlim will disappoint you. It’s designed for digestive comfort and stress support, not weight loss. Any weight-related benefits would come from reduced bloating and improved digestion consistency, not from the product itself.
The honest assessment: NuraSlim is a well-formulated, modestly positioned herbal tea that aims to support digestive comfort and stress management. Many reviewers report feeling less bloated and more relaxed, but results vary from person to person. It won’t revolutionize your health, but it may meaningfully improve daily digestive comfort-which is exactly what thousands of customers report.
Where to Get NuraSlim
Official Website:Visit NuraSlim.com for complete product information, ingredient details, and customer reviews.
Order NuraSlim: Get your NuraSlim detox tea here – current pricing available with promotional discounts.
Both links provide full access to the brand’s terms, refund policy, and customer support contact information.
Phone: +1 (231) 359-2230
Email: support@nuraslim.com
Complete Compliance & Health Disclaimers
Medical Disclaimer: This article is educational and does not constitute medical advice. NuraSlim is not a substitute for prescribed medical treatment. If you are currently taking medications, have existing health conditions, are pregnant or nursing, or considering major changes to your health regimen, consult a qualified healthcare professional before starting NuraSlim or any new supplement. Do not change, adjust, or discontinue medications without your physician’s guidance and approval, even if you believe you are experiencing health improvements.
FDA Health Disclaimer: The statements made in this article and regarding NuraSlim have not been evaluated by the Food and Drug Administration. NuraSlim is not intended to diagnose, treat, cure, or prevent any disease. This product is a dietary supplement, not a medication.
Results May Vary Disclaimer: Individual results will vary based on factors including age, baseline digestive health, stress levels, lifestyle, consistency of use, genetic factors, current medications, dietary habits, exercise patterns, and other individual variables. While some customers report improvements, results are not guaranteed. Not all users experience the same benefits or on the same timeline. These are individual experiences and should not be interpreted as clinical evidence or typical results.
FTC Affiliate Disclosure: This article contains affiliate links. If you purchase through these links, a commission may be earned at no additional cost to you. This compensation does not influence the accuracy, neutrality, or integrity of the information presented. All opinions and descriptions are based on published research, publicly available information, and customer feedback.
Pricing & Terms Disclaimer: All prices, discounts, and promotional offers mentioned were accurate at the time of publication (December 2025) but are subject to change without notice. Always verify current pricing, terms, and refund policies on the official NuraSlim website before making your purchase. Shipping times may vary based on location and customs processing.
Publisher Responsibility Disclaimer: The publisher of this article has made every effort to ensure accuracy at the time of publication. We do not accept responsibility for errors, omissions, or outcomes resulting from the use of information provided. Readers are encouraged to verify all details directly with the official NuraSlim source and their healthcare provider before making decisions.
Testimonial Authenticity Note: Customer testimonials and reviews displayed reflect individual experiences. These are self-selected reports from people willing to share their stories-satisfied customers are statistically more likely to post reviews than those with neutral or negative experiences. Testimonials do not represent clinical evidence or guaranteed results.
Source: NuraSlim
City Holder, a rising blockchain-based city-building strategy game, continues to gain traction as it introduces a new round of Daily Combo and Daily Quiz rewards for December 07, 2025. The project, which blends casual gaming with crypto-driven mechanics, is steadily positioning itself as one of the most engaging Play-to-Earn ecosystems in the current Web3 landscape. While many blockchain games rely heavily on reward speculation, City Holder emphasizes development, strategy, and city management as core gameplay pillars. Players are not only encouraged to build and expand their digital metropolis but also to make key decisions that shape its economy, logistics, and overall growth.
For a new generation entering decentralized gaming, City Holder offers something refreshingly accessible. It combines classic city simulation elements with real token incentives, allowing users to earn coins, unlock boosters, and accelerate upgrades through routine missions and quizzes. The system is designed to reward both new and long-term players, making it suitable for casual gamers, strategic thinkers, and crypto enthusiasts exploring reward-based digital economies.
For additional awards, check the Hamster Kombat Daily Cipher 05 December 2025 Earn 10 coins and find out more thrilling tasks!
The spotlight for December 07, 2025 shines on the City Holder Daily Combo and Daily Quiz, which, according to the official release, may offer rewards of up to 7.5 million in-game coins when players successfully input specific card combinations. Although the exact combination for the date is still pending an official reveal and marked as “coming soon,” the anticipation within player communities remains high. Historically, Daily Combos have played a crucial role in boosting city progress, enabling rapid development that would otherwise require extended time or resource accumulation. The expectation is that this edition will follow the same rewarding trend.
Players can easily access the Daily Combo feature from within the game interface. Once logged in, users navigate to the “Your Cities” section where the “Combo” icon sits prominently. Selecting this option brings up a card selection menu from the top bar. The mechanics are straightforward: players must submit the correct card sequence, and once validated, the system releases bonus coins directly into their account.
Those who successfully clear the Combo challenge can earn up to 7.5 million coins instantly, which creates a substantial economic advantage in the early city-building stages. With additional coins, city expansion accelerates, building upgrades become more achievable, and new infrastructure options unlock. As developers continue to push new tools and modules into the ecosystem, early adopters stand to benefit the most from these recurring reward events.
The Daily Quiz functions similarly, offering players trivia-style questions related to game mechanics, city strategy, blockchain knowledge, or ecosystem development. When answered correctly, additional rewards are distributed, further enhancing player engagement. The quiz model not only incentivizes consistent login activity but also educates players on the broader City Holder roadmap, token utilities, and upcoming feature rollouts.
What makes City Holder stand out in an increasingly saturated Play-to-Earn market is the layered integration of economic simulation within a decentralized reward structure. Unlike purely click-to-earn titles or systems reliant only on staking and passive income, City Holder anchors its ecosystem in interactive gameplay. Players must think tactically, balancing public infrastructure, utilities, and economic distribution to maintain city growth. This encourages strategic habits rather than repetitive grinding.
To succeed, players must consider multiple development factors including zoning, transportation, industrial distribution, resource management, and population satisfaction. These elements mirror real-world urban management challenges. The more efficient the planning, the faster a city thrives. The result is a model where fun and profitability coexist, appealing to gamers who prefer skill over luck and progress over inflationary token drops.
Upon entering the home interface, players are greeted with a bold entry-point button labeled “Aircraft”. This feature highlights an upcoming token series integrated into the aviation expansion mechanic. Developers have stated that new users within the activation period may automatically receive bonus rewards, giving them an early economic edge even without prior token knowledge. This onboarding structure reflects a user-first philosophy, intended to reduce complexity and ease learning curves common in blockchain gaming.
Beyond the initial reward structure, developers have also teased new token utilities tied to the Aircraft Land expansion module. Based on statements from internal sources, new tokens could influence long-haul logistics, aerial trade routes, or transport upgrades. While specific integration details have not yet been publicly expanded, early leaks suggest the implementation of collectibles, NFT-based resource hubs, and cross-zone economic markets within future updates.
A roadmap preview delivered by the development team showcases an underground control center theme. This visual metaphor represents long-term strategy sessions dealing with exchange negotiations, market maker partnerships, and ecosystem scaling. The underground model hints at deeper structural projects underway, signaling broader ambition beyond casual gaming layers. If executed correctly, City Holder could establish a hybrid identity bridging DeFi, gaming, and simulation economies in one ecosystem.
Web3 gaming has entered a maturity phase. After early hype cycles and temporary boom-and-bust trends, the sector is stabilizing toward utility-based systems driven by sustainable tokenomics. Many developers now emphasize economic longevity, user retention, and balanced resource emissions. City Holder emerges in this period as a project leveraging sustainable reward logic. Its economy rewards effort without sacrificing accessibility.
While some Play-to-Earn platforms have struggled to maintain value, City Holder attempts to avoid burnout through dynamic resource allocation, rotation events, and knowledge-based quiz systems. By merging player decisions with growth outcomes, progress becomes meaningful and directly aligned with gameplay intensity. This creates natural demand for resources without artificially inflating supply.
Moreover, with more investors entering gaming tokens and metaverse assets, games with active user bases stand to gain increased liquidity and long-term trust. Should City Holder continue building user engagement while expanding its economic model, it could secure notable standing within the mid-to-large Web3 gaming market in 2026.
With the December 07, 2025 Daily Combo still pending official release, the community remains on standby. Speculation threads suggest combinations may involve resource, construction, and booster cards, though no verified source has confirmed this. Players are encouraged to monitor announcements across community channels and game notifications.
In the meantime, consistent participation remains the most reliable method to accumulate progress and maximize future rewards. Early adopters familiarized with the interface, Combo rituals, and quiz cycles often earn significantly more than occasional players. As reward pools strengthen and token utilities expand, daily logins could become increasingly valuable. City Holder’s development direction implies more integrations, feature expansions, marketplace enhancements, and possibly cross-chain compatibility in the future.
City Holder’s Daily Combo and Daily Quiz for December 07, 2025 mark another exciting milestone for players ready to earn rewards while developing their dream city. With up to 7.5 million coins on the line, combined with an evolving token ecosystem and strategic gameplay design, the title continues gaining attention in Play-to-Earn circuits. Whether you’re a newcomer building your first blueprint or a veteran optimizing trade networks, opportunities to progress are abundant.
As Play-to-Earn ecosystems refine their long-term approach, titles like City Holder that prioritize participation, education, and reward synergy may represent the next stage of Web3 gaming growth. December’s reward event arrives not only as an earning opportunity but also as a preview into a maturing virtual economy driven by players, not speculation.
For more updates, full Combo release details, and upcoming game features, visit hokanews for continuous coverage and future news.
hokanews.com – Not Just Crypto News. It’s Crypto Culture.
Writer
@Erlin
Erlin is an experienced crypto writer who loves to explore the intersection of blockchain technology and financial markets. She regularly provides insights into the latest trends and innovations in the digital currency space.
Check out other news and articles on Google News
Technically, gold held the level it needed to. The settlement at $4,198.68 is comfortably above the $4,133.95 pivot — the 50% retracement of $3,886.46 to $4,264.70. Staying above that zone keeps buyers in control and keeps a retest of $4,264.70 in play. A breakout through the weekly high would open the door to $4,381.44, the record high.
If sellers push through $4,133.95, the first real support sits at $4,075.58. A deeper pullback would target $3,886.46 — the main bottom that halted October’s slide and matches the top of the $3,846.50–$3,720.25 intermediate retracement zone. That zone remains the best long-term value area, though reaching it would require the narrative to shift materially.
Next week’s FOMC meeting is the entire focus. The committee is split, and Powell has avoided committing to a move. Doves like Williams and Waller argue for more easing; hawks like Collins want to hold steady. Desks expect at least two dissents — rare, and a reminder that the policy debate is far from settled.
XRP price today shows the token holding slightly above the $2 level, supported by a resilient long-term trend structure and renewed regulatory momentum that continues to influence overall market sentiment.
XRP is currently trading near $2.03 amid steady liquidity conditions, even as the broader crypto market experiences mixed volatility. Aggregated market data from major exchanges indicates strong 24-hour activity, with analysts pointing to the monthly Supertrend indicator as a key factor in maintaining bullish structure. Meanwhile, the CFTC’s progressing review of a spot XRP contract is adding further attention from institutional and retail participants tracking the latest Ripple XRP news.
XRP is trading around $2.03, down 2.73% over the past 24 hours, based on aggregated price data from leading exchanges. Despite the slight decline, 24-hour trading volume remains above $3 billion, reflecting continued market engagement across the XRP crypto ecosystem.
XRP was trading at around 2.03, down 2.73% in the last 24 hours at press time. Source: XRP price via Brave New Coin
The asset remains above the $2 psychological threshold, a level closely watched by traders tracking the XRP price chart, liquidity shifts, and short-term momentum. Market participants note that staying above this zone helps preserve a broader upward structure, even as intraday swings persist across the digital asset market.
The longer-term outlook for XRP remains stable, supported by the monthly Supertrend indicator—a volatility-based tool used to identify directional trends over extended periods. Independent technical analyst ChartNerd (@ChartNerdTA) commented on X that “XRP’s monthly Supertrend remains bullish. Being above the green Supertrend line indicates a strong, long-term bullish trend.”

XRP’s monthly Supertrend remains bullish, with the price above the green line, signaling continued long-term upward momentum and no immediate bearish trends. Source: @ChartNerdTA via X
The current Supertrend support sits above the $1.30 region, which previously acted as a structural divider between bullish and bearish phases during the 2018 and 2022 market downturns. XRP has maintained its position above major trend markers since early 2024, and analysts note no immediate signs of a reversal based on current readings.
However, market experts emphasize that indicators reflect historical behavior—not guarantees. Broader macro conditions, liquidity trends across the XRP Ledger, and sector-wide risk sentiment will continue to influence future price direction. Community discussions referencing long-term targets or potential ETF developments remain speculative and should be viewed as opinion, not predictive certainty.
A notable development this week came from the Commodity Futures Trading Commission (CFTC), which is reviewing Bitnomial’s publicly filed self-certification to list an XRP-USD spot contract—the first digital asset proposed for the regulator’s newly developed trading platform.
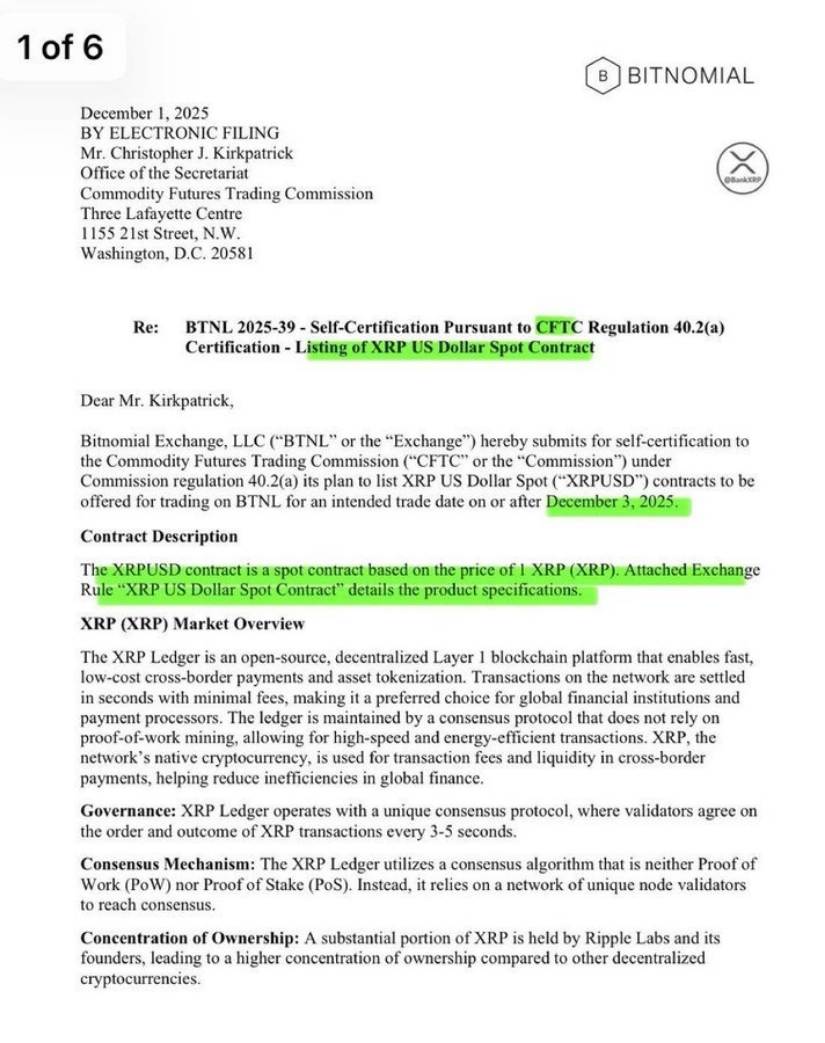
CFTC’s new crypto platform will debut with Bitnomial’s SPOT XRP contract, marking XRP as the first-ever digital asset featured on the exchange. Source: @Crypt0Senseii via X
Crypto market commentator CryptoSensei (@Crypt0Senseii) described the announcement as significant for market structure, noting its potential impact on regulated access: “The CFTC is set to feature Bitnomial’s spot XRP contract as the first digital asset on its brand-new crypto trading platform.”
The filing, submitted on December 1, 2025, outlines the proposed contract, including technical details of the XRP Ledger, its consensus mechanism, and governance model. The certification aligns with Bitnomial’s expected launch of a regulated retail spot crypto venue scheduled for the week of December 8, 2025, pending applicable reviews.
Analysts note that while the development marks a step toward greater regulatory clarity, timelines and outcomes may still evolve as the CFTC continues its review process.
According to an independent TradingView analyst, readCrypto, several price zones may guide XRP’s next directional phase. The analyst suggests the uptrend could strengthen if XRP sustains momentum above the $2.48–$2.60 resistance area—a zone viewed as a potential breakout region rather than a predetermined target.
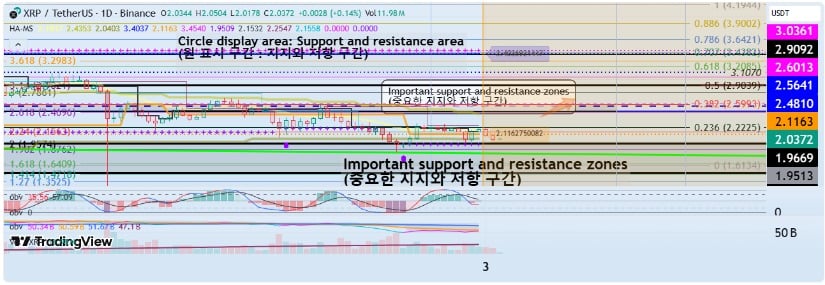
XRP’s bullish outlook strengthens as the price targets a breakout above $2.48–$2.60, while support at $1.82–$1.95 underpins the broader uptrend. Source: readCrypto on TradingView
On the downside, the $1.82–$1.95 range is identified as a key support zone aligned with monthly StochRSI readings, which help assess momentum extremes over longer timeframes. A deeper decline into the $1.50–$1.96 region may introduce the risk of a broader bearish shift, though this scenario depends heavily on overall market conditions, liquidity movements, and macroeconomic factors.
Analysts emphasize that support and resistance levels provide scenarios, not predictions, and should be interpreted within the wider context of market volatility and evolving regulatory developments.
XRP continues to trade steadily above the $2 level, supported by a stable long-term Supertrend reading and increased attention following Bitnomial’s self-certification filing with the CFTC for an XRP spot contract. While short-term volatility is expected across the crypto market, XRP’s strong liquidity profile, transparent ledger structure, and expanding institutional focus continue to shape its position within the digital asset landscape.
As traders watch how XRP interacts with the $2.10 region and broader resistance levels, market conditions—not individual indicators—will determine whether momentum can sustain. With regulatory developments progressing and interest in the XRP Ledger ecosystem growing, the XRP price outlook remains a central narrative within ongoing XRP news today, supported by both technical observations and evolving market structure.


 Price Forecast: Markets Brace for Volatility as FOMC Looms")