The main tag of Forex News Today Articles.
You can use the search box below to find what you need.
[wd_asp id=1]

19 04, 2026

USD/JPY Price Forecast: Soars to Mid-159.00s Yet Remains Trapped in Familiar Range

By |2026-04-19T01:59:11+02:00April 19, 2026|Forex News, News|0 Comments

BitcoinWorld

USD/JPY Price Forecast: Soars to Mid-159.00s Yet Remains Trapped in Familiar Range

The USD/JPY currency pair has climbed decisively to the mid-159.00s, marking a significant level for forex traders globally. However, this ascent occurs within a well-defined and familiar trading range that has characterized the pair’s movement for weeks. Market participants now closely monitor whether this represents a genuine breakout or merely another test of established resistance. Consequently, understanding the technical landscape and fundamental drivers becomes paramount for any informed trading decision.

USD/JPY Forecast: Technical Analysis of the Current Range

The recent climb to the mid-159.00s places the USD/JPY pair near the upper boundary of its recent consolidation zone. Technical analysts identify several key levels that define this range. Firstly, support appears firm around the 157.50 level, where buying interest has consistently emerged. Secondly, resistance has proven formidable in the 159.50 to 160.00 band, a zone that has repeatedly capped rallies. The pair’s behavior within this corridor suggests a market in equilibrium, awaiting a fresh catalyst.

Furthermore, moving averages provide additional context. The 50-day and 200-day simple moving averages currently slope upward, indicating a broader bullish trend. However, the price action’s failure to sustain breaks above 160.00 highlights underlying caution. Chart patterns, including recent doji candlesticks near the highs, signal indecision among traders. This technical setup implies that while the trend favors the US dollar, immediate upside may be limited without a fundamental shift.

Fundamental Drivers Behind the Yen’s Movement

The confinement of the USD/JPY pair within its range stems directly from competing fundamental forces. On one side, the interest rate differential between the US Federal Reserve and the Bank of Japan (BoJ) remains the dominant macro theme. The Fed’s “higher for longer” stance on rates continues to underpin dollar strength. Conversely, the BoJ’s ultra-accommodative policy, despite a historic shift away from negative rates, maintains a wide yield gap that pressures the yen.

Meanwhile, other economic indicators create crosscurrents. Robust US employment data supports the dollar’s yield appeal. In contrast, periodic interventions by Japanese authorities to support the yen inject volatility and establish psychological barriers near the 160.00 level. Additionally, global risk sentiment influences the pair; a risk-off environment often triggers yen buying as a traditional safe-haven asset. These conflicting forces create the push-and-pull dynamic evident in the price chart.

Expert Analysis: The Intervention Watch

Market strategists consistently highlight the 160.00 level as a critical line in the sand for Japanese policymakers. Historical data shows that verbal and actual intervention has intensified as the pair approaches this threshold. Financial institutions like Nomura and Goldman Sachs publish regular notes analyzing the Ministry of Finance’s (MoF) likely tolerance levels. Their consensus suggests that while the mid-159.00s are acceptable, a sustained break above 160.00 would dramatically increase the probability of direct market action by Japan. This overhang effectively caps bullish momentum and reinforces the range-bound trading pattern.

Comparative Performance Against Other Major Pairs

The USD/JPY’s range-bound behavior contrasts with movements in other major currency pairs. The following table illustrates this divergence over a recent one-month period:

Currency Pair Price Change Market Characterization
USD/JPY +1.2% Range-Bound, Consolidation
EUR/USD -2.1% Trending, Bearish
GBP/USD -1.8% Trending, Bearish
AUD/USD -3.0% Trending, Bearish

This comparison reveals a key insight: the US dollar’s broad strength is unambiguous, but the Japanese yen has shown relative resilience compared to European and commodity-linked currencies. This resilience is not due to yen strength but rather to the specific containment policy focused on the USD/JPY exchange rate. The pair’s performance is therefore an outlier, dictated by unique political and interventionist factors not present in other forex markets.

Market Impact and Trader Positioning

The persistent range in USD/JPY has tangible effects on market participants. For institutional hedgers, the stability provides a clearer environment for planning international transactions. However, for speculative traders, the low volatility within the range compresses potential profits, pushing strategies toward selling options or betting on a breakout. Commitments of Traders (COT) reports from the CFTC show that leveraged funds maintain a sizable net-long position in USD/JPY futures, reflecting the prevailing bullish bias, but the growth of this position has stalled alongside the price consolidation.

Moreover, the range influences global capital flows. Japan’s significant holdings of foreign assets, particularly US Treasuries, become more sensitive to exchange rate stability. A stable or predictably weak yen supports the outward investment strategy of Japanese institutions. Conversely, a sudden, intervention-driven yen spike could trigger rapid, destabilizing capital repatriation. This systemic importance ensures that global macro funds monitor the 159.00-160.00 zone with intense scrutiny.

Conclusion

The USD/JPY price forecast remains tightly linked to its ongoing battle between bullish interest rate dynamics and bearish intervention risks. The climb to the mid-159.00s demonstrates underlying dollar strength, yet the pair’s confinement within a familiar range underscores the powerful influence of Japanese monetary authorities. Traders should prepare for continued volatility around key technical levels, with a sustained break above 160.00 likely requiring a fundamental change in policy stance from either the Fed or the BoJ. Until then, the familiar range prevails.

FAQs

Q1: What does it mean that USD/JPY is “confined in a familiar range”?
It means the currency pair’s price is oscillating between a consistent high (resistance) and low (support) level, unable to break out in either direction for a sustained period. This indicates a balance between buying and selling forces.

Q2: Why is the 160.00 level so important for USD/JPY?
The 160.00 level is viewed as a critical psychological and technical threshold. Japanese authorities have historically intervened in the forex market to support the yen when USD/JPY approaches or breaches this level, making it a key line for traders to watch.

Q3: What are the main fundamental factors driving the USD/JPY exchange rate?
The primary driver is the wide interest rate differential between the US (high rates) and Japan (very low rates). Secondary factors include the Bank of Japan’s policy trajectory, US economic data, global risk sentiment, and the threat of currency intervention by Japan.

Q4: How does a range-bound market affect trading strategies?
A range-bound market favors strategies like selling options (to collect premium from low volatility) or range-trading (buying near support, selling near resistance). It is less favorable for trend-following strategies that require sustained directional movement.

Q5: What would likely cause a definitive breakout from the current USD/JPY range?
A breakout would likely require a major shift in fundamentals, such as the Federal Reserve signaling aggressive rate cuts, the Bank of Japan committing to a rapid tightening cycle, or Japanese authorities explicitly abandoning their intervention stance—none of which are currently the base case.

This post USD/JPY Price Forecast: Soars to Mid-159.00s Yet Remains Trapped in Familiar Range first appeared on BitcoinWorld.


Source link

18 04, 2026

Goldman Pound To Dollar Forecast: Sell GBP/USD, 3-Month Target Is 1.33

By |2026-04-18T17:57:00+02:00April 18, 2026|Forex News, News|0 Comments

The Pound to Dollar (GBP/USD) exchange rate found support below 1.32 in early April and has rallied strongly to above 1.35, recouping Iran-related losses as the dollar has lost ground. Risk appetite has also recovered which has helped underpin the Pound.

Over the last few months, Goldman Sachs has recommended selling GBP/EUR to take advantage of expectations of Pound vulnerability due to UK economic and political risks.

The bank still considers that the Pound is vulnerable, but has changed its stance and now considers that Pound vulnerability is best expressed through selling GBP/USD. The bank has a 3-month GBP/USD target of 1.33.

Goldman maintains a cautious stance towards Sterling on political and economic grounds. The bank notes political risks surrounding the May local elections, especially with opinion polls still indicating that the Labour Party will suffer sharp losses, increasing the risk of a challenge to Prime MInister Starmer once the Iran conflict ends.

The bank also notes that the UK economy will be vulnerable to the energy shock and there is also a risk that markets are being complacent over the domestic and global economic risks, increasing the Pound risk profile.

foreign exchange rates

Source link

18 04, 2026

Danske Bank Euro To Dollar Forecast: EUR/USD To Rise To 1.22 In Next 12 Months

By |2026-04-18T13:56:02+02:00April 18, 2026|Forex News, News|0 Comments

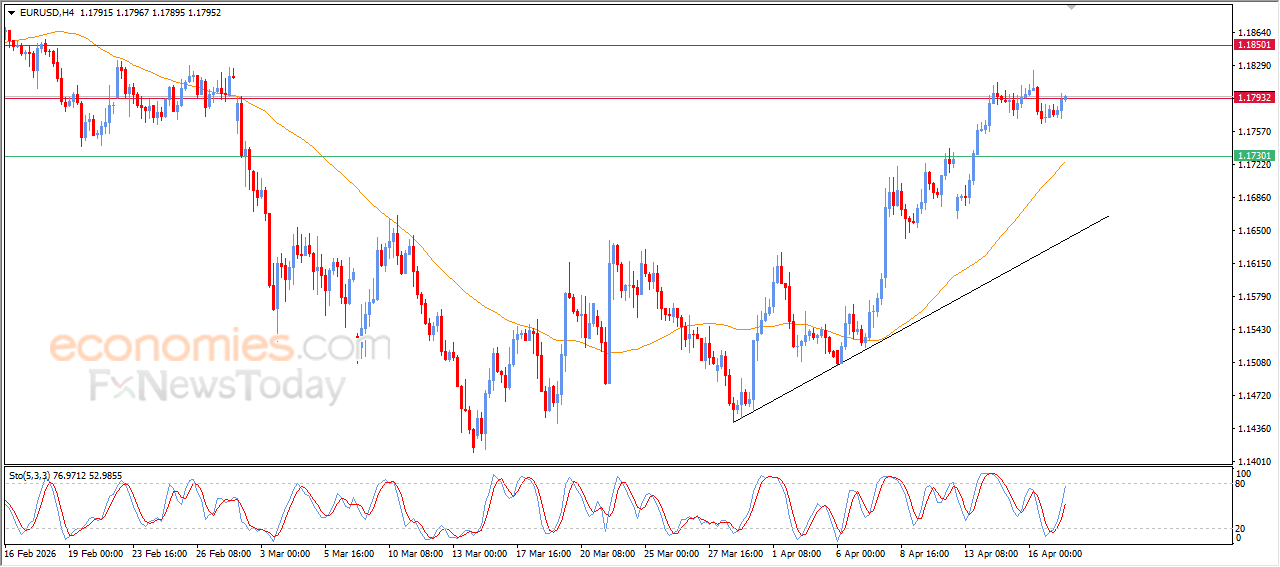
The Euro to Dollar (EUR/USD) exchange rate has rallied to highs around 1.18 as hopes for a resolution in the US-Iran conflict have undermined near-term dollar demand.

Danske Bank notes a high degree of uncertainty in the short term, but it has shifted its bias and is no longer backing significant short-term EUR/USD losses. The bank is also backing 12-month EUR/USD gains to 1.22 as the dollar retreats further.

It does, however, note that any escalation in the Middle East conflict would trigger renewed dollar demand with the threat of high volatility.

Danske expects monetary policy will be a key medium-term feature for FX markets. After no change in the short term, Danske is backing two Federal Reserve rate cuts by the end of 2026. In contrast, the ECB is expecting rate hikes in June and July which will erode the dollar’s yield support.

It also expects that US inflation will be higher which will undermine real dollar rates while a retreat in energy prices would help underpin the Euro. Danske also considers that fair value for EUR/USD is around 1.25 which means a net tailwind for the Euro.

EUR/USD — Key Rate Highlights:

Current Rate: 1.177250 (17 Apr 2026, 22:29 UTC)

Daily Move: -0.07% (-0.000824)

foreign exchange rates

Latest Close: 1.177250 (17 Apr)

April Range: 1.150650 – 1.184920

April Performance: +1.72%

12-Month Range: 1.106540 – 1.207544

Recent Trend: EUR/USD holding firm near recent highs after a strong April rally, with slight consolidation in latest sessions


Disclaimer: For information only, not investment advice. This EUR to USD forecast summarises and interprets third-party research; views expressed are those of the original source and may not fully reflect the source’s complete analysis. Neither the source nor we accept liability for reliance on this interpretation.

Source link

18 04, 2026

EUR/GBP Forecast: Critical Upside Bias Emerges Amid UK Economic Uncertainty

By |2026-04-18T09:55:03+02:00April 18, 2026|Forex News, News|0 Comments


EUR/GBP Forecast: Critical Upside Bias Emerges Amid UK Economic Uncertainty


Skip to content


Source link

18 04, 2026

GBP/USD Forecast: Critical 50% Fibonacci Retracement at 1.3500 Emerges as Pivotal Support Zone

By |2026-04-18T01:53:02+02:00April 18, 2026|Forex News, News|0 Comments

BitcoinWorld

GBP/USD Forecast: Critical 50% Fibonacci Retracement at 1.3500 Emerges as Pivotal Support Zone

LONDON, March 2025 – The GBP/USD currency pair, commonly known as ‘Cable,’ is currently navigating a critical technical juncture as the 50% Fibonacci retracement level near the 1.3500 handle solidifies into a formidable support zone. This development follows a period of heightened volatility driven by shifting monetary policy expectations and geopolitical developments. Consequently, market participants are closely monitoring this price region for signals that will dictate the pair’s medium-term trajectory. This analysis provides a comprehensive examination of the technical landscape, fundamental drivers, and historical context surrounding this pivotal level.

GBP/USD Forecast: Decoding the Fibonacci Framework

Technical analysts utilize Fibonacci retracement levels to identify potential support and resistance areas following a significant price move. The tool draws horizontal lines at key percentages of the prior trend’s range. For GBP/USD, traders have applied the Fibonacci retracement to the notable decline from the July 2024 high near 1.4200 to the October 2024 low around 1.2800. The resulting 50% retracement level sits precisely at 1.3500, a major psychological and technical benchmark.

Market behavior around these levels often provides critical insights. Recently, the pair has tested the 1.3500 region on multiple occasions, with each test resulting in a bounce or consolidation. This repeated interaction confirms the zone’s significance. Furthermore, the 38.2% and 61.8% Fibonacci levels at 1.3310 and 1.3690, respectively, act as secondary support and resistance markers, framing the current trading range.

  • Key Fibonacci Levels: 38.2% (1.3310), 50% (1.3500), 61.8% (1.3690).
  • Psychological Level: The 1.3500 handle represents a major round number.
  • Confluence: This area aligns with a previous resistance-turned-support zone from Q1 2024.

Fundamental Backdrop Influencing Cable’s Trajectory

The technical setup exists within a complex fundamental environment. On the British pound side, the Bank of England’s (BoE) ongoing balancing act between persistent services inflation and a weakening labor market continues to create uncertainty. Market pricing suggests a slower pace of rate cuts compared to the Federal Reserve, providing a relative yield support for sterling. However, concerns over UK economic growth and fiscal sustainability present headwinds.

Conversely, the US dollar’s direction hinges on Federal Reserve policy and broader risk sentiment. Recent softer inflation prints have reinforced expectations for an impending Fed easing cycle, which typically weighs on the dollar. Nonetheless, its status as a global safe-haven currency can trigger inflows during periods of geopolitical stress, as witnessed in early 2025. This fundamental tug-of-war directly impacts the GBP/USD equilibrium.

Expert Analysis and Market Sentiment Indicators

Institutional research desks have published varied outlooks. For instance, analysts at major banks note that a sustained hold above the 1.3500 Fibonacci support could open a path toward testing the 1.3690 (61.8% retracement) resistance. A breakdown, however, would target the 1.3310 level and potentially challenge the 2024 lows. Commitment of Traders (COT) reports from the CFTC show that leveraged funds have recently reduced net short positions on GBP, indicating a less pessimistic stance.

Option market dynamics also offer clues. The concentration of option expiries and heightened implied volatility around the 1.3500 strike price often acts as a ‘gravitational pull’ for the spot price in the days leading to expiry. This phenomenon, known as ‘pinning,’ can temporarily amplify support or resistance effects at these technical levels.

Historical Precedents and Comparative Analysis

Examining past behavior provides context for current price action. Historically, the 50% Fibonacci retracement has served as a reliable pivot point for GBP/USD across multiple market cycles. For example, during the post-Brexit vote recovery in 2017, the 50% retracement of the 2014-2016 decline acted as a sturdy platform for a multi-month consolidation before a further rally ensued.

A comparative analysis with other major currency pairs reveals similar patterns. The EUR/USD pair, for instance, recently respected its own 50% Fibonacci level during the 2023-2024 cycle, demonstrating the broad applicability of this technical tool in forex markets. The table below summarizes key technical indicators for GBP/USD as of March 2025:

Indicator Level Signal
50-Day Moving Average 1.3475 Dynamic Support
200-Day Moving Average 1.3380 Long-Term Trend
RSI (14-day) 48 Neutral
Key Fibonacci Support 1.3500 (50%) Primary Zone

Conclusion

The GBP/USD forecast remains tightly linked to the integrity of the 50% Fibonacci retracement support near 1.3500. This zone represents a confluence of technical significance, psychological importance, and current market positioning. While fundamental factors from both the UK and US will ultimately drive the long-term trend, the price action around this 1.3500 handle will likely serve as a critical barometer for trader sentiment and risk appetite in the forex market. A decisive break, either above the 1.3690 resistance or below the 1.3310 support, will be required to establish the next sustained directional move for Cable.

FAQs

Q1: What is a Fibonacci retracement level in forex trading?
A Fibonacci retracement is a technical analysis tool that identifies potential support and resistance levels based on key ratios derived from the Fibonacci sequence. Traders apply it to a prior significant price swing to forecast where pullbacks might find support or face resistance.

Q2: Why is the 1.3500 level specifically important for GBP/USD?
The 1.3500 level is important because it represents the exact 50% retracement of the pair’s 2024 decline, acts as a major psychological round number, and coincides with a previous price structure from early 2024, creating a strong zone of technical confluence.

Q3: What fundamental factors could cause GBP/USD to break below 1.3500 support?
A more aggressive than expected shift to dovish policy by the Bank of England, a significant weakening of UK economic data, a surge in safe-haven demand for the US dollar due to geopolitical risk, or a more hawkish recalibration of Federal Reserve policy could all pressure the pair below this support.

Q4: How do traders use the 50% Fibonacci level in their strategies?
Traders may look for bullish reversal patterns or oversold signals when the price approaches the 50% level from above, using it as a potential entry zone for long positions with a stop loss placed below the next Fibonacci level (e.g., 61.8%). Conversely, a break below it may be used as a signal for short positions.

Q5: What are the next key technical levels if GBP/USD holds above 1.3500?
If the pair holds the 1.3500 support, the immediate upside resistance to watch is the 61.8% Fibonacci retracement near 1.3690. Beyond that, the 1.3800 psychological level and the 2024 high near 1.4200 would become longer-term targets for a bullish scenario.

This post GBP/USD Forecast: Critical 50% Fibonacci Retracement at 1.3500 Emerges as Pivotal Support Zone first appeared on BitcoinWorld.

Source link

17 04, 2026

Forecast update for EURUSD -17-04-2026.

By |2026-04-17T21:52:00+02:00April 17, 2026|Forex News, News|0 Comments

The GBPJPY pair needs positive momentum until this moment, forcing it to form weak sideways trading by its stability near 215.40, note that the stability of the trading above the initial support at 214.15 in the current period, to confirm the continuation of the positivity, which might target 216.20 level reaching 217.00.


While facing negative pressure and reaching below 214.15 will push it to activate the bearish corrective track, to expect suffering several losses by reaching 213.60 and 213.30.


The expected trading range for today is between 214.55 and 216.20


Trend forecast: Bullish


Source link

17 04, 2026

USD/JPY, AUD/USD and GBP/JPY Forecasts – Yen Continues to Face Pressure

By |2026-04-17T17:51:01+02:00April 17, 2026|Forex News, News|0 Comments

The Australian dollar has actually hit a fresh new high against the Japanese yen as we have cleared the 114 level. I am bullish of this pair and I do think short-term pullbacks will continue to offer buying opportunities, not only due to the interest rate differential but the fact that this is a bit of a commodity play and of course, a play on the fact that Australia is one of the few central banks around the world that has actually raised rates recently.

Ultimately, I do think that we go looking to a much higher level, perhaps 118 yen. That is a longer-term thought, that is not anything we are going to see in the next few days, but I like owning this pair.

GBP/JPY Technical Analysis

Source link

17 04, 2026

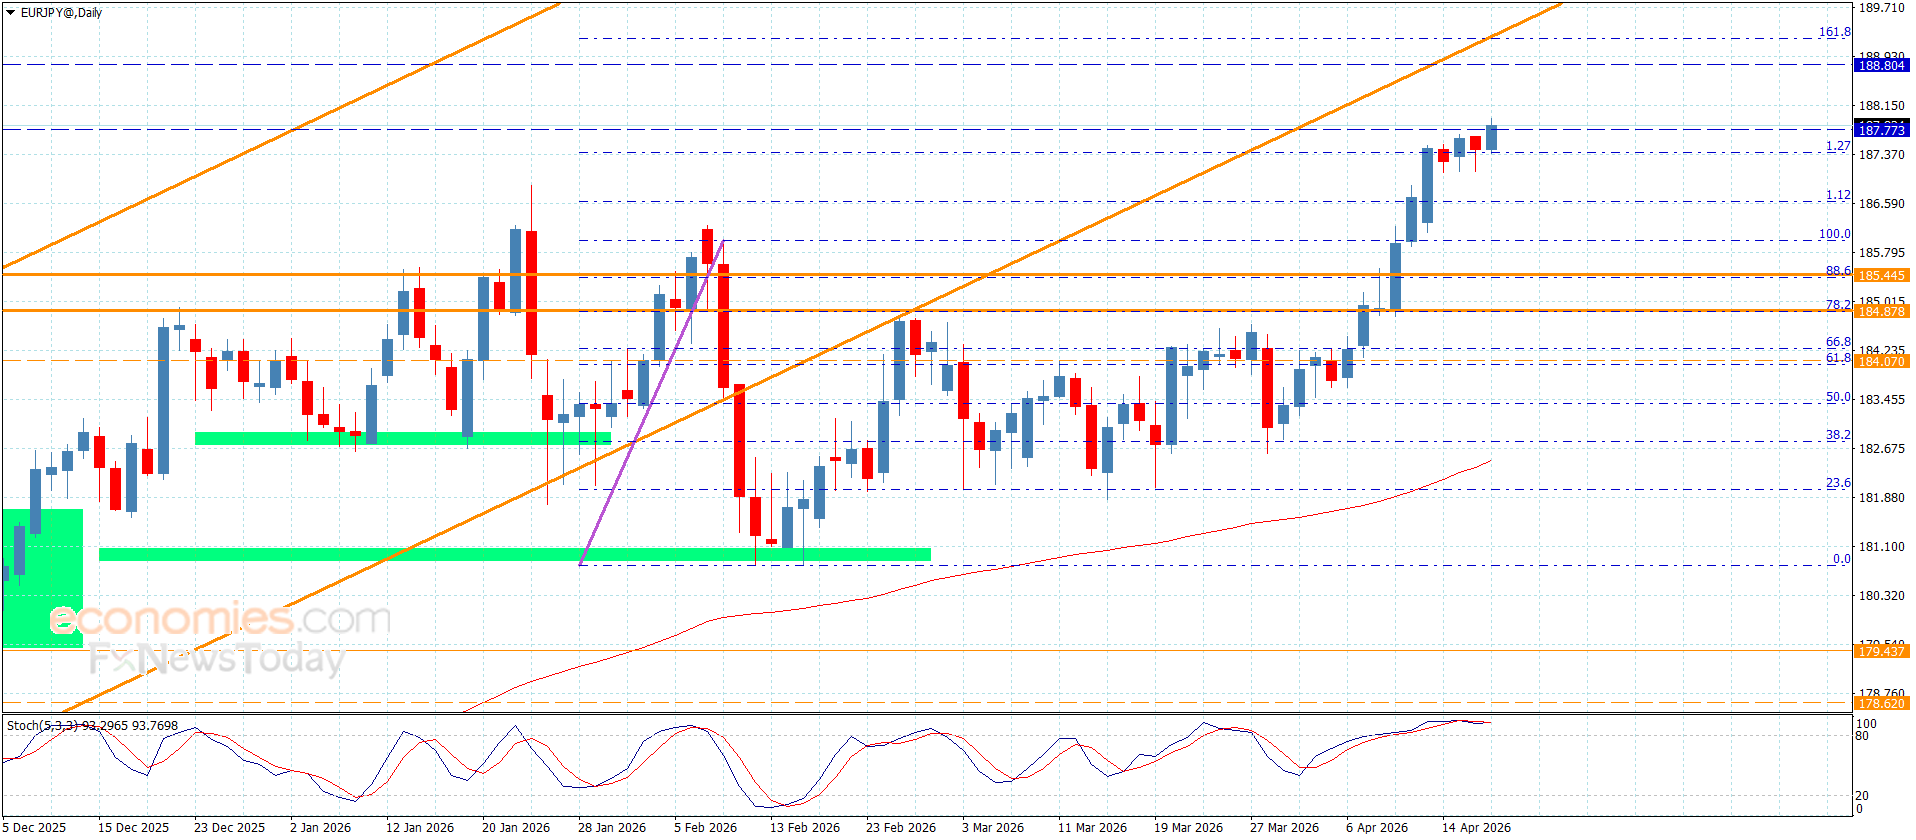
The EURJPY remains bullish– Forecast today – 17-4-2026

By |2026-04-17T13:50:08+02:00April 17, 2026|Forex News, News|0 Comments

Copper price began its trading by losing the bullish momentum due to stochastic attempt to end the bullish rally, to settle again near $5.9700 level, which formed strong barrier in the previous trading.


The stability above $5.9700 supports the chances of gathering the required extra positive momentum to motivate the bullish rally that might target $6.1550 and $6.2500, while the decline below it might force it to provide temporary trading, to target $5.8100 before reaching the additional positive targets.


The expected trading range for today is between $5.9100 and $6.1550


Trend forecast: Fluctuated


Source link

17 04, 2026

USD/JPY Forecast: Extends rebound toward mid-159.00s range

By |2026-04-17T09:48:53+02:00April 17, 2026|Forex News, News|0 Comments

The USD/JPY pair is seen building on the previous day’s goodish rebound from the 158.25 region, or over a one-week low, and gaining some follow-through positive traction on Friday. This marks the third straight day of a move up and lifts spot prices to mid-159.00s during the Asian session.

The Japanese Yen (JPY) continues with its relative underperformance in the wake of growing market concerns about the potential economic implications of the Middle East conflict. Furthermore, declining market expectations for a Bank of Japan (BoJ) rate hike in April further undermine the JPY and act as a tailwind for the USD/JPY pair.

Meanwhile, the instability in the Strait of Hormuz, due to the US naval blockade of Iranian ports, assists the US Dollar (USD) in preserving the previous day’s recovery gains from its lowest level since late February. However, hopes for Iran diplomacy and fading hawkish US Federal Reserve (Fed) bets cap the buck and the USD/JPY pair.

The overnight rebound from the 200-period Exponential Moving Average (EMA) support on the 4-hour chart, which coincides with the lower end of a short-term trading range, and the subsequent move up favor the USD/JPY bulls. Moreover, momentum metrics validate the positive outlook and back the case for a further appreciating move.

The Relative Strength Index is around 61, suggesting firm but not overstretched buying pressure. Moreover, the Moving Average Convergence Divergence (MACD) line has turned higher in positive territory. This hints at strengthening upside momentum and suggests that the path of least resistance for the USD/JPY pair remains to the upside.

In the meantime, initial support is seen at the recent price pivot near 159.47, with a deeper cushion provided by the 200-period EMA at 158.46, which should act as a key downside reference. As long as sellers fail to force a sustained break below the 200-period EMA, dips are likely to be treated as corrective within the prevailing bullish structure.

(The technical analysis of this story was written with the help of an AI tool.)

USD/JPY 4-hour chart

Japanese Yen Price Today

The table below shows the percentage change of Japanese Yen (JPY) against listed major currencies today. Japanese Yen was the strongest against the British Pound.

USD EUR GBP JPY CAD AUD NZD CHF
USD -0.01% 0.03% 0.21% -0.14% -0.12% 0.03% -0.05%
EUR 0.01% 0.04% 0.19% -0.15% -0.11% 0.03% -0.05%
GBP -0.03% -0.04% 0.15% -0.19% -0.15% -0.01% -0.08%
JPY -0.21% -0.19% -0.15% -0.34% -0.32% -0.19% -0.25%
CAD 0.14% 0.15% 0.19% 0.34% 0.02% 0.16% 0.10%
AUD 0.12% 0.11% 0.15% 0.32% -0.02% 0.14% 0.07%
NZD -0.03% -0.03% 0.01% 0.19% -0.16% -0.14% -0.07%
CHF 0.05% 0.05% 0.08% 0.25% -0.10% -0.07% 0.07%

The heat map shows percentage changes of major currencies against each other. The base currency is picked from the left column, while the quote currency is picked from the top row. For example, if you pick the Japanese Yen from the left column and move along the horizontal line to the US Dollar, the percentage change displayed in the box will represent JPY (base)/USD (quote).

Source link

17 04, 2026

EUR/JPY Forecast: Pair’s Critical Resilience Test at 187.50 Amid Bullish 100-Day EMA Support

By |2026-04-17T05:47:06+02:00April 17, 2026|Forex News, News|0 Comments

BitcoinWorld

EUR/JPY Forecast: Pair’s Critical Resilience Test at 187.50 Amid Bullish 100-Day EMA Support

The EUR/JPY currency pair presents a compelling technical narrative in early 2025, as it weakens toward the 187.50 level while demonstrating notable resilience above its critical 100-day Exponential Moving Average. This price action creates a crucial juncture for traders and analysts monitoring the cross between the Euro and the Japanese Yen. Market participants globally are scrutinizing this dynamic for signals about broader risk sentiment and central bank policy divergence. Consequently, the pair’s behavior near these technical landmarks offers significant insights into potential future directional moves.

EUR/JPY Technical Analysis and Current Price Dynamics

As of late March 2025, the EUR/JPY exchange rate trades cautiously around the 187.50 handle. This level represents a short-term support zone that has attracted consistent buying interest throughout the first quarter. However, the more substantial and widely watched technical feature remains the 100-day Exponential Moving Average, currently positioned several pips below the spot price. Historically, this moving average has acted as a robust dynamic support during the pair’s broader uptrend, which began in late 2024. A sustained hold above this indicator typically signals maintained bullish momentum from a medium-term perspective.

Several key technical indicators provide context for the current consolidation. The Relative Strength Index (RSI) on the daily chart has retreated from overbought territory above 70, now hovering in the mid-50s. This suggests a healthy correction within a prevailing uptrend rather than a fundamental reversal. Furthermore, trading volume profiles indicate accumulation near the 187.00-187.80 range, reinforcing the area’s importance. Market analysts often reference these confluence zones where price, volume, and moving averages intersect to gauge potential pivot points.

Fundamental Drivers Influencing the Euro Yen Cross

The fundamental backdrop for EUR/JPY involves a complex interplay between European and Japanese economic policies. On the Eurozone side, the European Central Bank’s (ECB) communicated path for interest rates remains a primary driver. Investors are closely parsing statements from ECB officials for clues on the timing and pace of any further policy normalization beyond initial rate cuts. Conversely, the Bank of Japan (BOJ) continues its nuanced exit from ultra-accommodative monetary settings, a process that markets are still calibrating. This policy divergence creates inherent volatility for the cross.

Economic data releases directly impact trader sentiment. Strong Eurozone inflation or growth figures can bolster the Euro, while signs of persistent weakness in Japan’s economic recovery may limit the Yen’s appeal. Geopolitical developments and global risk appetite also play outsized roles, as the Yen traditionally functions as a safe-haven currency. Therefore, a shift toward risk-off sentiment can trigger Yen strength, pressuring EUR/JPY lower irrespective of Euro-specific news. Analysts must therefore consider both regional and global catalysts.

Expert Analysis on Key Support and Resistance Levels

Financial strategists emphasize the hierarchical structure of support levels. The immediate support rests at the recent lows near 187.30, followed by the more significant 100-day EMA, which currently approximates 186.80. A decisive daily close below this moving average would likely trigger a deeper corrective phase, potentially targeting the 185.50 region. On the upside, initial resistance is seen near 188.20, the late-February swing high. A clean break above this barrier could open the path toward the psychological 190.00 level, a target many institutional forecasts mention for Q2 2025.

Seasoned chartists also monitor candlestick patterns for reversal or continuation signals. The recent price action has formed several inside bars and doji candles near 187.50, indicating equilibrium and indecision. This often precedes a volatility expansion. The commitment of traders (COT) reports, which show positioning by large speculators, provide another layer of insight. Current data suggests that while long positions in EUR/JPY remain substantial, some profit-taking has occurred, aligning with the recent pullback from yearly highs.

Comparative Performance and Market Context

Understanding EUR/JPY requires viewing it within the broader Forex landscape. The pair’s performance often correlates with global equity markets and the general appetite for carry trades, where investors borrow in low-yielding currencies like the JPY to invest in higher-yielding assets. The table below summarizes key technical levels and comparative strength against other major Yen crosses as of this analysis:

Currency Pair Key Level Relation to 100-day EMA Weekly Trend
EUR/JPY 187.50 Above Bullish Consolidation
GBP/JPY 192.00 Above Bullish
USD/JPY 158.00 At EMA Neutral
AUD/JPY 98.50 Below Corrective

This comparative analysis reveals that EUR/JPY maintains relative strength among the major Yen pairs, underscoring the underlying demand for Euro exposure against the Japanese currency. The pair’s ability to hold above its primary moving average, while others test or breach theirs, is a technically positive sign. Market technicians interpret this relative performance as a clue to underlying capital flows and sector rotation within the Forex market.

Conclusion

The EUR/JPY forecast hinges on the pair’s interaction with the 187.50 support and the 100-day Exponential Moving Average. While short-term weakness is evident, the broader bullish structure remains intact as long as price sustains above this key dynamic level. Traders should monitor upcoming economic data from both regions and any shifts in central bank rhetoric for directional catalysts. The technical setup suggests that the current consolidation may resolve with a continuation of the prior uptrend, provided global risk sentiment remains stable. Consequently, the 100-day EMA continues to serve as the critical line in the sand for the medium-term EUR/JPY outlook.

FAQs

Q1: What does the 100-day EMA indicate for EUR/JPY?
The 100-day Exponential Moving Average is a widely followed medium-term trend indicator. A price trading above it generally suggests a bullish bias, while trading below it can indicate bearish momentum. For EUR/JPY, holding above it supports the ongoing uptrend narrative.

Q2: Why is the 187.50 level significant?
The 187.50 level has acted as a recent pivot point and area of price congestion, where buying and selling interest has historically been balanced. It represents immediate short-term support, and a break below could accelerate selling toward the next major support at the 100-day EMA.

Q3: How do Bank of Japan policies affect EUR/JPY?
The Bank of Japan’s monetary policy directly influences the Yen’s value. A more hawkish BOJ (hinting at rate hikes or reducing stimulus) typically strengthens the JPY, weighing on EUR/JPY. The pace of the BOJ’s policy normalization is a key watchpoint for cross traders.

Q4: What is the main risk to the bullish forecast?
The primary risk is a sustained break below the 100-day EMA on a daily closing basis. This would technically invalidate the current bullish structure and could trigger a deeper correction, potentially driven by a surge in safe-haven Yen demand or unexpectedly dovish ECB signals.

Q5: How does global risk sentiment impact this currency pair?
EUR/JPY is considered a “risk-sensitive” cross. In periods of positive risk appetite (rising stock markets), the pair tends to rise as investors sell the safe-haven JPY. During risk-off periods, the pair often falls due to JPY buying, regardless of Euro-specific news.

This post EUR/JPY Forecast: Pair’s Critical Resilience Test at 187.50 Amid Bullish 100-Day EMA Support first appeared on BitcoinWorld.

Source link

Go to Top