8
12, 2025


8
12, 2025
Weekly Forex Forecast For DXY, EURUSD, GBPUSD, And XAUUSD (December 8-12, 2025)
In today’s Weekly Forex Forecast, I’m breaking down my exact trade plan for the DXY, EURUSD, GBPUSD, and XAUUSD.
Can the euro confirm last week’s bullish change of character on the 4-hour chart?
I explain that and more in today’s video.
US Dollar Index (DXY) Forecast
The DXY did what I was anticipating last week as the market rotated lower from the upper band of its distribution channel. It was a clean reaction using the same combination of channels and SMC structure concepts I always look for.
The key for next week is the 4-hour structure. The only low that matters for market structure is 98.60. That is the level that produced the last confirmed bullish break of structure (BoS).
We also have the September FVG sitting there, still unmitigated. I want to see price tag that level next week.
If buyers defend 98.60, the bullish structure remains intact, but only if the DXY then closes above 99.12. If we close below 98.60, that would shift momentum and give us a confirmed bearish Change of Character (CHoCH).
The focus next week is simple. DXY bulls must hold above 98.60 to keep the bullish narrative alive. A sustained break below on the high time frames would confirm a bearish CHoCH.
EURUSD Forecast
EURUSD is showing early signs of strength after confirming a CHoCH on the 4-hour chart. That happened when price broke above the 1.16668 high.
The level buyers need to defend is 1.1590. That is the low that produced the last valid break of structure.
As long as EURUSD stays above that low, the pair has room to continue higher.
But EURUSD still depends heavily on the DXY. Before I turn bullish on the euro, I need to see the dollar index below 98.60. Until then, I’ll take last week’s EURUSD bullish CHoCH with a grain of salt.
Admittedly, last week was a bit frustrating because the EURUSD came within a few pips of sweeping the equal lows I wanted. Still, we got the EURUSD rally, which was my base case last weekend.
The bigger picture remains bullish as long as 1.1590 holds. A confirmed break below that low would invalidate the CHoCH.
 2")
GBPUSD Forecast
GBPUSD hit the September FVG last week that I had my eye on. That level came from a clean three candle pattern on the monthly.
The pound came close to my ideal entry zone but didn’t quite reach it. I wanted a deeper move into the pocket that showed more confluence.
Even without that, the market reacted and pushed higher, so the short-term structure remains bullish.
The bigger question is whether this is the bottom for GBPUSD or simply a relief rally within the downtrend. Some recent highs only produced wicks and not closes.
That makes it difficult to confirm a true CHoCH on higher timeframes. The DXY holding above 98.60 adds to the uncertainty.
Several inefficiencies beneath GBPUSD still need to be filled, specifically near 1.3270. If the dollar bounces from 98.60, the pound could struggle.
For now, GBPUSD is bullish in the short term. The reaction from any pullback next week will tell us whether buyers remain in control.
 3")
XAUUSD (Gold) Forecast
Gold moved sideways last week, but the structure is unchanged. The 4-hour trend remains bullish, with a recent break of structure, confirming higher highs and lows.
I am watching a key pocket below current levels next week. It includes a weekly bullish FVG, a daily FVG, and a sell-side single print.
That entire area remains unmitigated. It would be a clean place for a pullback.
Last week I wanted to see gold trade into that pocket and print a lower timeframe bullish CHoCH. Instead, the market stalled and traded sideways.
The same setup is valid going into next week. As long as gold stays above the key lows just above $4,000, buyers remain in control.
The trend line below also supports the idea of continuation. I would never use a trend line on its own, but it does intersect with the $4,130 support area.
 4")
8
12, 2025
Sip, sweat, repeat: Science shows this energizing tea can fuel your workouts
There’s no silver bullet, and plenty of “energy-boosting” fitness and wellness products are more hype than anything else. However, there are some science-based ways to boost your energy if you’re feeling sluggish at the gym. Can you really sip your way to more energy? Gulping gallons of coffee every week isn’t the recommended approach to powering through that workout.
Research shows green tea consumption can actually help prevent the production of reactive oxygen species and improve sports performance.
Catechins in green tea
Ali Senol / Pexels
Exercising, particularly in more intense or longer sessions, can cause your body to produce free radicals, which are unstable molecules. When these free radicals build up in your body, higher numbers lead to oxidative stress — a condition involving tiredness and slower workout recovery. The powerful antioxidants in green tea, particularly catechins like EGCG, help neutralize and combat these free radicals, which can help your body better handle the stress of exercise.
Boost performance

Unitea / Pixabay
In research published in the International Journal of Environmental Research and Public Health, the authors revealed that green tea consumption can boost endurance and reduce fatigue. Of course, again, it’s not a magic remedy that will solve all of your gym woes, but it’s certainly worth considering if you’re looking to add a little pep in your step. Green tea improves your body’s ability to use fat as a fuel, and that could help your stamina in the gym. Researchers from different studies have also pointed out how this could be useful for weight loss.
Boosting nitric oxide (NO)

Andres Ayrton / Pexels
This research also shows green tea boosts nitric oxide, which helps to widen your blood vessels, allowing more oxygen to get to your muscles. More oxygen could mean better performance and less tiredness.
Anti-inflammatory effect

Dogu Tuncer / Pexels
The anti-inflammatory effects of this vibrant tea could help lower muscle pain and exercise-related muscle damage.
The combo of green tea and exercise

Matcha Co / Unsplash
Combining green tea with exercise could help you feel less tired and burn more fat during your workouts, according to the research. It’s also a safer option to improve performance for most people, and it doesn’t come along with a risk of harmful side effects. Green tea can act as a natural performance enhancer if you drink it regularly, particularly before or around exercise. Research shows you can improve your endurance, lower fatigue, recover faster, and help combat oxidative stress.
8
12, 2025
An enterprise blockchain without mining
Microsoft Azure has just released a Blockchain-as-a-Service product that uses Ethereum to support blockchain with a set of templates to deploy and configure your choice of blockchain network. This can be done with minimal Azure and blockchain knowledge.
The conventional blockchain in the open is based on Proof-of-Work (PoW) and requires mining as the parties do not trust each other. An enterprise blockchain does not require PoW but is based on Proof-of-Authority (PoA) where approved identities or validators on a blockchain, validate the transactions on the blockchain.
The PoA product features a decentralized application (DApp) called the Governance DApp. Blockchains in this new model can be deployed in 5-45 minutes depending on the size and complexity of the network.
The PoA network comes with security features such as identity leasing system to ensure no two nodes carry the same identity. There are also other features to achieve good performance.
- Web assembly smart contracts: Solidity is cited as one of the pain areas when developing smart contracts on Ethereum. This feature allows developers to use familiar languages such as C, C++, and Rust.
- Azure Monitor: Used to track node and network statistics. Developers can view the underlying blockchain to track statistics while the network admins can detect and prevent network outages.
- Extensible governance: With this feature, customers can participate in a consortium without managing the network infrastructure. It can be optionally delegated to an operator of their choosing.
- Governance DApp: Provides a decentralized governance in which network authority changes are administered via on-chain voting done by select administrators. It also contains validator delegation for authorities to manage their validator nodes that are set up in each PoA deployment. Users can audit change history, each change is recorded, providing transparency and auditability.
Source: Microsoft Blog
Along with these features, the Governance DApp will also ensure each consortium member has control over their own keys. This enables secure signing on a wallet chosen by the user.
The blog mentions “In the case of a VM or regional outage, new nodes can quickly spin up and resume the previous nodes’ identities.”
To know more visit the official Microsoft Blog.
Read next
Automate tasks using Azure PowerShell and Azure CLI [Tutorial]
Microsoft announces general availability of Azure SQL Data Sync
Microsoft supercharges its Azure AI platform with new features
8
12, 2025
 Hit Two‑Week High on Fed Cut Bets and Geopolitical Risks – Full News & Forecasts, 5–7 December 2025") Brent Crude Oil Last Day Financial Futures (BZ=F) Hit Two‑Week High on Fed Cut Bets and Geopolitical Risks – Full News & Forecasts, 5–7 December 2025 Gallery
Brent Crude Oil Last Day Financial Futures (BZ=F) Hit Two‑Week High on Fed Cut Bets and Geopolitical Risks – Full News & Forecasts, 5–7 December 2025 GalleryBrent Crude Oil Last Day Financial Futures (BZ=F) Hit Two‑Week High on Fed Cut Bets and Geopolitical Risks – Full News & Forecasts, 5–7 December 2025
 Hit Two‑Week High on Fed Cut Bets and Geopolitical Risks – Full News & Forecasts, 5–7 December 2025")
Brent Crude Oil Last Day Financial Futures (BZ=F) Hit Two‑Week High on Fed Cut Bets and Geopolitical Risks – Full News & Forecasts, 5–7 December 2025
Brent crude oil’s financial benchmark is ending the first week of December on a surprisingly firm footing. The front‑month Brent Crude Oil Last Day Financial futures contract (ticker BZ=F) settled around $63.75 per barrel on Friday, 5 December, its highest close in two weeks and roughly the second straight weekly gain for the benchmark. [1]
The move comes even as forecasters warn of a looming supply surplus in 2026 and see Brent drifting back toward $55–$60 per barrel next year. Yet for now, rate‑cut expectations from the U.S. Federal Reserve and a new wave of geopolitical tension are putting a floor under prices.
This article breaks down the latest price action in Brent Crude Oil Last Day Financial futures, the macro and geopolitical drivers between 5–7 December 2025, and what major banks and agencies are projecting for oil prices in 2026 and beyond.
What Exactly Is “Brent Crude Oil Last Day Financial”?
On the New York Mercantile Exchange (CME/NYMEX), traders can access Brent through Brent Last Day Financial Futures, ticker BZ (shown on many platforms as BZ=F).
These contracts:
- Are cash‑settled, not physically delivered.
- Settle against the ICE Brent Crude Oil Index published after the final trading day of the month. [2]
- Track the same underlying benchmark that drives ICE Brent futures, used to price about 80% of seaborne crude worldwide. [3]
Because BZ=F mirrors the global Brent benchmark without physical delivery, it has become a popular tool for refiners, airlines, producers and macro traders who want clean financial exposure to Brent without logistics risk.
Price Snapshot: Brent Futures Back Above $63
Front‑month futures and the BZ=F contract
Several data providers show a tight cluster of prices for Friday, 5 December:
- ICE Brent futures settled at $63.75/bbl, up about 0.8% on the day and marking the highest close since 18 November. [4]
- The Brent Crude Oil Last Day Financial (BZ=F) front‑month contract recorded an open near $62.80, intraday high around $64.08, low around $63.07, and settlement at $63.75, on volume of just over 23,000 contracts. [5]
- A separate exchange report from New York confirmed Brent for February delivery rising $0.49 (0.77%) to settle at $63.75, while WTI for January delivery closed at $60.08, up 0.69%. [6]
A Saudi‑based daily market report summarised the week by listing Brent at $63.75/bbl, up 0.8% on the day and about 2.2% on the week, but still roughly 10.6% lower year‑to‑date. West Texas Intermediate (WTI) is down about 11.5% YTD at $60.08/bbl. [7]
Technical tone: cautiously bullish
Short‑term technical indicators for Brent futures skew positive. A popular dashboard at Investing.com shows a “Strong Buy” composite signal for Brent as of late 5 December, with the 14‑day RSI around 60 and a majority of oscillators and moving‑average signals pointing to further upside in the near term. [8]
In simple terms: futures traders see momentum improving, but not yet overheating.
Fed Cut Bets: The Macro Engine Behind the Rally
The single biggest driver of this week’s bounce has been the sudden jump in expectations for a U.S. Federal Reserve rate cut at the upcoming 9–10 December FOMC meeting.
On Friday, Reuters reported that oil prices “edged up nearly 1% to a two‑week high” as traders priced in an 87% probability of a 25‑basis‑point cut, according to CME Group’s FedWatch tool. [9]
Key macro points from 5–7 December:
- U.S. inflation and spending: A widely watched inflation report showed core PCE running slightly below economists’ forecasts, while consumer spending slowed after several strong months. [10]
- Mixed U.S. data: The manufacturing PMI slipped to 48.2 (contraction), while the services PMI held above 50, underscoring a “K‑shaped” economy but reinforcing bets on easier policy. [11]
- Oil market reaction: Kuwait‑based commentary highlighted Brent futures holding around $63.3/bbl as a two‑week high, explicitly linking the resilience in oil to Fed cut expectations and geopolitical risk premia. [12]
For BZ=F traders, the macro story is straightforward: a dovish Fed tends to weaken the dollar and support global growth expectations, both of which are historically positive for dollar‑priced commodities like Brent.
Geopolitics Keeps a Risk Premium in Brent
While macro data drives the broader risk appetite, geopolitics is quietly rebuilding a risk premium in Brent—and therefore in Brent Crude Oil Last Day Financial futures.
Ukraine and Russia
- On 4 December, oil rallied after renewed Ukrainian drone strikes on Russian oil infrastructure, including attacks on the Druzhba pipeline and refinery assets, with analysts at Kpler estimating a roughly 335,000 bpd year‑on‑year drop in Russian refining throughput from September to November. [13]
- Reuters notes that these attacks, combined with stalled Russia‑Ukraine peace talks, are keeping expectations of a quick return of Russian barrels firmly in check and helping to pin Brent in a $60–$70/bbl range for now. [14]
Sanctions, ESPO discounts and Russian export flows
On 5 December, another Reuters piece detailed how Russian ESPO blend cargoes to China for December loading are trading at a record discount of $5–$6/bbl to ICE Brent, compared with just $0.50–$1/bbl in late October. [15]
The deeper discounts are driven by:
- New U.S. sanctions on Lukoil and Rosneft,
- State‑owned Chinese refiners temporarily suspending ESPO purchases, and
- Some December ESPO cargoes still looking for buyers—unusual for this sought‑after grade. [16]
For Brent itself, that’s a mixed story: Russian barrels must price below Brent to clear, capping how high the benchmark can run. But the very need for such discounts underscores how sanctions and war are reframing flows around the Brent benchmark.
EU & G7 consider tougher maritime sanctions
Looking forward, Brussels and G7 capitals are debating an even more aggressive step: replacing the current Russian oil price cap with a full ban on maritime services for Russian exports.
A 6 December Reuters exclusive says the EU and G7 are discussing a near‑total prohibition on Western shipping, insurance and other services for Russian crude, potentially in the bloc’s next sanctions package due in early 2026. [17]
Because about one‑third of Russian exports still sail on Western‑linked tankers, such a move would force Moscow to expand its “shadow fleet” of older and opaque vessels, raise shipping costs and inject further uncertainty into Atlantic‑Basin supply. [18]
Venezuela tensions
Analysts also remain focused on U.S.–Venezuela tensions, with U.S. officials hinting at potential operations targeting drug traffickers that could disrupt Venezuela’s roughly 1.1 million bpd of output. [19]
Put together, these threads justify why Brent—and BZ=F—are holding above $63 even as forecasts for 2026 look notably softer.
Short‑Term Oil Price Outlook: Range‑Bound With a Bullish Skew
Several fresh notes between 5–7 December offer a consistent short‑term theme: Brent likely stays range‑bound around $60–$65, but the next big move depends on the Fed and geopolitics.
Trading desks: watching $59–$63 as a key band
A weekend forecast from TradingNEWS describes crude as “steady near $60–$64,” with WTI around $60.08 and Brent (BZ=F) near $63.75. The piece highlights a tug‑of‑war between: [20]
- Supportive factors:
- Black Sea disruptions—including an incident where a sanctioned Chinese‑owned tanker was reportedly struck by Ukrainian naval drones.
- OPEC+ supply discipline and limited spare capacity.
- Expectations for two Fed rate cuts in early 2026, which would underpin demand.
- Bearish forces:
- A swing in U.S. crude inventories from a 3.4 million barrel draw to a 2.8 million barrel build, leaving stocks around 426.9 million barrels.
- U.S. production hovering near 13.8 million bpd, close to record highs. [21]
The conclusion: the market is “pinned” near a breakout zone but needs a clear catalyst—such as the FOMC decision or a major supply disruption—to convincingly move toward $70 or back into the mid‑$50s.
Forex.com: FOMC and geopolitics as twin catalysts
A same‑day Forex.com note titled “Crude Oil Outlook: FOMC and Geopolitical Uncertainty” similarly argues that crude markets are holding near key breakout levels, with rate‑cut sentiment offsetting worries about a 2026 supply surplus. The analysis stresses that any surprise from the Fed—or escalation in Ukraine or Venezuela—could quickly jolt prices out of their current range. [22]
Bank and Agency Forecasts: 2026 Could Look Very Different
The more sobering news for Brent bulls is that most medium‑term forecasts released this week see lower prices in 2026, even if near‑term volatility pushes futures higher.
Rabobank: Brent back to $60 early next year
On 7 December, Rabobank reiterated its view that Brent will average about $62/bbl in Q4 2025, before sliding to $60/bbl in Q1 2026 and then oscillating in a $58–$60 range for the rest of the year. [23]
The bank:
- Cites the International Energy Agency’s estimate of a 3.5–4 million bpd surplus in 2026,
- Warns of occasional sub‑$55 sell‑offs when oversupply narratives resurface, and
- Argues that if Brent were to “settle convincingly in the low‑$50s,” OPEC+ would likely respond with fresh cuts. [24]
U.S. EIA: Brent averaging mid‑$50s in 2026
The U.S. Energy Information Administration is slightly more bearish. In its latest Short‑Term Energy Outlook, the agency projects that: [25]
- Brent will average around $54/bbl in Q1 2026,
- And about $55/bbl for full‑year 2026,
as global oil inventories continue to build. The EIA did nudge its 2026 forecast up by $3/bbl compared with last month, citing stronger than expected stock draws in China and the impact of sanctions on Russia, but the direction still points lower from current BZ=F levels.
Fitch and other houses: oversupply theme
Fitch Ratings this week cut its 2025–2027 oil price assumptions, explicitly referencing market oversupply and production growth that is expected to outstrip demand. [26]
Similarly, several bank research desks have recently trimmed their 2026 forecasts, often projecting Brent in the high‑50s to low‑60s as new barrels from the U.S., Brazil and Guyana come online.
Longer‑Term Perspective: Demand Peak, but Not Collapse
Beyond the 2026 horizon, a widely discussed Morningstar report released on 5 December offers a nuanced take on oil’s future. [27]
Key points:
- Demand peak delayed: Global oil demand is now expected to rise from about 104 million bpd in 2024 to a peak of around 108 million bpd in 2032, then gradually decline.
- Gentle decline: By 2050, demand is projected to be only about 8% lower than in 2024, far less bearish than Morningstar’s 2021 forecast.
- Higher “mid‑cycle” price: Reflecting that resilience, Morningstar has raised its mid‑cycle Brent price assumption to $65/bbl from $60/bbl, lifting its valuation of many oil producers.
- Who keeps using oil? Aviation, marine shipping and petrochemicals are expected to be sticky demand centers, while road transport becomes increasingly electrified. Emerging economies outside China are projected to grow their share of global consumption from 40% in 2024 to 54% in 2050. [28]
For long‑dated BZ contracts and related options, this outlook helps explain why far‑out Brent strips still trade well above the mid‑$50s, even as near‑term contracts grapple with potential oversupply.
What It All Means for Brent Crude Oil Last Day Financial (BZ) Traders
With Brent Crude Oil Last Day Financial futures (BZ=F) hovering near $63–$64/bbl, traders and hedgers face a classic late‑cycle dilemma: strong short‑term support, weaker medium‑term fundamentals.
For hedgers (producers, refiners, consumers)
- Producers may see current BZ levels as an opportunity to lock in prices above many 2026 forecasts, particularly if their breakeven levels sit in the high‑40s or low‑50s.
- Refiners and airlines that are structurally long physical crude might prefer shorter‑dated hedges, betting that oversupply and slower growth will gradually push Brent back toward the mid‑50s.
- Corporate treasuries need to factor in the possibility of sharp, temporary spikes if sanctions tighten or a major supply route—such as the Black Sea or Persian Gulf—faces disruption.
For macro and speculative traders
Three themes stand out for the weeks ahead:
- FOMC decision (9–10 December)
- A more dovish Fed than markets expect could push BZ=F toward the upper end of this year’s range, especially if the dollar weakens further.
- A hawkish surprise—or a delay to rate cuts—could trigger profit‑taking and send Brent back toward the high‑50s.
- Sanctions and shipping policy
- Concrete steps by the EU and G7 to implement a maritime services ban on Russian oil would likely tighten Atlantic‑Basin supplies and add a structural risk premium to Brent. [29]
- War‑related disruptions
- Continued Ukrainian strikes on Russian infrastructure and any escalation in U.S.–Venezuela tensions remain upside risks, especially if shipments through key pipelines or ports are materially curtailed. [30]
In this context, it isn’t surprising to see technical indicators flashing “buy” even as fundamental analysts warn of 2026 softness.
Key Dates and Risks to Watch in December
Market participants in Brent Crude Oil Last Day Financial futures will be watching:
- 9–10 December – U.S. FOMC meeting and updated rate projections.
- Late December – Any formal announcement from the EU and G7 on a maritime services ban for Russian crude. [31]
- Upcoming OPEC+ monitoring meetings – Signals about whether the group will defend a floor near $60/bbl should prices slide.
- Ongoing headlines from Ukraine and Venezuela – Any disruption that removes even a few hundred thousand barrels per day can move Brent sharply in a market priced for surplus.
Bottom Line
Between 5–7 December 2025, Brent Crude Oil Last Day Financial futures (BZ=F) have:
- Rallied back to roughly $63.75/bbl, a two‑week high and roughly a 1% weekly gain. [32]
- Been buoyed by strong expectations of a Fed rate cut, which support both risk appetite and future oil demand. [33]
- Found additional support from geopolitical risks, including sanctions, Ukrainian strikes on Russian infrastructure, and potential disruptions in Venezuelan output. [34]
At the same time, Rabobank, the EIA and others still project Brent drifting back toward the mid‑50s to around $60/bbl in 2026, highlighting a likely tug‑of‑war between oversupply and geopolitics in the year ahead. [35]
For traders and hedgers using the BZ contract, the message is clear: the coming Fed meeting and evolving sanctions landscape could decide whether this winter’s rally has room to run—or whether current levels are an attractive chance to lock in prices before fundamentals reassert themselves.
References
1. www.reuters.com, 2. en.wikipedia.org, 3. en.wikipedia.org, 4. www.reuters.com, 5. finance.yahoo.com, 6. www.nampa.org, 7. www.alrajhi-capital.com, 8. www.investing.com, 9. www.reuters.com, 10. www.reuters.com, 11. kuwaittimes.com, 12. kuwaittimes.com, 13. www.reuters.com, 14. www.reuters.com, 15. www.reuters.com, 16. www.reuters.com, 17. www.reuters.com, 18. www.reuters.com, 19. www.reuters.com, 20. www.tradingnews.com, 21. www.tradingnews.com, 22. www.forex.com, 23. www.exchangerates.org.uk, 24. www.exchangerates.org.uk, 25. www.eia.gov, 26. www.reuters.com, 27. www.mrt.com, 28. www.mrt.com, 29. www.reuters.com, 30. www.reuters.com, 31. www.reuters.com, 32. www.reuters.com, 33. www.reuters.com, 34. www.reuters.com, 35. www.exchangerates.org.uk
7
12, 2025
XRP Price Prediction: XRP Shows Resilience Above $2 as Liquidation Heatmap Reveals Potential Buying Pressure
XRP is maintaining support above $2, navigating short-term market fluctuations, while analysis of Coinglass data suggests hidden liquidity clusters could influence the next directional move.
Despite recent sideways trading, XRP’s stability above this critical floor is attracting attention from both retail and institutional participants. By examining XRP’s spot ETF filings and the Coinglass liquidation heatmap, accumulation may be quietly occurring beneath the surface, potentially setting the stage for a controlled move higher.
Liquidity Clusters Signal Possible Hidden Demand
Analyzing the Coinglass XRP liquidation heatmap as of December 7, 2025, identified significant liquidity clusters around $2.25–$2.30. Historically, these zones have coincided with short-term price bounces, suggesting that leveraged positions in this area could trigger a cascade if approached.
XRP’s liquidation heatmap reveals heavy upside liquidity and strong ETF demand, suggesting a rapid rally once the market stabilizes. Source: @Web3Niels via X
These liquidity “pools” or “magnet zones,” as they are sometimes called, indicate where concentrated long or short positions are at risk of liquidation. In assessment, XRP’s current proximity to this cluster implies that if the price moves toward it, forced liquidations may temporarily increase volatility but also potentially attract buying, creating a short-term support or resistance dynamic.
Diverging Signals: ETF Inflow vs Price Action
Institutional interest in XRP remains notable. Since mid-November 2025, XRP spot ETF filings indicate daily inflows averaging $12–$15 million, making XRP one of the most actively accumulated crypto ETF assets in this period.
However, despite this institutional accumulation, XRP trades around $2.03, roughly 20% below levels from early November. This divergence suggests that while ETFs continue absorbing supply, retail sentiment is subdued, creating a temporary disconnect between price action and fundamental accumulation. This pattern resembles historical setups where ETF accumulation preceded consolidation before breakout attempts.
Technical Structure: Support Holds, But Bulls Need Conviction
From a technical standpoint, XRP has repeatedly defended the $2 support zone on daily charts, indicating a resilient floor. Each bounce off this level coincided with volume spikes, reinforcing the area’s significance.

XRP remains strong above key support, with bulls defending the floor, while a break above the falling channel could trigger a larger upward move. Source: TheSignalyst on TradingView
Still, for a sustained bullish reversal, price would likely need to break the descending channel and surpass recent major highs near $2.35–$2.40. Until then, it weighs short-term scenarios based on support retention:
-
Support holds: Look for measured long entries near $2.
-
Support breaks: Prepare for a potential downside toward $1.85–$1.90, which would invalidate the immediate bullish thesis.
What Is a Liquidation Heatmap and Why It Matters for XRP
A liquidation heatmap aggregates leveraged positions across exchanges, highlighting where forced liquidations, either long or short, are probable. On Coinglass, hotter zones (red or yellow) show higher liquidation concentration.
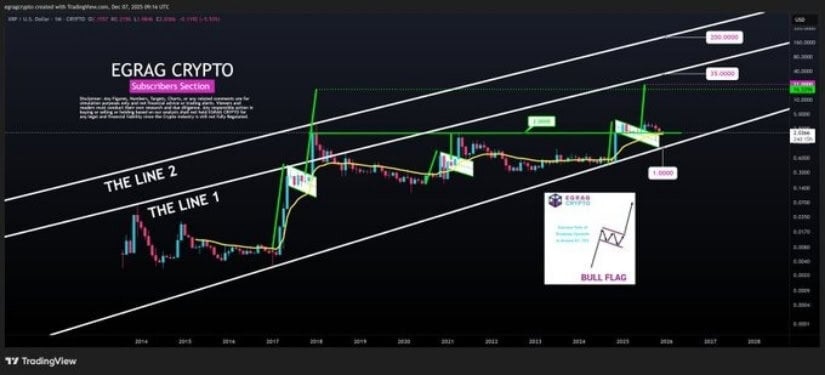
XRP holds above $2 and the 21 EMA, showing a macro bullish setup with potential upside toward key long-term targets. Source: @egragcrypto via X
Based on a review of XRP’s historical patterns, these clusters have reliably indicated short-term reaction zones. Price often “gravitates” toward them, producing either a short squeeze or temporary retracement. However, false signals are possible, particularly in thin liquidity periods or during low-volume holidays, emphasizing the importance of combining heatmap data with structural support analysis.
Applying this concept to XRP, the existing liquidity cluster around $2.25 suggests that if the price moves higher toward that zone, a significant amount of latent liquidity could be unlocked, possibly igniting a strong short-squeeze or rally.
Looking Ahead: Quiet Strength Hidden Beneath the Surface
While XRP may appear flat on surface charts, the combination of ETF inflows, defended support, and nearby liquidity clusters suggests an underlying layer of accumulation. The $2 floor continues to act as a stabilizing base, but traders should monitor the $2.25–$2.30 cluster for potential volatility triggers.
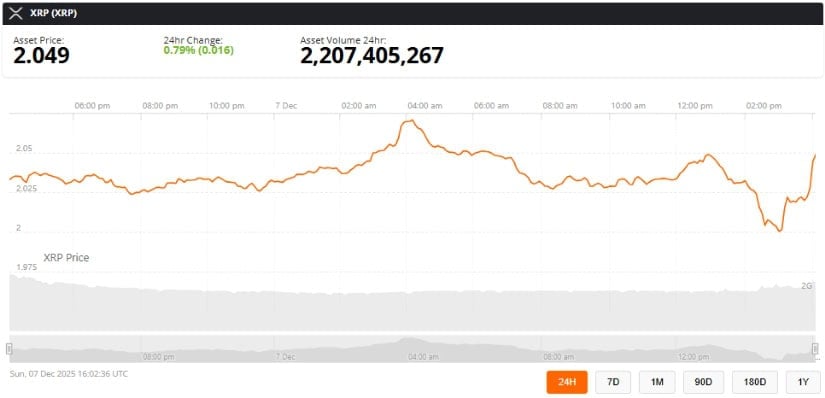
XRP was trading at around 2.04, up 0.79% in the last 24 hours at press time. Source: XRP price via Brave New Coin
The outlook remains conditionally bullish. Sustained upward momentum requires breaching the descending channel and surpassing short-term highs. Conversely, a breakdown below $2 would signal caution and possibly invite retracement. Overall, the analysis indicates that XRP’s market structure is quietly preparing for its next decisive move, with hidden liquidity likely influencing the direction.
7
12, 2025

Health Supplements Market Outlook: Sustained 9.1% CAGR Growth
The global health supplements market is large and expanding rapidly as consumers focus more on preventive health, immunity and performance. Industry estimates place the market in the low hundreds of billions (USD) with projected mid-to-high single-digit CAGRs through the late 2020s. Key growth drivers include ageing populations, rising chronic disease awareness, expansion in emerging markets (China, India, Southeast Asia), and the growth of e-commerce and direct-to-consumer channels.
As per MRFR analysis, The Global Health Supplements Market was estimated at 8.927 USD Billion in 2024. The health supplements industry is projected to grow from 9.739 USD Billion in 2025 to 23.27 USD Billion by 2035, exhibiting a compound annual growth rate (CAGR) of 9.1 during the forecast period 2025 – 2035.
Key market trends
Personalization & digital nutrition – Consumers increasingly seek personalized supplement plans based on biomarkers, apps, wearables and telehealth; assessment + subscription models are growing.
Functional ingredients & “wellness superfoods” – Ingredients such as adaptogens, nootropics, collagen, omega-3s, probiotics, and plant-based proteins are expanding across formats (powders, RTD,).
Chronic-condition & performance focus – Fast-growing subsegments include immunity, digestive health, sports nutrition, cognitive health and sleep support.
Plant-based & clean-label demand – Preference for plant-derived ingredients, clear sourcing, and sustainability is shaping product development.
Adjacency effects from new therapies – Changes in healthcare (e.g., new weight-loss treatments) are shifting diet and supplement-buying behaviours, affecting demand patterns for certain categories.
Request Your Sample Copy of This Strategic Report : https://www.marketresearchfuture.com/sample_request/1646
Market segmentation
➤Health Supplements Market – Type Outlook
Dietary Supplements
Bodybuilding Supplements
Eye Health Supplements
Specialty Supplements
Others
➤Health Supplements Market – End-Users Outlook
Hospitals
Clinics
Research Centers
Others
➤Health Supplements Market – Application Outlook
Cardiology
Rheumatic Disorders
Allergy
Others
➤Health Supplements Market – Ingredients Outlook
Vitamins & Minerals
Amino Acids
Botanicals
Enzymes
Others
competitive landscape
The market is fragmented: global CPG giants, specialized nutraceutical firms, multi-level marketing players, and DTC startups all compete. Large players use scale in manufacturing and distribution; agile startups win on branding, product innovation, and subscription models. Retailer private labels and mass-market brands exert pricing pressure, while clinical-grade and specialty formulations support premium pricing.
Herbalife (US)
Amway (US)
GNC Holdings (US)
Nature’s Bounty (US)
NOW Foods (US)
NutraBio Labs (US)
Garden of Life (US)
Swanson Health Products (US)
Blackmores (Australia)
Usana Health Sciences (US)
Buy Now Premium Research Report :https://www.marketresearchfuture.com/checkout?currency=one_user-USD&report_id=1646
Industry developments & regulatory environment
➤Regulatory scrutiny & guidance – Regulators in core markets are clarifying rules around supplements, label claims and novel ingredients; this raises compliance costs but filters out low-quality entrants.
➤Supply chain & ingredient sourcing – Post-pandemic resilience, traceability expectations, and raw-material volatility (botanicals, marine oils) remain operational priorities.
➤Clinical substantiation & science – Brands investing in clinical trials and third-party certifications are better positioned to build trust and capture premium segments.
Key stakeholders
➤Manufacturers – Multinationals and contract manufacturers producing finished dosage forms.
➤Ingredient suppliers – Specialists supplying probiotics, adaptogens, collagen, botanicals, etc.
➤Retail & distribution – Pharmacies, mass-retailers, specialty chains, e-commerce platforms, and subscription/DTC channels.
➤Regulators & standards bodies – National and regional authorities and standards organizations that govern claims, safety and testing.
➤Healthcare professionals – Growing influencers in patient guidance and supplement recommendations.
➤Consumers – Segmented into preventive-health seekers, athletes/performance buyers, older adults, and trend-driven younger cohorts.
Browse In-depth Market Research Report on health supplements market: https://www.marketresearchfuture.com/reports/health-supplements-market-1646
Opportunities
➤Premiumization through clinically validated, condition-specific supplements and personalized programs.
➤Growth of DTC subscription models and telehealth integration.
➤Geographic expansion into underpenetrated APAC and LATAM markets.
Strategic recommendations
➤Invest in evidence – Fund studies for flagship products to support claims and pricing.
➤Prioritize quality & traceability – Obtain third-party certifications and publish supply-chain transparency.
➤Own the consumer relationship – Combine testing/biomarkers with subscription services to increase lifetime value.
➤Balance portfolio – Mix high-volume staple SKUs with higher-margin specialty products (probiotics, nootropics, sports nutrition).
➤Build regulatory readiness – Maintain active monitoring and a compliance roadmap for target markets.
Reasons to Buy the Health Supplements Market Report
Gain complete industry understanding to identify current market size, growth trajectory, and future revenue potential across global and regional markets.
Evaluate emerging trends and consumer shifts such as personalized nutrition, clean-label demand, and digital wellness adoption to support strategic planning.
Identify high-growth segments by supplement type, ingredient category, application area, and end-user to prioritize market entry or product expansion.
Understand regulatory and compliance environments across major markets to minimize risks and ensure smooth product launches.
Track technological and product innovations including new formulations, delivery systems, and clinically backed ingredients shaping the industry.
Spot investment and partnership opportunities across raw material suppliers, manufacturers, and distribution channels.
Analyze shifts in consumer behavior and purchasing patterns to optimize branding, pricing, and marketing strategies.
Support data-driven decision-making for R&D initiatives, product diversification, and geographic expansion.
Related Reports
Healthcare Consulting Services Market: https://www.marketresearchfuture.com/de/reports/healthcare-consulting-services-market-7860
Medical Oxygen Concentrators Market: https://www.marketresearchfuture.com/de/reports/medical-oxygen-concentrators-market-7876
Medical Marijuana Market: https://www.marketresearchfuture.com/de/reports/medical-marijuana-market-6470
Automatic Pill Dispenser Market: https://www.marketresearchfuture.com/de/reports/automatic-pill-dispenser-market-8008
Cell Culture Media Market: https://www.marketresearchfuture.com/de/reports/cell-culture-media-market-4462
Ar Vr In Healthcare Market: https://www.marketresearchfuture.com/de/reports/ar-vr-in-healthcare-market-7208
Cystic Fibrosis Market: https://www.marketresearchfuture.com/de/reports/cystic-fibrosis-market-1825
Capsule Endoscopy Market: https://www.marketresearchfuture.com/de/reports/capsule-endoscopy-market-1359
Connected Healthcare Market: https://www.marketresearchfuture.com/de/reports/connected-healthcare-market-1892
Medical Automation Market: https://www.marketresearchfuture.com/de/reports/medical-automation-market-5184
M Health Device Market: https://www.marketresearchfuture.com/de/reports/m-health-device-market-2866
Global Dental Software Market: https://www.marketresearchfuture.com/de/reports/global-dental-software-market-675
Neuropathic Pain Market: https://www.marketresearchfuture.com/de/reports/neuropathic-pain-market-1390
Advanced Baby Monitors Market: https://www.marketresearchfuture.com/de/reports/advanced-baby-monitors-market-6525
About US:
Market Research Future (MRFR) is a global market research company that takes pride in its services, offering a complete and accurate analysis with regard to diverse markets and consumers worldwide. Market Research Future has the distinguished objective of providing the optimal quality research and granular research to clients. Our market research studies by products, services, technologies, applications, end users, and market players for global, regional, and country level market segments, enable our clients to see more, know more, and do more, which help answer your most important questions.
Contact US:
Market Research Future
99 Hudson Street, 5Th Floor
New York, NY 10013
United States of America
+1 628 258 0071 (US) | +44 2035 002 764 (UK)
Email: sales@marketresearchfuture.com
This release was published on openPR.
7
12, 2025
Cardano Price Prediction: A Pump to $5? Ripple Takes Off as Digitap Is Quietly Soaring
Although the Cardano price and the price of Ripple have shown some fluctuations in the past few weeks, many influencers remain optimistic. For instance, Altcoin Piooners and DustyBC claim that massive upswings may come for these “top 10 altcoins to buy” soon. Amid all this, Digitap ($TAP) has been stealing the spotlight with its crypto presale performance.
It has managed to raise over $2 million in record time while also making early investors 188% richer. This is very impressive since the $TAP coin is now in its second presale phase. As it advances, these numbers are projected to skyrocket. In fact, many analysts predict $TAP could experience a 10x surge in 2026 – potentially making it the best crypto to buy before 2025 ends.
Cardano Projected To Reach $5 Soon – How Possible Is It?
Cardano has been going through some turbulence on the price charts recently. CoinMarketCap shows that the Cardano price fell from around $0.55 to nearly $0.40 in the past month alone. In other words, nearly a 20% drop in just a few weeks for ADA.
However, influencer Altcoin Piooners believes Cardano is still one of the good altcoins to buy. According to his X post, ADA will soon see a multi-year downtrend breakout. He claims the Cardano price could go as high as $5 as a full bull market top.
$ADA Multi-Year Downtrend Breakout Loading – Patience Pays Off 🔄🚀
Cardano is quietly printing one of the cleanest multi-year descending wedge retests in crypto. After 4+ years of compression, price is hugging the upper resistance line (~$0.48–$0.50) on the 3W/3W timeframe with… pic.twitter.com/kh1DF6W2QE
— Altcoin Piooners ™ (@AltcoinPiooners) December 3, 2025
But many traders are skeptical of this Cardano price prediction. This could be because to reach $5, its market cap would need to rise to around $230 billion – a big step up from its current one of $15 billion. Thus, the Cardano price may take some time to go as high as $5.
Ripple Hits a High Fear Level, a Potential Rebound Ahead?
Another altcoin that is experiencing volatile price changes is Ripple. For instance, the price of Ripple managed to rebound from a low point of $1.99 to as high as $2.20 on the one-week chart as per CoinMarketCap. But it failed to maintain that bullish momentum and fell to the $2 range again.
Some traders are still optimistic thanks to a bullish Ripple price prediction from influencer DustyBC. In a recent post, DustyBC informed his X community that this altcoin has hit its highest fear level since October. The last time this happened, the price of Ripple soared 22%.
Not only that, TradingView shows some bullish signs for the Ripple crypto. Notably, its momentum indicator and its MACD level are rising. Thus, the price of Ripple could see some gains soon. But, investors are still cautious as the XRP value has dipped nearly 15% on the YTD chart, meaning it could have trouble maintaining a long-term uptrend.
Digitap Soars 188% in Ongoing Crypto Presale – a Hidden Gem?
Digitap is one of the best performers in the crypto market right now. To clarify, the value of the $TAP crypto has gone up by 188%. It is in the second phase of its presale, and almost 140 million $TAP tokens have been sold so far.
This performance shows that even with the rest of the market cooling down, more investors are buying Digitap because the project has real utility and people see its potential.
It is also gaining attention from traders thanks to the launch of its global money app. With the app, users can create Digitap crypto cards backed by Visa. These cards can be physical, virtual, or even customized.
The cards can also be used for local store purchases or online purchases since Digitap has integrated with Apple Pay. This may make Digitap a dominant force in the e-banking space, which Allied Market Research claims will be worth $16 trillion by 2033.
The $TAP crypto is the backbone of this platform and it now costs just $0.0361. But this altcoin price is projected to go up in just a few days. Plus, there has been speculation of a Tier-1 CEX listing $TAP soon. This event may lead to a big price spike as demand rises. Due to all these factors, traders are turning to $TAP as the best crypto to buy this quarter.

USE THE CODE “TAPPER20” FOR 20% OFF FIRST-TIME PURCHASES
Digitap Set To Surge 10x Faster Than Cardano and Ripple?
While Cardano and Ripple are still attempting to maintain their “good altcoins to buy” status, Digitap could have the edge. It boasts a smaller market cap than both of them, which may lead to faster price growth for the $TAP coin with less money needed. Thus, analysts claim $TAP could surge 10x faster in 2026.
Additionally, its expected launch price is $0.14, meaning those who join the $TAP crypto presale today could see a 287% return. This is why people are more drawn to $TAP than its peers at the moment.
Discover the future of crypto cards with Digitap by checking out their live Visa card project here:
Presale https://presale.digitap.app
Website: https://digitap.app
Social: https://linktr.ee/digitap.app
Win $250K: https://gleam.io/bfpzx/digitap-250000-giveaway
7
12, 2025

Gold Price Forecast – Buyers Target $4,300-$4,380, XAU/USD Holds $4,198 Before Fed Rate Cut
Gold (XAU/USD) Price Forecast — Fed Rate Cut Momentum, Central Bank Demand, and Key Resistance Levels Ahead of 2026
Macro Overview: Fed Policy, Dollar Weakness, and Safe-Haven Flows
Gold (XAU/USD) continues to consolidate at elevated levels near $4,200, as traders prepare for the Federal Open Market Committee (FOMC) decision on December 9–10. Markets have priced in an 87% probability of a 25-basis-point rate cut, which would lower the federal funds range to 3.5%–3.75%. This expectation has underpinned safe-haven assets, driving steady inflows into gold despite moderate risk appetite across equity markets.
Over the past week, spot gold traded within a $4,163.80–$4,264.70 range, closing at $4,198.68, down just 0.41%. The U.S. dollar index (DXY) slipped below 102.00, reflecting soft labor market data — including a 32,000 job loss reported by ADP and 71,321 layoffs from Challenger — confirming that the economy continues to cool. Weaker yields and dovish rhetoric from policymakers have reinforced demand for non-yielding assets like gold.
Global Dynamics: Currency Depreciation and Asian Demand
The rally in gold prices has been further supported by the Indian rupee’s depreciation to 90 per dollar, driving MCX gold futures up by ₹958 (0.74%) this week to ₹85,260 per 10 grams, outperforming global benchmarks. In parallel, Comex gold futures slipped $11.9 (-0.28%), consolidating gains after touching six-week highs near $4,260. The weaker U.S. dollar has also boosted physical gold demand across Asia, especially in China and India, where retail purchases have risen over 15% month-on-month.
Geopolitical uncertainty in Eastern Europe and the Middle East continues to sustain safe-haven demand, while inflation in major economies remains above central bank targets. These macro headwinds make gold’s role as a portfolio hedge increasingly strategic for institutional and retail investors alike.
Technical Outlook: Key Levels and Pattern Analysis
From a structural standpoint, XAU/USD remains technically bullish while trading above the $4,133.95 pivot, which represents the 50% retracement between $3,886.46 and $4,264.70. As long as prices hold above this zone, buyers remain in control. A confirmed breakout above $4,264.70 would expose the next resistance at $4,381.44, marking a potential retest of the all-time high.
If sellers push below $4,133.95, initial support emerges at $4,075.58, followed by $3,886.46, which served as the October low and coincides with the upper boundary of the intermediate retracement zone at $3,720.25–$3,846.50. The RSI remains above 60, confirming momentum strength, while the MACD histogram sustains a positive bias. The overall technical configuration still favors continuation rather than reversal.
Investor Positioning and Market Sentiment
Investor sentiment in gold remains decisively positive. Institutional data show continued accumulation by central banks, with net global reserves rising by 19 tonnes in November, led by China, Turkey, and India. ETF inflows resumed modestly after two months of outflows, reflecting improving conviction ahead of the Fed meeting.
In retail markets, online gold ETFs and derivatives have seen increased trading volume — up 11% week-on-week on Comex — as traders hedge against policy uncertainty. Social sentiment data also confirm a surge in bullish positioning, with gold-related discussions rising 26% on financial platforms over the last five days.
Comparative Analysis: Gold Versus Silver and Other Metals
While gold remains the anchor of the precious metals complex, silver (XAG/USD) has outperformed in recent sessions. Comex silver surged by $2.40 (4.19%) to $59.90 per ounce, while domestic Indian silver futures skyrocketed ₹8,427 (4.81%) to ₹185,234 per kilogram. The industrial demand surge, coupled with tight global supply, has pushed analysts to forecast a move toward ₹200,000–₹225,000 per kilogram in early 2026.
Platinum and palladium posted mild gains of 0.7% and 0.4% respectively, reflecting broader sector stability. Gold’s relative performance remains steady, supported by its defensive utility, while silver’s parabolic momentum may invite near-term profit-taking.
Macro Drivers: Labor Data, Inflation, and Fed Policy Outlook
Recent U.S. macro data reinforce the Fed’s easing trajectory. The PCE inflation report showed headline inflation rising 0.3% month-over-month and 2.8% year-over-year, with core inflation also easing to 2.8%. Combined with soft labor data and declining consumer inflation expectations, this suggests the Fed has room to maintain a dovish stance.
The University of Michigan Consumer Sentiment Index climbed to 53.3, reflecting moderate optimism among consumers, yet overall inflation expectations remain anchored. If the Fed confirms a rate cut and signals a dovish roadmap into 2026, gold could easily test the $4,300–$4,380 range within weeks. Conversely, a hawkish tone could trigger a temporary pullback toward $4,100 before new buying reemerges.
Central Bank Accumulation and Institutional Strategy
The World Gold Council estimates that central banks collectively purchased over 1,000 tonnes of gold in 2025, marking the second-highest annual total in history. Persistent accumulation reflects a strategic pivot toward asset diversification and a hedge against sovereign debt and dollar volatility. Institutional investors have also increased allocations to gold-backed ETFs and mining equities.
Gold producers like Alamos Gold (AGI), Barrick Gold (GOLD), and Royal Gold (RGLD) have all raised production guidance for 2026, anticipating higher realized prices and improved free cash flow margins. AGI recently saw its price target upgraded to $49 from $44, reinforcing a bullish view across the gold equity space.
Technical Momentum: Volatility and Market Structure
Gold’s volatility profile remains stable. The CBOE Gold Volatility Index (GVZ) stands near 13.4, well below its October peak of 17.2, suggesting calm accumulation rather than panic buying. Trading volume remains elevated — averaging $65 billion daily across global futures markets — with short-term positioning favoring upside breakouts over downside corrections.
The 200-day moving average now sits at $3,960, with the 50-day EMA near $4,120, both below current prices, confirming bullish structure. Traders continue to “buy weakness,” using dips toward $4,130–$4,150 as reentry zones.
Key Events to Watch
All attention now shifts to next week’s FOMC decision, followed by the Fed Chair Jerome Powell’s press conference. Markets will also monitor U.S. Jobless Claims, Employment Cost Index, and JOLTS Job Openings data for additional policy cues. Abroad, China’s trade and inflation reports could influence gold’s medium-term trajectory through currency and import demand effects.
Outlook and Verdict
Gold (XAU/USD) trades near $4,198, holding firm above the key support of $4,133.95 as buyers defend momentum. A break above $4,264.70 could accelerate gains toward $4,381.44–$4,420, while downside support rests near $4,075.58. The 10-year U.S. yield at 4.14% and a softer dollar (DXY 101.5) continue to boost demand. ETF inflows exceeded $685 million this week, with central banks purchasing over 1,000 tonnes year-to-date. Technical strength remains intact as gold trades above its 50-day EMA at $4,120, signaling sustained accumulation. Traders eye the FOMC rate cut decision, which could trigger a new rally above $4,300. Verdict: BUY on dips between $4,100–$4,150, targeting $4,350–$4,380 short term.
That’s TradingNEWS
7
12, 2025
Dogecoin Price Prediction for 2026 Does Not Give Up Hope, but Is Not Even Close to the Explosive 100x Potential of DeepSnitch AI
The end of the year has been especially harsh for Dogecoin. Most cryptos have suffered, but DOGE has fallen to year lows, and current Dogecoin price predictions are bleak. However, there are still reasons to be hopeful for 2026, as Elon Musk’s help seems to be coming again.
Another meme coin, DeepSnitch AI, is not only hopeful but seems to have an open path to become next year’s big crypto explosion. Its AI-powered tool could change crypto investing for the best, and generate exponential returns in the process.
Is it true that you can pay for Tesla with Dogecoin?
On December 5, a report in The Street claimed that on Tesla’s website, there is a DOGE checkout code (not yet activated) that would allow you to pay for a car with Dogecoin. If confirmed, the development would likely boost Dogecoin price prediction, at least in the short term.
As it will be discussed in the Dogecoin technical analysis section, the current outlook for the dog-themed meme is pretty bearish. It is still to be seen whether, even with Elon Musk’s help (which is a big DOGE price driver), the coin can recover significant ground next year.
At any event, for other meme coins like DeepSnitch AI and MemeCore the forecast is much better, so Dogecoin’s troubles aren’t pervasive across the segment.
3 Best crypto to buy now
1. DeepSnitch AI (DSNT)
DeepSnitch AI is a fascinating combination of sophisticated AI technology with meme cultural appeal. Unlike other memes that simply add a funny character to what are otherwise use cases wholly unrelated to meme culture, DeepSnitch AI prods at the core of what memes represent.
Memes swarmed after the GameStop short squeeze, because the event was perceived by millions as a fight against injustice from powerful financial players. As it happens, DeepSnitch AI’s mission is precisely to empower small investors, leveling the playing field with big whales.
Its meme character, Snitch, a cheeky mouse dressed as a space superhero, is the perfect embodiment of this. And behind this, there is a top-notch system of AI agents that transform crypto data into business intelligence, available for everyone.
DeepSnitch AI’s successful presale confirms its huge potential. More than $680k have been raised in just the second stage, and the low entry price of only $0.02629 allows for huge upside. Additionally, those who buy at least $2,000 will get a 50% bonus, and those who buy $5,000 or more will get a 100% bonus.
But if you want to enjoy returns that would trump even the wildest Dogecoin price prediction, you need to buy now into the presale.
2. Dogecoin (DOGE)
Simply put, Dogecoin’s price prediction is currently bleak because the coin has fallen to its year low. On December 1, in the midst of the so-called “Grand Canyon drop” that affected the whole crypto, DOGE briefly touched a bottom of $0.1326.
What makes this fall more concerning is that it isn’t a solitary event. So far, as Dogecoin chart momentum shows, in the last couple of weeks the coin has fallen 3 times below what was its ultimate hard support this year: $0.14.

The reason why Dogecoin price prediction is still hopeful for 2026 is simply that, in recent history, it has rebounded from deeper troughs. A case in hand: last year it spiked from $0.10 to $0.40 in 3 months. If it has done it recently, it might do it again in 2026.
3. MemeCore (M)
MemeCore’s outlook is better than the current Dogecoin price prediction. The coin has recovered some ground after a sharp fall on November 27, when it fell abruptly from $1.90 to $1.25 in just 5 hours (a 34% drop).
However, since that day low of $1.22 it has risen to $1.38 at a time when most other memes were losing. This is a clear sign of differentiation, which might become more relevant next year.

Conclusion
Dogecoin’s price prediction has a few reasons for being hopeful. For DeepSnitch AI, the outlook is way better. This new crypto project has the potential to change crypto investing in 2026 and generate 100x-like returns.
However, those who wish to be part of that must take advantage of the generous bonuses of 50% (Code: DSNTVIP50) and 100% (Code: DSNTVVIP100). And they need to act quickly, since the bonuses will be valid only until the end of December.
Visit the official website to buy into the DeepSnitch AI presale now, and visit X and Telegram for the latest community updates.
FAQs
Why is Tesla’s checkout code relevant for DOGE?
Dogecoin’s price prediction gets pushed not because many people will actually buy a car with DOGE, but because it signals Elon Musk’s support and commitment towards the coin.
What could be differentiating MemeCore from other memes?
The fact that it has concrete utility, which “pure” memes do not have.
What makes DeepSnitch AI a unique meme coin?
Its deep alignment with the core of meme culture: cheekiness, rebelliousness, and a fight for justice.